
A Prostate Cancer Computer Aided Diagnosis Software including
Malignancy Tumor Probabilistic Classification
Alessandro Savino
1,2
, Alfredo Benso
1,2
, Stefano Di Carlo
1
, Valentina Giannini
3
, Anna Vignati
3
,
Simone Mazzetti
3
, Gianfranco Politano
1
and Daniele Regge
3
1
Department of Control and Computer Engineering, Torino, Italy
2
Consorzio Interuniversitario Nazionale per l’Informatica, Verres (AO), Italy
3
Institute for Cancer Research and Treatment, Candiolo (TO), Italy
Keywords:
Prostate Cancer, Computer Aided Diagnosis, Malignancies Probabilistic Classification, Magnetic Resonance
Imaging (MRI), Software Design.
Abstract:
Prostate Cancer (PCa) is the most common solid neoplasm in males and a major cause of cancer-related death.
Screening based on Prostate Specific Antigen (PSA) reduces the rate of death by 31%, but it is associated
with a high risk of over-diagnosis and over-treatment. Prostate Magnetic Resonance Imaging (MRI) has the
potential to improve the specificity of PSA-based screening scenarios as a non-invasive detection tool. Re-
search community effort focused on classification techniques based on MRI in order to produce a malignancy
likelihood map. The paper describes the prototyping design, the implemented work-flow and the software
architecture of a Computer Aided Diagnosis (CAD) software which aims at providing a comprehensive di-
agnostic tool, including an integrated classification stack, from a preliminary registration of images to the
classification process. This software can improve the diagnostic accuracy of the radiologist, reduce reader
variability and speed up the whole diagnostic work-up.
1 INTRODUCTION
Prostate cancer (PCa) is the most common malig-
nancy affecting men in the world. It represents the
third cause of cancer death in industrialized coun-
tries (Ferlay et al., 2013). Due to the widespread use
of screening tests, such as Prostate Specific Antigen
(PSA), five-year survival rate is high. Still, PCa di-
agnosis is obtained by transrectal ultrasound (TRUS)
guided core biopsy: several samples, usually from
12 to 16, are taken from different parts of the gland
in order to increase the probability of detecting can-
cer. Currently, there are several limitations to the ap-
plied diagnostic-therapeutic work-flow, which nega-
tively affect the quality of life of the subjects and/or
may lead to over or under-treatment of PCa (Lujan
et al., 2004). Limitations can be summarized as fol-
lows:
• PSA test has a low specificity in detecting PCa,
and can cause potential harms: additional medical
visits, adverse effects of prostate biopsies, anxi-
ety, and over-diagnosis leading to over-treatment
with its associated side effects (bowel urgency,
urinary leakage, erectile dysfunction).
• Whenever PCa is suspected, patients undergo
biopsy guided by TRUS, having a low detection
rate and low-specificity. This may determine a
diagnostic delay, which leads to a higher rate of
recurrence and to a lower patient survival rate.
• Because of the lack of techniques for precise PCa
localization and staging, current treatment strate-
gies involve the whole gland. Due to the inherent
risks associated with surgical resection and radio-
therapy, many patients developsevere side effects.
Magnetic Resonance Imaging (MRI) has been
shown promising in the identification of PCa. Physi-
cians commonly exploit it for preoperativeevaluation,
cancer staging, and image guidance for prostate inter-
ventions (T¨urkbey et al., 2012).
In particular, by combining different MRI se-
quences, it is possible to derive anatomical and func-
tional information useful to provide not only tumor
localization but also to distinguish low risk tumors
(amenable to a wait-and-see strategy or to active
49
Savino A., Benso A., Di Carlo S., Giannini V., Vignati A., Politano G., Mazzetti S. and Regge D..
A Prostate Cancer Computer Aided Diagnosis Software including Malignancy Tumor Probabilistic Classification.
DOI: 10.5220/0004799100490054
In Proceedings of the International Conference on Bioimaging (BIOIMAGING-2014), pages 49-54
ISBN: 978-989-758-014-7
Copyright
c
2014 SCITEPRESS (Science and Technology Publications, Lda.)

surveillance) from high-risk patients that will require
prostatectomy. In those terms, the combining process,
the so called multi-parametric (mp) MRI, brings de-
tection rates of clinically significant lesions consis-
tently up to 90% (Liu et al., 2009; Hoeks et al., 2011).
However, the more variables are introduced the more
difficult it is, even for the experienced reader, to in-
tegrate the available information into one reliable fi-
nal report. Usually, the interpretation of a prostate
MRI examination requires a dedicated radiologist. It
is a time consuming task, which still can lead to loose
important information due to the complexity of com-
paring high resolution anatomical features of the T2-
weighted (T2-w) images, with functional data origi-
nating from dynamic contrast enhanced (DCE) stud-
ies and diffusion weighted (DW) imaging. The com-
plexity has been observed in several studies as high
inter-reader variability (Dickinson et al., 2011).
Computer Aided Diagnosis (CAD) softwares can
help the radiologist in the diagnostic work-up and
speed up reporting tasks by automating the mp MRI
process from the different MRI sequences (Padhani
et al., 2011; Hegde et al., 2013). CAD software devel-
opment is speeding up due to the need of less invasive
medical procedures, and MRI analysis has proven
to be effective in tumor diagnosis (Vos et al., 2012;
Hegde et al., 2013; Giannini et al., 2013). Most of the
commercially available CAD solutions, like the Dy-
naCAD by Invivo(Invivo, 2013), are not designed and
developed to be integrated with new features. More-
over, most of them comes with the hardware for the
MRI.
On the open source side, a wide community of
developers has been involved in several open source
projects to develop libraries, development frame-
works, and software tools. Some of them, like the
3DSlicer framework (3DSlicer, 2013), are very popu-
lar among researchers because they provide lots of al-
gorithms and filters to easily manipulate medical im-
ages (Pieper et al., 2006; Hegde et al., 2013; Pen-
zkofer and Tempany-Afdhal, 2013). Unfortunately,
they lack of simplicity when the final goal is building
a CAD software with a custom Graphical User Inter-
face (GUI). In fact, very effectiveframeworks, such as
3DSlicer, that provide GUI capability, are not meant
to build that GUI from scratch (by forcing the user to
interact with a standardized interface). On the other
hand, looking for a modular and flexible software ar-
chitecture design and implementation, which requires
to plug new features in when a new algorithm or a fea-
ture will be proposed, introduce a challenging com-
plexity in the software design that can take advantage
from frameworks and libraries designed for that pur-
pose. Finally, all available tools are not designed with
a clinical work-flow in mind.
In this paper, we present a CAD software currently
under development by two research institutions, the
Institute for Cancer Research and Treatment of Can-
diolo (TO) and the Politecnico of Torino. The idea
is to develop a complete tool for assisted diagnosis,
from the patient data management to the final medical
report, that includes a probabilistic malignancyclassi-
fication of tumor tissue by imaging. The tool meets all
modern software paradigms, in terms of multi-tasking
and multi-platform solutions. By overcoming the lim-
itations of the current subjectiveway of analyzing MR
data, this approach could substantially improvethe di-
agnostic and therapeutic work-up of individuals with
PCa, and, in the end, dramatically improve patients’
quality of life.
The paper presents the tool by describing the
work-flow used to design the software (Section 2).
Section 3 introduces the software architecture design.
Eventually, Section 4 gives some conclusion and fu-
ture perspectives for the tool development.
2 THE SOFTWARE WORK-FLOW
The idea of our CAD software was to design a tool
to support the diagnosis process by providing a built-
in MRI multi-volumes view, including a malignancy
probability map. It had to implement a comprehen-
sive work-flow able to guide the physician from im-
age upload to the final medical report.
The software work-flow design requires to sim-
plify the user experience, by drawing sequences of
operations that quickly reach what the user is ex-
pected to do. Design very complex work-flows leads
to a huge variety of behaviors the software is going to
have to manage. This huge variety commonly comes
with low usability of the software due to the difficulty
to prevent all possible combinations of those behav-
iors. General purpose software may take advantage
of a wider flexibility given by lots of possible com-
binations of operations, but specialistic software do
not. Specialistic softwares simple work-flow leading
to small set of well-known behaviors that facilitate the
software usability and learning curve. In our case, we
have to keep the user focused on the main tasks the
software is designed for.
In particular, the classification process requires a
deep analysis to be included in the software design, in
particular, by identifying the correct way to integrate
it in the work-flow and by designing the proper user
interaction with the classification output. The final
work-flow is designed with two main goals:
1. The patient management, where the user has ei-
BIOIMAGING2014-InternationalConferenceonBioimaging
50
ther to import new patients to be diagnosed or to
manage already in-platform ones.
2. The diagnosis work-up, where the physician has
to be guided from the patient analysis (through the
visual analysis of MRI volumes and classification
results) to the patient medical report (useful either
for further analyses or for pre-surgical reports).
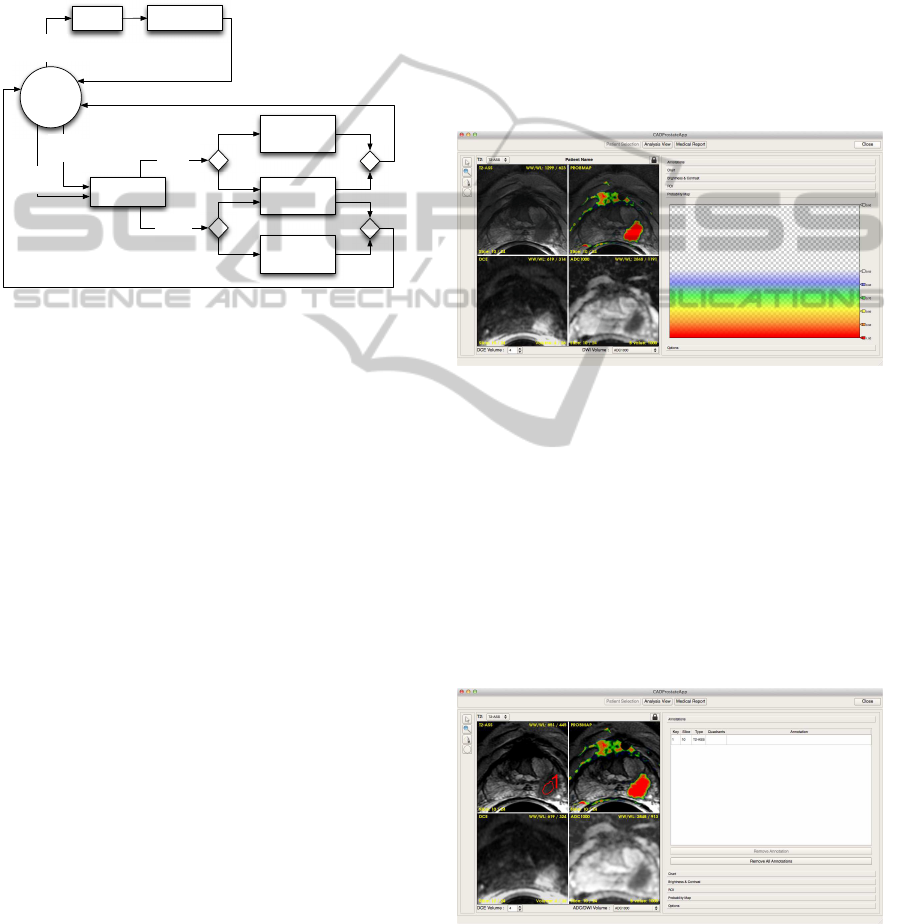
This entire work-flow is shown in Figure 1.
Action
Selection
Analysis
View
Import
Patient
Patient Folder
Analysis
Patient
Diagnosis
Patient Information
Edit
Import
Patient
Manage
Patient
Medical Report
View
Manage
Patient
MRI Analysis &
Malignancy
Classification
Patient Information
Update
Figure 1: The Software Work-Flow in details.
The patient management path is the simplest one,
and can be split in two possible flows: (i) the patient
import and (ii) the already in-platform patients man-
agement. We start focusing on the first one.
Importing a patient means, at first, being able to
analyze a MRI folder, which contains all image vol-
umes generated by the MRI machine for that patient
exam, and identify all available volumes, providing
the user with their full list. Then, the user can choose
the set of volumes to be imported so the import pro-
cess starts. During the import process, all imaging
analysis algorithms run, including registration stages,
multi-parametric analysis and the classification pro-
cess (Giannini et al., 2013), and the physician has to
enter all information about the patient (e.g., blood test
results and so on). Only when all the analyses are
completed the user will be able to conclude the im-
port.
The management of in-platform patients allows to
modify all previously entered data and to add a new
MRI exam for a given patient. In this case, the work-
flow is an alternative case of the import one: only the
MRI folder has to be analyzed and, if required, the
patient information has to be updated (e.g., if the new
exam comes with new blood tests).
The diagnosis work-up is the most flexible and
the most strict at the same time. The classification
process requires a deep analysis to be included in the
software design, in particular, by identifying the cor-
rect way to integrate it in the work-flow and by de-
signing the proper user interaction with the classifi-
cation output.Once a patient is selected, the radiolo-
gist can select the MRI volumes to be displayed, to-
gether with the probability map superimposed to the
T2-w axial MRI image (see Figure 2). Then the work-
flow lets the physician analyze all data, by navigating
volumes, i.e., in single or multi view mode. In the
multi-view mode, the diagnosis is aided by accessing
up to four views simultaneously, which may include
any of the performed MR sequences, such as DCE
volumes, DWI volumes and so on. Basic image nav-
igation tools like zoom, pan and re-slice need to be
available for each volume and time-related volumes
(such as DCE) navigation may be either space or time
dependent.
Figure 2: The prototyped GUI: the probability map can be
noticed on the first quadrant of the four images view, and
the related colors are on the right sidebar.
During the diagnosis, the user is supported by a
set of image interacting tools, such as define hand-
free and circular Region of Interests (ROIs), and a set
of extra elaborations among images, such as retrieve
wash-in and wash-out plots of ROIs. Physicians may
add annotations free-text or predefined text related to
one of the 16 prostatic regions of interest, as previ-
ously reported (Dickinson et al., 2011), and create
screenshots of peculiar image areas (see Figure 3).
Figure 3: The prototyped GUI: annotations form is on the
right sidebar.
Once the physician analysis is completed, a report
form will be available to provide the final medical re-
AProstateCancerComputerAidedDiagnosisSoftwareincluding
MalignancyTumorProbabilisticClassification
51
port. The form is provided by a set of common word-
processor tools to write the report part. All previous
annotations and screenshots can be linked in the re-
port, and an interactive 16 prostatic regions of interest
map allows the physician to better annotate the tumor
morphological position. The report is included in the
data stored for each patient.
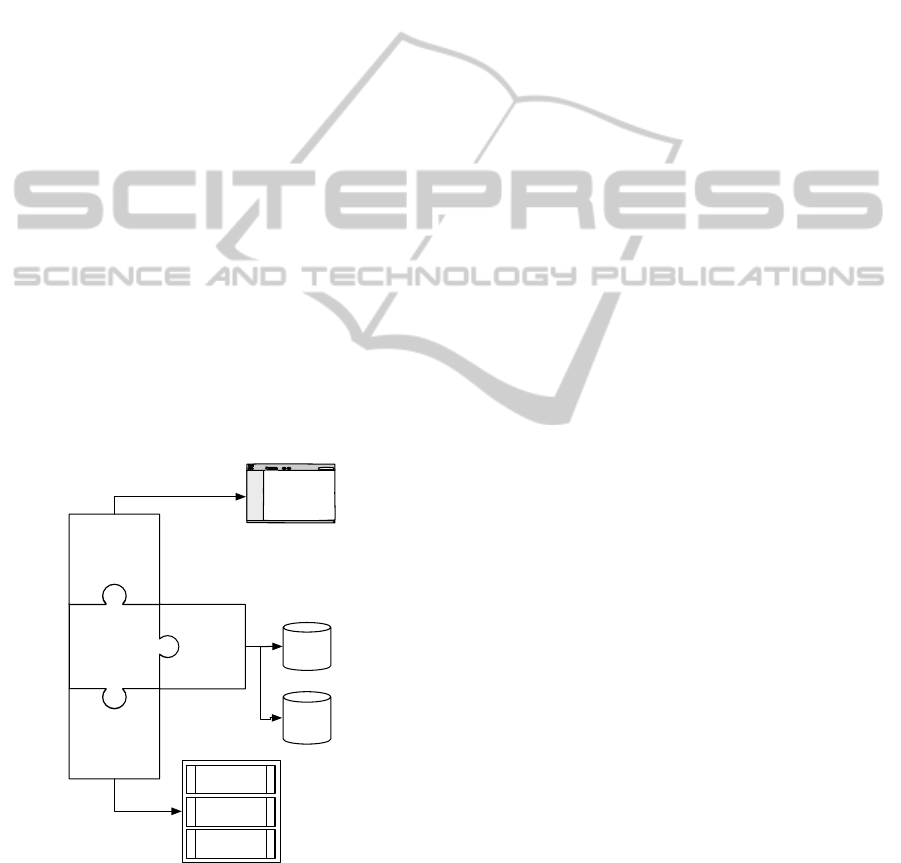
3 THE SOFTWARE
ARCHITECTURE
The software architecture has been designed to rely
on two main modules: the internal core engine and
the visualization engine (Figure 4). The internal core
engine implements all MR images manipulation, clas-
sification, and data analysis processes. The visual-
ization engine defines all graphic aspects from the
GUI interaction to the graphical rendering of MRI
volumes. We chose to implement the internal core en-
gine using Insight Toolkit (ITK) (Kitware, 2013a) and
Boost (Dawes et al., 2013) libraries, while the visual-
ization engine is a QT-based (Digia plc, 2013) appli-
cation supported by the Visualization Toolkit (VTK)
library (Kitware, 2013b). They have been chosen be-
cause they all are multi-platform libraries. Both en-
gines are based on a pipeline execution paradigm, in-
herited from ITK and VTK principles (Pieper et al.,
2006).
Communication
Channel
Internal Core
Engine
Visualization
Engine
XML
Engine
XML
Data
MRI
Volumes
Data
-
+
Malignancy
Classification
Registration
Algorithms
…
Figure 4: The Software Architecture exploited.
Since the software is an on-going research tool,
we kept the internal core engine implementation,
whenever possible, modular. This way, new al-
gorithms can be developed and plugged-in without
rewriting the software. The typical modular approach
of development framework, like 3DSlicer, is reached
by building an interpreter engine above the real ex-
ecution engine. Due to the interpretation step re-
quired, performances may suffer of this kind of ar-
chitectural implementation. In our case, we chose
to resort to a modular approach by exploiting the
C++ template mechanism. We designed all core pro-
cesses, such as the classification process, as template-
based processes: the implementation of new algo-
rithms will respond to their compliance with the tem-
plate paradigm. In particular, for the classification
process, which is the most innovativeparts of the soft-
ware, we carefully defined common input and output
formats. Thus, changes in the classification strategy
can be implemented by new modules without requir-
ing changes in the execution pipeline. All registration
algorithms (involved in the patient analysis) are also
modular, and they can be updated or modified resort-
ing to the same approach.
It can be said that modern algorithms, especially
biological and imaging ones, require a high paral-
lel implementation in order to cope with complex
tasks and to be solved in a reasonable time (Tucker-
man et al., 2000; Glockner et al., 2005). The imag-
ing and the classification algorithms heavily suffer of
time consuming issues that have been addressed by all
modern computational techniques to speed them up,
such as multi-core or multi-GPUs implementations
(Baskaran et al., 2010; Vasanawala et al., 2011). Even
so, the user interaction itself requires the software to
be everresponsive(Betz et al., 2000). To do so the im-
plementation has to resort to parallel events and tasks.
Using Boost and ITK multi-threading capabilities, we
have been able to provide the internal core engine of
a parallel architecture and implementation. Resorting
to QT, ITK and VTK events management paradigm,
we design an event-based communication channel to
connect the two cores. All parallel tasks are synchro-
nized using the communication channel: when an in-
ternal core engine task starts, i.e. an imaging algo-
rithm, the visualization engine is still able to provide
the user a continuous interaction. Once the task emits
a completion event, the communication channel takes
care of the event itself and forwards it to the visualiza-
tion engine, which can behaves as needed. The com-
munication channel assures the responsiveness of the
GUI by including in the software architecture an in-
termediate level that takes care of all time consuming
algorithms.
A final aspect we defined in the architecture is
the data infrastructure and management. Since the
amount of data required in a diagnostic tool is a huge
one (tons of images and patient information), data
have to be manipulated with ease. Because the devel-
BIOIMAGING2014-InternationalConferenceonBioimaging
52

opment of a full-feature version of the software may
take lots of time, the data have to be modified also
outside the software, i.e. by hand, both in terms of
schema and information (e.g., a new patient added,
a new set of information previously missing). More-
over, most of the data is a sensible one, so the data
management has to provide anonymizing features. At
this point, we mainly have two different choices: (i) a
relational database management system (RDBMS) or
(ii) an XML data management system.
XML and RDBMS are often mixed up to-
gether (Paoin and Boonchai-Apisit, 2009; Taghva
and Jayakumar, 2009) because XML allows to eas-
ily exchange data or to define very complex queries
(more than SQL does in some contexts, e.g., bibliog-
raphy searching) whereas relational databases orga-
nize, store and access data in a more efficient way.
Providing our software with a RDBMS would require
including in the software architecture an external en-
gine to manage a small part of the data: the patient
information. In fact, all imaging-related data, such
as MRI volumes, is not conveniently stored in a re-
lational database. Nevertheless, RDBMS data do not
come in a human-readable (due to data compression
and indexes management), so it ever requires an in-
termediate level of translation to be modified by the
user. Instead, XML data is a more human-readable
format, which can easily handle all patient data and
still permits a direct modification, even outside the
tool. From the architectural point of view, XML en-
gines are usually software classes that can be included
in a software project. In fact, QT contains several dif-
ferent libraries to manipulate XML-based documents.
Thus, we chose to add a XML engine to manipulate
an XML-based database. Since the XML engine is
implemented in QT, it can be plugged in the commu-
nication channel without further modifications.
Confidentiality has been reached by providing the
engine of an encryption module, and by properly de-
signing the GUI not to show the patient’s sensible in-
formation. Eventually, the XML engine also imple-
ment error handling to avoid difficulties during the
user testing phase of the project. Whenever a physi-
cian involved in that phase will corrupt the data for
any reason, it should be easy to solve the problem.
It can be seen that, at architectural level, we
reached a very flexible organization, taking care of
the further implementation of new functionalities that
may arise from the research field.
4 CONCLUSIONS
In this paper we give a comprehensive description of
the tool we are working on. The methodological ap-
proach for all the design aspects has been exploited
in order to give a better insight of the tool function-
alities. Although the software is under development
and still not available outside the IRCC Institute, the
first versions and demos show a promising scenario.
As soon as the main functionality will be considered
as stable, further versions will see a preliminary in-
field test, allowing the use in the diagnostic work-up.
At that development stage we plan to have a big mile-
stone review of the project, including physicians feed-
backs and intensive multi-platform performances test.
The software architecture designed guarantees
that the software lifetime can be extended by eas-
ily adding new modules and partially re-programming
the internal core pipeline. The prototyping approach
is going to be the project guideline for further CAD
projects, contributing to help time and cost reduction.
Eventually, once we’ll reach a proper develop-
ment stage, we plan to further evaluate all feasible
contributions to the ITK and VTK libraries in terms
of modules to be proposed to the community.
REFERENCES
3DSlicer (2013). 3DSlicer Project. http://www.slicer.org.
Baskaran, M., Ramanujam, J., and Sadayappan, P. (2010).
Automatic c-to-cuda code generation for affine pro-
grams. In Gupta, R., editor, Compiler Construction,
volume 6011 of Lecture Notes in Computer Science,
pages 244–263. Springer Berlin Heidelberg.
Betz, K., Leff, A., and Rayfield, J. (2000). Develop-
ing highly-responsive user interfaces with dhtml and
servlets. In Performance, Computing, and Commu-
nications Conference, 2000. IPCCC ’00. Conference
Proceeding of the IEEE International, pages 437–443.
Dawes, B., Abrahams, D., and Rivera, R. (2013).
Boost c++ libraries. [Available Online]:
http://www.boost.org/doc/libs/.
Dickinson, L., Ahmed, H. U., Allen, C., Barentsz, J. O.,
Carey, B., Futterer, J. J., Heijmink, S. W., Hoskin,
P. J., Kirkham, A., Padhani, A. R., Persad, R., Puech,
P., Punwani, S., Sohaib, A. S., Tombal, B., Villers, A.,
van der Meulen, J., and Emberton, M. (2011). Mag-
netic resonance imaging for the detection, localisa-
tion, and characterisation of prostate cancer: Recom-
mendations from a european consensus meeting. Eu-
ropean Urology, 59(4):477 – 494.
Digia plc (2013). QT Project. http://qt-project.org/.
Ferlay, J., Steliarova-Foucher, E., Lortet-Tieulent, J., Rosso,
S., Coebergh, J., Comber, H., Forman, D., and Bray,
F. (2013). Cancer incidence and mortality patterns in
europe: Estimates for 40 countries in 2012. European
Journal of Cancer, 49(6):1374 – 1403.
Giannini, V., Vignati, A., Mazzetti, S., De Luca, M.,
Bracco, C., Stasi, M., Russo, F., Armando, E., and
Regge, D. (2013). A prostate cad system based on
AProstateCancerComputerAidedDiagnosisSoftwareincluding
MalignancyTumorProbabilisticClassification
53

multiparametric analysis of dce t1-w, and dw automat-
ically registered images. In Proc. SPIE, volume 8670,
pages 86703E–86703E–6.
Glockner, J. F., Hu, H. H., Stanley, D. W., Angelos, L.,
and King, K. (2005). Parallel mr imaging: A user’s
guide1. Radiographics, 25(5):1279–1297.
Hegde, J., Mulkern, R., Panych, L., Fennessy, F., Fedorov,
A., Maier, S., and Tempany, C. (2013). Multiparamet-
ric mri of prostate cancer: An update on state-of-the-
art techniques and their performance in detecting and
localizing prostate cancer. J Magn Reson Imaging,
37(5):1035–1054.
Hoeks, C. M. A., Barentsz, J. O., Hambrock, T., Yakar,
D., Somford, D. M., Heijmink, S. W. T. P. J., Schee-
nen, T. W. J., Vos, P. C., Huisman, H., van Oort,
I. M., Witjes, J. A., Heerschap, A., and F¨utterer, J. J.
(2011). Prostate cancer: Multiparametric mr imag-
ing for detection, localization, and staging. Radiology,
261(1):46–66.
Invivo (2013). DynaCAD by Invivo Coorporation. http://
www.invivocorp.com/avs/prostate.php.
Kitware (2013a). ITK Project. http://www.itk.org/ITK/
project/project.html.
Kitware (2013b). Visualization Toolkit (VTK) Project.
http://www.vtk.org/.
Liu, X., Langer, D., Haider, M., Yang, Y., Wernick, M., and
Yetik, I. (2009). Prostate cancer segmentation with si-
multaneous estimation of markov random field param-
eters and class. Medical Imaging, IEEE Transactions
on, 28(6):906–915.
Lujan, M., Paez, A., Santonja, C., Pascual, T., Fernandez,
I., and Berenguer, A. (2004). Prostate cancer detection
and tumor characteristics in men with multiple biopsy
sessions. Prostate Cancer Prostatic Dis, 7(3):238–
242.
Padhani, A. R., Koh, D.-M., and Collins, D. J. (2011).
Whole-body diffusion-weighted mr imaging in can-
cer: Current status and research directions. Radiology,
261(3):700–718.
Paoin, W. and Boonchai-Apisit, P. (2009). Development of
surgical operation data interchange model using xml
and relational database. In Natural Language Process-
ing, 2009. SNLP ’09. Eighth International Symposium
on, pages 132–136.
Penzkofer, T. and Tempany-Afdhal, C. (2013). Prostate can-
cer detection and diagnosis: The role of mr and its
comparison with other diagnostic modalities - a radi-
ologist’s perspective. NMR Biomed.
Pieper, S., Lorensen, B., Schroeder, W., and Kikinis, R.
(2006). The na-mic kit: Itk, vtk, pipelines, grids and
3d slicer as an open platform for the medical image
computing community. In Biomedical Imaging: Nano
to Macro, 2006. 3rd IEEE International Symposium
on, pages 698–701.
Taghva, K. and Jayakumar, K. (2009). Xml based imple-
mentation of a bibliographic database and recursive
queries. In Information Technology: New Genera-
tions, 2009. ITNG ’09. Sixth International Conference
on, pages 1073–1078.
Tuckerman, M. E., Yarne, D., Samuelson, S. O., Hughes,
A. L., and Martyna, G. J. (2000). Exploiting mul-
tiple levels of parallelism in molecular dynamics
based calculations via modern techniques and soft-
ware paradigms on distributed memory computers.
Computer Physics Communications, 128(1–2):333 –
376.
T¨urkbey, B., Bernardo, M., Merino, M. J., Wood, B. J.,
Pinto, P. A., and Choyke, P. L. (2012). Mri of lo-
calized prostate cancer: coming of age in the psa era.
Diagnostic and Interventional Radiology, 18:34–45.
Vasanawala, S., Murphy, M., Alley, M., Lai, P., Keutzer,
K., Pauly, J., and Lustig, M. (2011). Practical paral-
lel imaging compressed sensing mri: Summary of two
years of experience in accelerating body mri of pedi-
atric patients. In Biomedical Imaging: From Nano
to Macro, 2011 IEEE International Symposium on,
pages 1039–1043.
Vos, P. C., Barentsz, J. O., Karssemeijer, N., and Huis-
man, H. J. (2012). Automatic computer-aided detec-
tion of prostate cancer based on multiparametric mag-
netic resonance image analysis. Physics in Medicine
and Biology, 57(6):1527.
BIOIMAGING2014-InternationalConferenceonBioimaging
54
