
Synchronization of Electroencephalography and Eye Tracking using
Global Illumination Changes
Daniel Siboska, Henrik Karstoft and Henrik Pedersen
Department of Engineering, Aarhus University, Finlandsgade 22, 8200 Aarhus N, Denmark
Keywords: Electroencephalography, Eye Tracking, Gaze Estimation, Synchronization.
Abstract: This paper describes a flexible method for synchronizing electroencephalography (EEG) and eye tracking
(ET) recordings to the presentation of visual stimuli. The method consists of embedding a synchronization
signal in the visual stimuli, and recording this signal with both the EEG and ET equipment. The signal is
recorded by the EEG device as an additional data channel, and with the camera used in the ET equipment by
modulating the global illumination of the scene in time with the synchronizing signal. The prototype system
where this method was implemented resulted in a single sample of jitter in both the EEG and ET system,
while the ET system achieved a spatial resolution of 1.26 degrees. The system will be used in future work
with augmented memory applications.
1 INTRODUCTION
Recording of brain activity through
electroencephalography (EEG) combined with
measurements of eye movements gives researchers a
powerful tool for analyzing the human visual system
(HVS) (Sereno 2003). Such tools have been used for
developing methods for enhancing the everyday life
of severely disabled people, who have no other
means of communication than modulating their eye
movement and brain wave patterns (Y. Wang et al.
2008), (Agustin 2009). Applications for ordinary
users, such as image searching and classification, are
emerging as well (J. Wang et al. 2009), (E. a
Pohlmeyer et al. 2011), and the combination of eye
tracking (ET) and EEG recording holds promise as
one of the fundamental technologies in developing
augmented memory applications (Davies 2011),
(Bell & Gemmell 2007) in the near future.
Multiple researchers (Plöchl et al. 2012),
(Görgen & Walter 2010) have set up EEG/ET-
systems where the visual stimuli is presented on a
computer display, the eye movements are measured
with a video-based eye tracker, and the EEG is
recorded with a digital recording device connected
to a computer. The synchronization of these signals
(stimuli, EEG, and eye movement) is of profound
importance if any causality between the stimuli and
the response is to be analyzed, and is a major
challenge.
This challenge is addressed by the authors in
(Görgen & Walter 2010) who use accurate control of
the timing of the appearance of each frame of stimuli
on the monitor and of the recording of each sample
from the eye tracker and EEG to achieve
synchronization of the stimuli, EEG and eye
movement. This strategy requires low level control
of the graphics hardware, as well as a special
purpose video recording device for the eye tracker.
In commercial state of the art systems such as the
RED500 with EEG headset from SensoMotoric
Instruments GmbH (SMI) and Emotiv, or the Smart
Eye Pro from Electrical Geodesics Inc. (EGI) and
Smart Eye AB, a similar low level control of the
sampling time of both EEG and ET is used.
In this article we propose an alternative strategy
for solving the synchronization issue in an EEG/ET-
system. We embed a synchronization signal in the
visual stimuli and record this signal with both the
eye tracker and EEG recording device. This offers
greater freedom in the choice of stimulus display
and video recording equipment for eye tracking, and
enables a more flexible generation of stimuli,
without the strict need for low level hardware
programming. Hereby already available hardware
can be used when a researcher wants access to a
combined EEG/ET system, instead of having to
acquire new hardware.
The following section describes the hardware
and software algorithms used in the combined
EEG/ET setup. Subsequently we evaluate the
55
Siboska D., Karstoft H. and Pedersen H..
Synchronization of Electroencephalography and Eye Tracking using Global Illumination Changes.
DOI: 10.5220/0004800400550060
In Proceedings of the International Conference on Bio-inspired Systems and Signal Processing (BIOSIGNALS-2014), pages 55-60
ISBN: 978-989-758-011-6
Copyright
c
2014 SCITEPRESS (Science and Technology Publications, Lda.)
performance of this setup regarding spatial accuracy
of the eye tracker as well as timing jitter between the
stimulation presentation and EEG as well as eye
movement recordings.
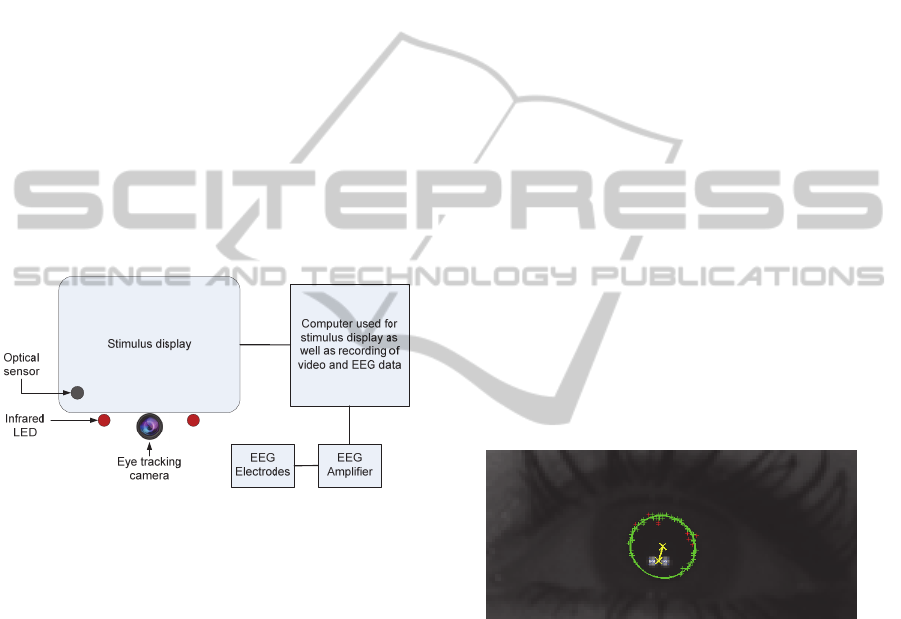
2 METHODS AND MATERIALS
The developed system is outlined in
Figure
1, and comprises the following subsystems:
Eye Tracker - consisting of two infrared (IR)
light emitting diodes (LED) directed towards the
face of the subject, as well as a camera with infrared
recording capabilities used to record the eye
movement of the subject.
EEG Recorder - including an EEG cap with
active electrodes and a 16 channel EEG amplifier
with additional trigger input.
Visual Stimulus Presentation - consisting of a
large computer display with a dedicated area for
embedding the synchronization signal.
Figure 1: Overview of the hardware used in the combined
EEG / Eye tracking system.
Synchronization System - consisting of an optical
sensor measuring the signal in the dedicated
synchronization area on the stimulus display and
regulating the intensity of the IR LEDs based on the
signal from the optical sensor. The optical sensor
output is connected to the EEG amplifier as well.
All of the subsystems are controlled by a central
computer.
2.1 Eye Tracking Hardware
Eye movements were recorded with a remote video
eye tracking system using the pupil-center corneal-
reflection (PCCR) technique (Villanueva et al.
2009). The PCCR technique requires two infrared
illumination sources to produce two distinct
reflections on each eyeball and to provide general
illumination of the subjects face.
The camera used to record the eyes was a Basler
ACA640-100gc GigE camera with a resolution of
658 x 492 pixels and a maximum frame rate of 100
Hz. The camera used a fixed focus lens with a focal
length of 16 mm, which resulted in a field of view of
10 x 15 cm at the operating distance of 60 cm.
Attached to the lens was a Schneider Kreuznach 093
IR pass filter which helped control the exposure of
the camera sensor, since the IR LEDs were the
dominating source of infrared illumination in the
setup.
Each of the illumination sources in our system
comprised a cluster of four OSRAM SFH485
infrared (IR) light emitting diodes (LED). Since the
subjects were exposed to the infrared radiation for
extended periods of time, the current through each
LED was limited to avoid exceeding the long term
exposure limit for the retina (Jäger 2010). The
infrared LEDs were also used as part of the
synchronization system by modulating the global
illumination of the camera scene based on the signal
from the optical sensor. This is described further in a
later section.
2.2 Eye Tracking Algorithm
The PCCR technique uses the two reflections of the
LEDs on each cornea of the eyes as well as the
location of pupil center in the video stream to
determine the direction of the subjects gaze.
Figure 2: Eye tracking features extracted from each eye.
Blue: Corneal reflections. Yellow: PCCR vector. Green
and red: Edge points found by the starburst algorithm (Red
points were rejected by RANSAC step).
The reflections were extracted from each video
frame by calculating a difference of Gaussians
(DoG) and thresholding the result, which resulted in
a number of candidate clusters. The corneal
reflections for each eye were found as the best fit of
the distance and orientation of each pair of candidate
clusters to an experimentally established mean
distance and mean orientation, which was obtained
by manually measuring on a video frame from 12
test subjects.
The positions of the corneal reflections were
refined on a sub-pixel level by fitting a constrained
BIOSIGNALS2014-InternationalConferenceonBio-inspiredSystemsandSignalProcessing
56

2D Gaussian to the corneal reflection using least
squares.
The pupil centers were found using a modified
Starburst algorithm (Winfield & Parkhurst 2005).
The first step in the Starburst algorithm is to
threshold the vicinity of the corneal reflections to
find a rough estimate of the pupil’s location. This
first estimate is used as a starting point for a search
for gradients above an experimentally established
threshold along rays extending from the center of the
blob. If such gradients are found, the positions are
added to a list of potential edge points. This search is
repeated for each of the located potential edge
points, with rays directed back towards the center of
the blob. When the geometric center of the edge
points converges, the list of points is used in a
RANSAC (Fischler & Bolles 1981) based search for
an ellipse representing the edge of the pupil. The last
step in the algorithm is to refine the position of the
ellipse using an optimization step. The optimization
searches for the strongest gradient along the edge of
the pupil, with experimentally established
constraints on the size and eccentricity of the ellipse.
The output of the algorithm is the PCCR vector from
the center of the two corneal reflections to the center
of the pupil for each eye. The extracted features are
shown in Figure 2.
To map the relative locations of the corneal
reflections and pupil (PCCR vector) to a point on the
stimulus display, a mapping function was calculated
individually for each eye of each subject. The
mapping function from PCCR vector to the image
coordinates is a second order polynomial in two
variables of the form:
22
12 3 456
22
12 3 456
screen
screen
x
ax ay axyaxaya
ybxbybxybxbyb
, where
s
creen
x
and
s
creen
y
are the coordinates in the
image,
x
and
y
are the coordinates of the PCCR
vector, and
1...6
a
and
1...6
b
are subject specific
constants.
To determine the constants in the mapping
function, each subject was presented with a standard
calibration screen on the stimulus display with nine
fixation targets in a three-by-three grid. The subjects
were asked to fixate on each of the nine patterns in
turn, while 100 frames (1 second) of video were
recorded for each position. Since the position on the
stimulus display of each pattern was known, the best
fitting mapping constants could be found by
calculating the least squares fit on all PCCR vectors
extracted from the 900 frames of video.
2.3 EEG Recording Hardware
EEG data were recorded using a 16 channel G.tec
g.USBamp with the g.GAMMAsys active electrode
system. The data were recorded at a sampling rate of
1200 Hz and post processed with a band-pass filter
between 0.1 Hz and 200Hz. During recording all
electrodes were referenced to the Cz electrode
position and the cheek was connected to ground.
2.4 Visual Stimulus Presentation
and Synchronization
The presentation of visual stimulus as well as the
embedded synchronization signal was shown on a
26” LG DT-3003X display with a resolution of 1280
x 768 pixels and a refresh rate of 60 Hz. The face of
the subjects were placed 60 cm from the monitor
slightly below the center.
A dedicated area of 20 x 20 pixels in the lower
left corner of the stimulus display was used for the
embedded synchronization signal. The
synchronization signal can be viewed as a one bit
wide serial data link between the stimulus display
and the ET and EEG recorder. A ‘0’ is coded by
turning the dedicated area black, while a ‘1’ is
represented by a white area.
The detection of the synchronization signal on
the stimulus display is achieved by the use of an
optical sensor. The detected signal is sent to the
EEG amplifier and is used by the synchronization
hardware to modulate the illumination used in the
eye tracker. The amount of light from the high and
low level of this modulation is chosen to allow
robust detection of the synchronization signal from
the video stream, without compromising the fidelity
of the video through under- or overexposure of the
camera sensor.
When this is accomplished, the histogram of the
video frames with low illumination can be
transformed to match the frames with high
illumination before the ET algorithm.
The synchronization signal was extracted from
the video stream by calculating the number of pixels
whose intensities changed in a positive direction and
subtracting the number of pixels whose intensities
changed in a negative direction between each pair of
frames. The resulting signal showed a strong
resemblance with the time derivative of the original
synchronization signal and had strong positive and
negative peaks when the global illumination of the
scene changed rapidly. A typical example of this
kind of signal is shown in Figure 3 along with the
SynchronizationofElectroencephalographyandEyeTrackingusingGlobalIlluminationChanges
57
original synchronization signal as well as the time
derivative.
Figure 3: Original (s) and extracted (ET sync) sync signal.
The extracted signal is calculated as the normalized
difference between the number of pixel intensities
changed in a positive and negative direction.
3 RESULTS
3.1
Spatial Precision of the Eye Tracker
The spatial precision of the eye tracker was
evaluated by having a group of 12 subjects go
through the procedure of calibrating the eye tracking
system followed by a validation procedure.
Table 1: Bias and standard deviation of eye position for
the 9 areas of the display measured in degrees of visual
angle.
x: -0.18 ± 0.43 °
y: 0.05 ± 0.31 °
x: 0.13 ± 0.38 °
y: 0.30 ± 0.38 °
x: 0.01 ± 0.33 °
y: -0.20 ± 0.35 °
x: 0.22 ± 0.35 °
y: -0.17 ± 0.32 °
x: 0.18 ± 0.46 °
y: -0.33 ± 0.60 °
x: -0.40 ± 0.47 °
y: 0.54 ± 0.63 °
x: 0.01± 0.41 °
y: 0.18 ± 0.31 °
x: -0.31 ± 0.34 °
y: -0.13 ± 0.31 °
x: 0.34 ± 0.41 °
y: -0.25 ± 0.44 °
During the validation procedure a grid of 9 fixation
patterns was shown, one after the other, and one
second of eye movement was recorded while the
subject fixated on each pattern in turn. The accuracy
and precision of each of the 9 positions are shown in
visual angle in Table 1.
3.2
Measurement of Synchronization
Jitter
The synchronization of the stimulus display and the
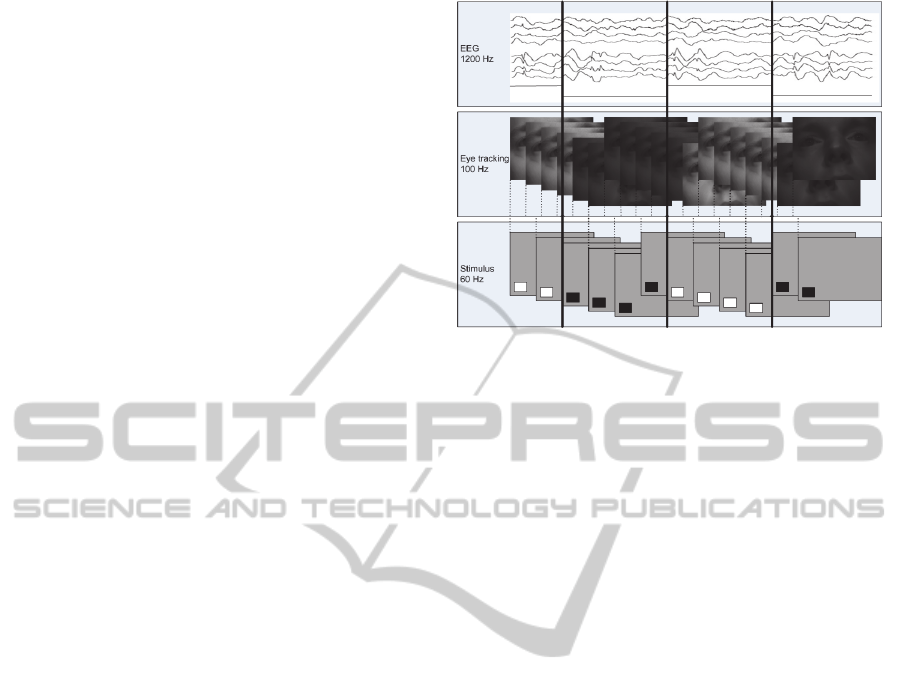
eye tracker was subject to timing jitter. The primary
cause of this jitter is illustrated in Figure 4 where it
can be seen that with the eye tracker’s frame rate of
100 Hz, there can be a delay of up to 10 ms before a
change in the synchronization signal presented on
the stimulus display is recorded by the eye tracker.
To measure if any other sources of timing jitter
between the stimulus display and the eye tracker
were present, a simple stimulus, which is used in
visual evoked potentials (VEP) experiments, was
shown to one subject. The stimulus showed a
checkerboard with each square alternating between
black and white. One of the alternating squares
resided in the dedicated synchronization area on the
display.
The frequency of the alternating black and white
squares must divide the display refresh rate into an
integer, so a frequency of 7.5 Hz was chosen,
resulting in 4 consecutive frames of the same color
being displayed before changing color. The
synchronization signal was extracted from the video
stream (as shown in Figure 3) and the variation in
time between each period was calculated. The period
of the original signal was 133.3 ms, and the
maximum as well as minimum period extracted from
the eye tracking signal was 130.0 ms (13 frames)
and 140.0 ms (14 frames) respectively. In other
words, only a single frame of jitter was present in
the extracted synchronization signal. The signal-to-
noise ratio of the extracted synchronization signal
was 37.6 dB.
The amount of jitter in the EEG recordings was
evaluated with the same experimental setup as
described above, and the maximum as well as
minimum period extracted from the EEG data was
132.5 ms (159 samples) and 134.1 ms (161 samples)
respectively.
3.3
Real-time Performance
To determine if it would be possible to make the
stimulus display dependant on the current fixation
target in a closed loop experiment, the runtime
performance of the eye tracking algorithm was
evaluated. The processing frame rate on a 3.4 GHz
Intel Core i5 computer was 10 Hz.
4 DISCUSSION
The focus of the combined eye tracking and EEG
recording setup presented in this article is on high
flexibility and acceptable performance for HVS
experiments. Compared to state of the art
commercial remote eye tracking and EEG solutions,
such as the RED500 with EEG headset from
SensoMotoric Instruments GmbH (SMI) and
Emotiv, or the Smart Eye Pro from Electrical
Geodesics Inc. (EGI) and Smart Eye AB, the
presented system has some limitations due to the
choice of hardware used in the implementation.
BIOSIGNALS2014-InternationalConferenceonBio-inspiredSystemsandSignalProcessing
58
The methods developed are not limited to be
used with the chosen hardware, therefore, it is
expected that the performance of the system will
improve if the hardware is improved.
The camera used in the system was able to
achieve a temporal resolution of 10 ms with no more
than one frame of jitter, which makes it possible to
distinguish between saccades and fixations in the
eye movement data. If the dynamic behavior of the
saccades needs to be analyzed, a camera with a
higher temporal resolution must be used, such as the
500 Hz camera used in the RED500 eye tracker.
In general the jitter will be uniformly distributed
with a minimum and maximum of -10 and +10 ms
respectively. This amount of jitter makes it difficult
to use the eye tracking data directly for eliminating
EOG artifacts in the EEG data; however it gives a
rough estimate of the time of such artifacts, which
can then be refined further.
The amount of jitter in the EEG recordings was
measured to be within a single sample, and can
therefore be expected to be uniformly distributed
with a minimum and maximum of -0.8 and +0.8 ms
respectively. Since the peaks from the event-related
potentials (ERP) recorded by the EEG device are
generally separated by tens or hundreds of ms (Luck
2005), this amount of jitter does not affect the ability
to resolve individual ERPs.
The spatial accuracy of the system was measured
to be 1.26° in the worst case, which is comparable to
the performance of 1.01° achieved by (Villanueva et
al. 2009) and slightly worse than the advertized
accuracy of 0.4° for the RED500.
The obtained spatial resolution is sufficient to
use the system in a brain computer interface (BCI),
if the distance between fixation targets is kept above
this lower limit. For reliable control of a general
purpose computer interface designed for use by a
computer mouse, a higher spatial resolution is
required.
The human eye is able to attend to any target
within a 2 degree cone of the fixation point without
eye movement (Fairchild 1998). Even with higher
accuracy, there will still be a high degree of
ambiguity as to which target the subject is directing
the attention towards within this 2 degree cone, so
for many HVS studies, the obtained resolution is
sufficient.
The runtime performance of the software
algorithms suggests the possibility of using the
developed system in closed-loop experiments, where
the visual stimuli depend on the fixation point, if the
lower temporal resolution of 10 Hz is sufficient. A
complete evaluation of the possibility of real-time
performance with an optimized implementation of
Figure 4: Diagram showing the primary cause of timing
jitter between the stimulus display and the eye tracker and
EEG recording respectively.
the algorithms resulting in higher frame rates is
beyond the scope of this article.
In the experiments presented in the previous
section, the synchronization signal was used as a
very simple clock signal, however since arbitrary
data can be encoded in the synchronization signal, it
is possible to use this communication channel to
embed information about the stimuli directly in the
ET video. One suggested use of this feature would
be in the visual oddball paradigm (Courchesne et al.
1975), where different types of objects or characters
(target, non-target and novelty) are presented to the
subject sequentially. Using the synchronization
signal as a data channel, the type of object currently
presented to the subject could be embedded directly
in the eye tracking data.
The results presented in this paper will be used
as the foundation for future work in augmented
memory applications.
5 CONCLUSIONS
In this paper we have described the general
implementation of a combined EEG and eye
tracking system, as well as a new flexible way to
solve the problem of synchronizing the different data
sources in the system. The proposed synchronizing
method forgoes the need for low level control of the
sampling time of eye tracker and EEG as well as
presentation time of the visual stimuli. This in turn
eases the development of different types of stimuli
and enables the use of a wider range of eye tracking
camera and EEG recording equipment. The results
obtained with the reference implementation of this
SynchronizationofElectroencephalographyandEyeTrackingusingGlobalIlluminationChanges
59

method are comparable to similar systems with
respect to the spatial and temporal resolution, and
the amount of jitter in the system is primarily
dependent on the temporal resolution of the eye
tracking and EEG recording equipment.
REFERENCES
Agustin, J. S., 2009. Low-Cost Gaze Interaction : Ready to
Deliver the Promises. , pp.4453–4458.
Bell, G. & Gemmell, J., 2007. A Digital Life. Scientific
American, 296(3), pp.58–65.
Courchesne, E., Hillyard, S.A. & Galambos, R., 1975.
Stimulus novelty, task relevance and the visual evoked
potential in man. Electroencephalography and
Clinical Neurophysiology, 39(2), pp.131–143.
Davies, S., 2011. Still building the memex.
Communications of the ACM, 54(2), p.80.
Fairchild, M., 1998. Color Appearance Models, Reading,
Mass.: Addison, Wesley, & Longman.
Fischler, M. A. & Bolles, R.C., 1981. Random Sample
Consensus: A Paradigm for Model Fitting with
Applications to Image Analysis and Automated
Cartography. Communications of the ACM, 24(6).
Görgen, K. & Walter, S., 2010. Combining Eyetracking
and EEG. Publications of the Institute of Cognitive
Science, 15.
Jäger, C., 2010. Eye Safety of IREDs used in Lamp
Applications Application Note,
Luck, S., 2005. An Introduction to the Event-Related
Potential Technique (Cognitive Neuroscience) 1st ed.,
A Bradford Book.
Plöchl, M., Ossandón, J. P. & König, P., 2012. Combining
EEG and eye tracking: identification, characterization,
and correction of eye movement artifacts in
electroencephalographic data. Frontiers in human
neuroscience, 6(October), p.278.
Pohlmeyer, E. a et al., 2011. Closing the loop in cortically-
coupled computer vision: a brain-computer interface
for searching image databases. Journal of neural
engineering, 8(3), p.036025.
Sereno, S., 2003. Measuring word recognition in reading:
eye movements and event-related potentials. Trends in
Cognitive Sciences, 7(11), pp.489–493.
Villanueva, A. et al., 2009. A geometric approach to
remote eye tracking. Universal Access in the
Information Society, 8(4), pp.241–257.
Wang, J. et al., 2009. Brain state decoding for rapid image
retrieval. Proceedings of the seventeen ACM
international conference on Multimedia - MM ’09,
p.945.
Wang, Y. et al., 2008. Brain-computer interfaces based on
visual evoked potentials. IEEE Eng Med Biol Mag,
27(5), pp.64–71.
Winfield, D. & Parkhurst, D.J., 2005. Starburst: A hybrid
algorithm for video-based eye tracking combining
feature-based and model-based approaches. In 2005
IEEE Computer Society Conference on Computer
Vision and Pattern Recognition (CVPR’05) -
Workshops. IEEE, pp. 79–79.
BIOSIGNALS2014-InternationalConferenceonBio-inspiredSystemsandSignalProcessing
60
