
Divide-n-Discover
Discretization based Data Exploration Framework for Healthcare Analytics
Si-Chi Chin
1
, Kiyana Zolfaghar
1
, Senjuti Basu Roy
1
, Ankur Teredesai
1
and Paul Amoroso
2
1
Center for Web and Data Science, Institute of Technology, The University of Washington - Tacoma,
1900 Commerce Street, Tacoma, WA 98402-3100, U.S.A.
2
Multicare Health System, 315 Martin Luther King Jr Way Tacoma, WA 98405, U.S.A
Keywords:
Hospital Readmission Risk Prediction, Discretization, Data Exploration.
Abstract:
Insightful and principled visualization techniques may successfully help complex clinical data exploration
tasks and aid in the process of knowledge discovery. In this paper, we propose a framework Divide-n-Discover
to visualize and explore clinical data effectively, and demonstrate its effectiveness in predicting readmission
risk for Congestive Heart Failure patients. Our proposed method provides clinicians a mechanism to dynami-
cally explore the data and to understand how a single factor may influence the risk of readmission for a given
patient. For example, our study indicates that patients between age 47 and 48 have 2.63 time higher chance
of getting readmitted to the hospital within 30 days, compared to other patients; likewise, patients with length
of stay above 13 days are 2.27 times more likely to be readmitted within 30 days. The finding suggests that
hospitals might be under pressure to discharge patients within two week while some patients may benefit from
a longer stay. These observations may become valid hypotheses leading to further clinical investigation or
discoveries. To the best of our knowledge, this is the first ever work that proposes principled discretization
and visualization techniques in the hospital readmission risk prediction problem.
1 INTRODUCTION
Data interpretation and exploration is a complex pro-
cess in healthcare analytics. The primary challenge
arises due to prevalence of noise and missing val-
ues in the dataset, heterogeneity and diverse nature
of the sources, very high dimensionality and sparsity,
to name a few. Information visualization is a com-
pelling technique for the exploration and analysis of
the large, complex data set. Visualization techniques
also facilitate the involvement of domain experts in
the healthcare knowledge discovery process to im-
prove clinical diagnoses and related tasks. In this pa-
per, we propose an interactive framework Divide-n-
Discover that uses discretization techniques to iden-
tify patterns in clinical data to support data explo-
ration, interpretation, and visualization. We study the
problem of predicting the risk-of-readmission (hence-
forth referred to as RoR) for Congestive Heart Failure
(CHF) patients within 30-days
1
of discharge, which
1
30 day is chosen as the readmission window, because it
is a clinically meaningful time-frame for the hospitals and
medical communities to take action and reduce the proba-
bility of readmission (Krumholz et al., 2008)
has received extensive attention among healthcare
professionals (Krumholz et al., 2008; Kansagara D,
2011; Zolfaghar et al., 2013a; Zolfaghar et al., 2013b;
Zolfaghar et al., 2013c). We demonstrate the ef-
fectiveness of discretization to explore and visualize
complex clinical data, leading to improved prediction
of readmission risk.
More specifically, we are interested in answering
questions such as: Do patients of certain age have
higher RoR for CHF? Does the length of hospital stay
affect such readmission risk? Does certain difference
between the Systolic and Diastolic blood pressure
lead to higher readmission risks? Our study involves
the investigation of several numeric factors (i.e., vari-
ables) that directly attributes to CHF readmission,
such as age, BMI, blood pressure, length of stay in
the hospital, respiration, pulse rate, etc and apply
discretization to identify meaningful cut-points (Liu
et al., 2002; Chin et al., 2012). Our proposed dis-
cretization based data exploration techniques derive
intuition and understanding of the clinical data, iden-
tifying unexpected patterns, or potential outliers. Ad-
ditionally, it allows healthcare domain experts to ef-
ficiently and effectively sift through complex health-
329
Chin S., Zolfaghar K., Basu Roy S., Teredesai A. and Amoroso P..
Divide-n-Discover - Discretization based Data Exploration Framework for Healthcare Analytics.
DOI: 10.5220/0004802403290333
In Proceedings of the International Conference on Health Informatics (HEALTHINF-2014), pages 329-333
ISBN: 978-989-758-010-9
Copyright
c
2014 SCITEPRESS (Science and Technology Publications, Lda.)
care datasets. To the best of our knowledge, this is the
first ever work that applies discretization to the prob-
lem of RoR for CHF patients.
The contributions of our work could be summa-
rized as follows:
• We initiate the study of discretization techniques
to visualize clinical data that helps healthcare pro-
fessionals to distinguish useful patterns in the
data, and enables improved exploration of a large
volume of data.
• We quantify the effectiveness of discretization
based data exploration techniques using Odds Ra-
tio (OR) (Szumilas, 2010), providing quantified
evidence to the visual observations derived from
the data exploration.
• Using a real world clinical dataset, we empirically
demonstrate the effectiveness of discretization to
predict the RoR for CHF patients, a pressing prob-
lem in the healthcare domain.
The rest of the paper is organized as follows: Section
2 describes the discretization framework as a visual-
ization tool for data exploration and understanding.
Section 3 discusses the clinical insights derived from
the preliminary results. We summarize related works
in Section 4. Section 5 concludes the paper and indi-
cates directions for future work.
2 FRAMEWORK Divide-n-Discover
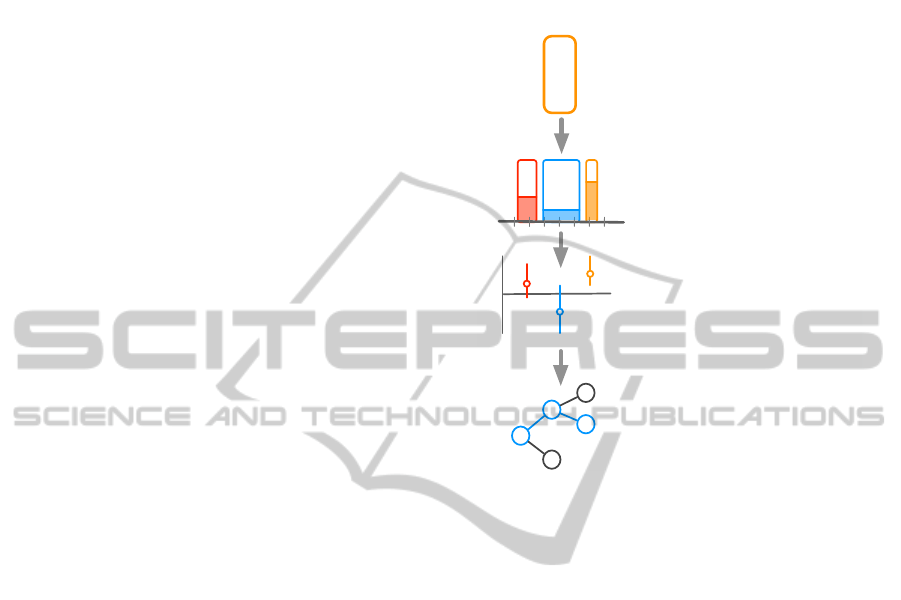
Figure 1 illustrates our visual interactive framework –
Divide-n-Discover, to demonstrate how we can incor-
porate the domain experts in the process of clinical
knowledge discovery. Healthcare professionals can
first decide which numeric attribute they would like to
investigate. The process of discretization based visu-
alization could help identifying unexpected patterns,
either the noise or meaningful outliers, among certain
data segments. Healthcare domain experts can further
investigate and quantify the discretization results us-
ing OR. Finally, the domain knowledge acquired from
the discretization process is used to select data seg-
ment or attributes to construct predictive models.
2.1 Discretization for Data Exploration
and Visualization
While much of the knowledge discovery is reliant on
machine power these days, automated processes are
often dependent on human judgment and intelligence
for accuracy. In this section, we visualize the dis-
cretized risk factors to help healthcare professionals
to explore clinical data. We also provide OR (Szumi-
las, 2010) analysis to interpret the results of the visu-
alization.
!"#$%&#$!'(
!)#$*+#$"'*
",#$(!#$-'+
!
!"#$%#&'&"()$*)+$',-")&./&0(1
"#$#%&'&()*#&'
+,-#).%'(/).0,&#
12#+345',+#67#%'
2.8%)#39(3:+'
)#8,$&8
;,(+345'&<#'=.8,($'
:08#)=(3:+',8.+*'
:228')(3:'
"#$#%&'2(&('8#*-#+&8'
:)'2.8%)#39#2'
(/).0,'&:'%:+8&),%&'
7)#2.%3=#'-:2#$8
>
Figure 1: Divide-n-Discover interactive framework.
In this work, we use the Chi-Merge algo-
rithm (Kerber, 1992) to divide numeric attributes and
investigate the potential inconsistent intervals. Chi-
Merge (Kerber, 1992) is a supervised, bottom-up
(merging) discretization method. The algorithm pro-
vides the flexibility to manipulate the threshold to
control the number of intervals. It allows users to ob-
serve the patterns as the number of intervals increases.
It uses the chi-square statistic to determine if the class
frequencies of the two intervals are significantly dif-
ferent. The algorithm consists of an initialization step
and a bottom-up merging process, where intervals are
continuously merged until a termination condition is
met. The potential cut-points are investigated by test-
ing the adjacent intervals by the independence test.
Divide-n-Discover uses two termination condi-
tions: the number of intervals and a selected signif-
icance level (p-value or α). A selected significance
level (α) determines the value of χ
2
threshold. An in-
appropriate threshold may over or under discretize a
factors. However, instead of finding the optimal dis-
cretization, our goal is to use Chi-Merge to explore
numeric data. Therefore, the flexibility of tuning the
threshold is desirable in our study.
Furthermore, we use OR for each interval to eval-
uate the consistency and the trends of the data to quan-
tify the effectiveness of discretization results. OR
measures the association or non-independence be-
HEALTHINF2014-InternationalConferenceonHealthInformatics
330
tween two data values. OR is used to approximate and
compare whether patients who satisfy certain range
for the numeric variables (e.g., particular range of age
or length of stay) have higher RoR. If OR=1, it indi-
cates that no association is observed between the dis-
cretized result and the RoR. If OR>1, it indicates that
the discretized result (e.g. patient between certain age
range) has higher RoR.
2.2 Discretization for Predictive
Modeling
Attributes in clinical data are often numeric (i.e., con-
tinuous), such as age, blood pressure, and lab tests.
However, many machine learning algorithms (e.g. de-
cision trees, induction rules) work better – or work
only – with categorical attributes (Liu et al., 2002).
The data exploration process described in the previ-
ous section could help identify relevant variables to
improve predictive modeling. Additionally, the dis-
cretized variables are easier to use, explain, and un-
derstand. The proposed Divide-n-Discover frame-
work could help researchers select a set of meaningful
variables or a subset of data to construct predictive
modeling. For example, clinical research may only
want to study patients with certain age range that has
higher RoR to enhance the knowledge of the problem.
Our experiments emphasize how discretized variables
can improve predictive modeling.
1
2
3
4
5
LOS
Odds ratio & 95% CI
Bin
Bin1
Bin2
Bin3
Bin4
Bin5
1
2
3
4
Age
Odds ratio & 95% CI
Bin
Bin1
Bin2
Bin3
Readmission*within*30*daysReadmission*within*30*days
LOS
Age
2.5 7.5 13.5 14.5
47.5 48.5
Figure 2: Examples of OR analysis.
In our experiments, we use logistic regression
model to predict 30-day RoR for CHF patients using
only continuous variables, and compare the results
with and without discretization. We also compare
C4.5 and Chi-Merge using J48 decision trees. Both
models are combined with oversampling to overcome
the problem of class imbalance in the dataset. We per-
form Chi-Merge on the training set and assign the dis-
cretized results to the testing set.
2.3 Application Scenario
We use a patient cohort provided by a healthcare sys-
tem in the northwest region in the U.S. to demonstrate
Divide-n-Discover. his dataset contains 11,184 pa-
tient records with CHF as the primary or secondary
diagnosis. A patient record has been labeled as “read-
mission = yes” (or class 1), if this hospitalization is
within 30 days of discharge of an earlier index hospi-
talization due to CHF, or ‘readmission = no” (or class
0) otherwise.
We selected 9 numeric variables for the experi-
ments. They are: Age, BMI, Max Systolic Blood
pressure, Max Diastolic Blood pressure, Difference
Between Systolic and Diastolic, Length of Stay, Ejec-
tionFractionVAL, Respiration rate, and Pulse rate. As
an exploratory study, we select two numeric attributes
– Length of Stay (LOS) and Age – to test Divide-n-
Discover in Section 3. The two attributes are com-
monly presented for all patients and are less influ-
enced by the problem of missing values.
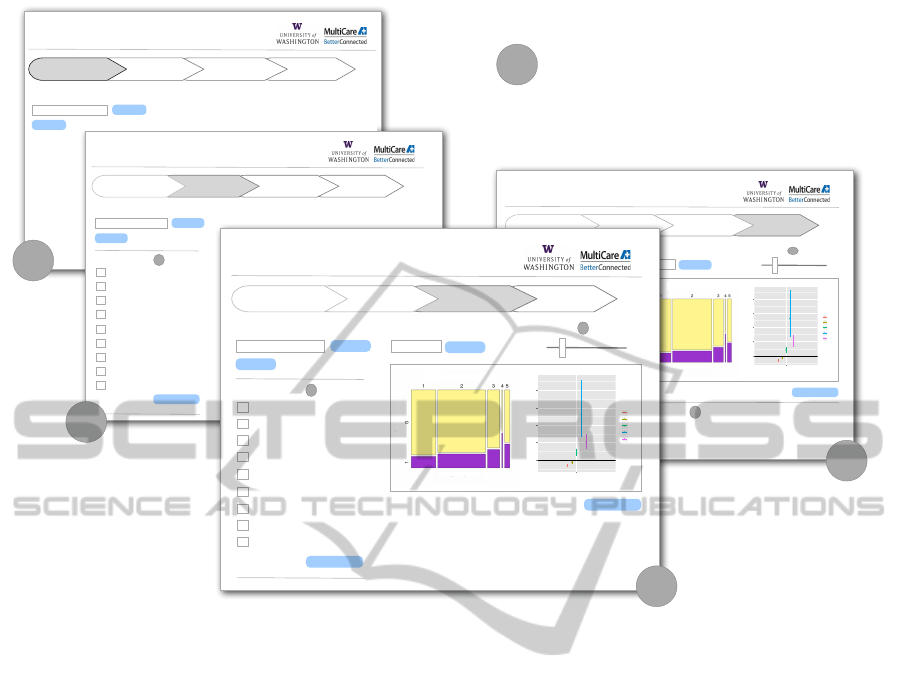
As shown in Figure 3, the interactive system in-
volves four steps. Step 1 involves data input. A user
may select a dataset (in .csv or .arff format) of inter-
est for the analysis. Step 2 outputs a list of numeric
attributes extracted from the data. A user may select
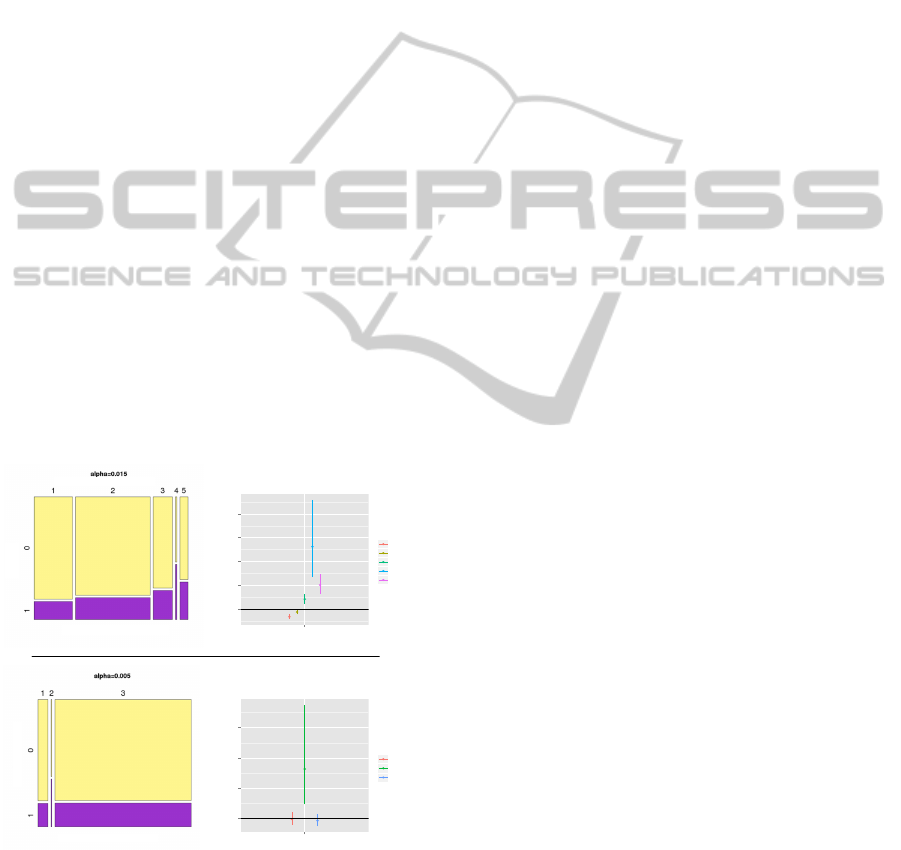
one or more attributes to discretize. Step 3 visualizes
the discretization results based on the specified num-
ber of interval or the value of p-value (α). Finally, a
user may compare the quality of prediction using the
discretized attribute(s) in Step 4.
3 CLINICAL INSIGHTS
Divide-n-Discover aims to support clinicians with
real-time analysis to cope with complex clinical data
exploration tasks and enhance the understanding of
the problem of predicting risk of readmission. Figure
2 provides an example of how the visualization of the
discretized results can reveal unexpected patterns that
were obscured in the correlation analysis. For brevity,
we present a subset of those results. The first chart
in Figure 2 shows increased RoR for patients of the
LOS of 14 days (between 13.5 and 14.5 days) com-
pared to the adjacent intervals. Figure 2 also shows
an increased RoR for patients aged 48 years (between
the age of 47.5 and 48.5). From the visualization, one
may speculate whether patients of such age range are
indeed highly susceptible to CHF readmission, or this
Divide-n-Discover-DiscretizationbasedDataExplorationFrameworkforHealthcareAnalytics
331
1
?
Divide-n-Discover
Discretization based Data Exploration Framework
Step 1
Select File Input
Step 2
Select Attributes
Step 3
Discover Cutpoints
Step 4
Predict
Browse
Select a file:
Select Attributes
Length of Stay (LOS)
Age
BMI
Blood Pressure
Ejection Fraction Value
X
Submit
Max Diastolic BP
Respiration Rate
Systolic Diastolic Diff
Pulse Rate
Discretize
Divide-n-Discover
Discretization based Data Exploration Framework
Browse
Step 1
Select File Input
Step 2
Select Attributes
Step 3
Discover Cutpoints
Step 4
Predict
Select a file:
Submit
2
Divide-n-Discover
Discretization based Data Exploration Framework
Browse
Step 1
Select File Input
Step 2
Select Attributes
Step 3
Discover Cutpoints
Step 4
Predict
Select a file:
Predict
p-ValueNumber of Interval
0
0.1
Submit
5
OR
View
Select Attributes
Length of Stay (LOS)
Age
BMI
Blood Pressure
Ejection Fraction Value
X
Discretize
Max Diastolic BP
Respiration Rate
Systolic Diastolic Diff
Pulse Rate
Quality of Prediction using Discretizaton
Before After
AUC 0.5563 0.5739
Precision 0.2418 0.2550
Recall 0.4943 0.5561
1
2
3
4
5
LOS
Odds ratio & 95% CI
Bin
Bin1
Bin2
Bin3
Bin4
Bin5
2.5 7.5 13.5 14.5
LOS
Class
LOS
?
Divide-n-Discover
Discretization based Data Exploration Framework
Browse
Step 1
Select File Input
Step 2
Select Attributes
Step 3
Discover Cutpoints
Step 4
Predict
Select a file:
Predict
p-ValueNumber of Interval
0
0.1
Submit
5
OR
View
Select Attributes
Length of Stay (LOS)
Age
BMI
Blood Pressure
Ejection Fraction Value
X
Discretize
Max Diastolic BP
Respiration Rate
Systolic Diastolic Diff
Pulse Rate
1
2
3
4
5
LOS
Odds ratio & 95% CI
Bin
Bin1
Bin2
Bin3
Bin4
Bin5
2.5 7.5 13.5 14.5
LOS
Class
LOS
3
4
?
?
?
?
3
Extract numeric
attributes from
data input
Examine the quality
of prediction using
discretization
Discover meaningful cut points
to identify unexpected patterns
Input
data
Figure 3: Divide-n-Discover framework application scenario.
observation is simply due to some mere noise in the
data.
In our experimental study, we perform additional
investigation based on this initial observation and
eliminate this inconsistent subset of patients aged 48
years. Before the elimination, there is a negative cor-
relation (−0.0029 calculated based on Pearson Cor-
relation Coefficient between Age and RoR, and the
P-value is 0.083, showing the marginal significance
of this correlation. However, after the elimination,
correlation still remains negative, but the P-value in-
creases to 0.1733. This shows, without this specific
age-group of patients, the apparent negative correla-
tion between age and RoR would not exist.
We compute and visualize odds ratio to quantify
and evaluate the risks between intervals. The odds
ratio provides enhanced evidence to confirm the pat-
terns observed from the visualizations. The reported
95% CI indicates the precision of the computed odds
ratio for each interval. The range of CI is affected by
the size of the interval. As shown in Figure 2, inter-
vals of smaller sizes would have wider range of CI.
Figure 2 also shows two examples of odds ratio
analysis. An odds ratio quantifies the visualization
results and evaluates the relative risks for a specified
interval. For example, from the first row we learn that
patients with the LOS above 13 days are 2.27 times
more likely to be readmitted than the rest. However,
as shown in the second row of the figure, the RoR for
patients with LOS at 14 days are 3.6 times higher than
other patients. The result from the third row of Fig-
ure 2 also indicates that patients aged 48 years can be
2.63 times more likely to be readmitted to the hospi-
tal within 30 days. Clearly, such observations signif-
icantly facilitates the data interpretation process, al-
lowing timely feedback necessitating data cleaning,
or further interventions or investigations. For exam-
ple, clinical researchers may gather more data and
conduct clinical research for patients aged 48 years to
verify the observed higher RoR for that age group, or
may necessitate the change in hospital policy to look
for pressures to discharge patients at two weeks who
may not be ready.
To examine the effect of discretization, we further
consider the task of the 30 day readmission prediction
problem, and design predictive models using logistic
regression, considering only numeric variables, with
and without discretization. We have tested the system
and have observed increased performance for preci-
sion (from 0.2418 to 0.2550), recall (from 0.4943 to
0.5661), and AUC (from 0.5563 to 0.5739).
HEALTHINF2014-InternationalConferenceonHealthInformatics
332

4 RELATED WORK
Discretization methods determine “cut-points” (or
split-points) for continuous features, dividing a range
of continuous values into intervals of various lengths.
In clinical data analysis, discrete features are eas-
ier to interpret for both data scientists and clinicians.
Prior research also indicates that discretization makes
learning faster and more accurate (Liu et al., 2002).
Applying discretization methods to continuous fea-
tures such as age, blood pressure, and BMI provide
insight into the profiles of patients with different vari-
ation properties, especially when used in conjunction
with interpretable predictive models such as decision
trees.‘’ Prior work (Chin et al., 2012) indicates that
the choice of cut-points could affect perceptions and
the understanding of the data. This work observe a
non-linear pattern between age and high variation of
blood sugar level (patients in their 40s show a much
greater probability compared to younger and older
patients), which is obscured in the correlation anal-
ysis where the two factors are negatively correlated.
Most prior research has applied discretization as a
data preprocessing technique to enhance the predic-
tive models. Compared to the prior research, this
work proposes discretization based visualization to
support data exploration, which in turn leads to im-
proved predictive modeling.
An increasing body of literature (Kansagara D,
2011) attempts to develop predictive models for hos-
pital readmission risk. Kansagara et al. (Kansagara D,
2011) conducts a systematic review of 26 unique
models based on data types, data collection timing,
prediction variables, etc. However, none of the exist-
ing works attempts to propose discretization for im-
proved prediction, nor do they propose data explo-
ration for prediction problem.
Compared to prior research to the problem of pre-
dicting the risk of hospital readmission, our study pro-
poses a novel visualization approach at the stage of
data exploration to provide interpretable knowledge
discovery to healthcare domain experts. In the pro-
posed framework, we illustrate how a domain expert
can be involved in the data mining process at different
stages.
5 CONCLUSIONS AND FUTURE
WORK
We propose a framework Divide-n-Discover, a princi-
pled discretization based visualization techniques for
data analysis and exploration in healthcare analytics.
We demonstrate the effectiveness of this framework
for predicting the RoR for CHF patients. Our exper-
imental study corroborates that our proposed frame-
work can potentially help filter the outliers in the data
and identify unexpected patterns in the data.
The proposed framework can be extended to a
wide range of healthcare problems. Encouraged by
the preliminary findings, we aim to expand the scope
of the applications and investigate a wider range of
numeric attributes in the future. In addition, imple-
menting the proposed interactive user interface will
allow us to perform usability tests with healthcare
professionals. User studies may reveal the strengths
and weaknesses of the approach and help improve the
data exploration approach. Future work also exam-
ines the evaluation of the proposed method on larger
datasets, identifying and solving the potential scala-
bility issues in data exploration.
REFERENCES
Chin, S.-C., Street, W. N., and Teredesai, A. (2012). Dis-
covering meaningful cut-points to predict high HbA1c
variation. In Proc. 7th INFORMS Workshop on Data
Mining and Health Informatics.
Kansagara D, E. H. (2011). Risk prediction models for
hospital readmission: A systematic review. JAMA,
306(15):1688–1698.
Kerber, R. (1992). ChiMerge: discretization of numeric at-
tributes. In Proceedings of the tenth national confer-
ence on Artificial intelligence, AAAI’92, pages 123–
128. AAAI Press.
Krumholz, H. M., Normand, S. L. T., Keenan, P. S., Lin,
Z. Q., Drye, E. E., Bhat, K. R., Wang, Y. F., Ross,
J. S., Schuur, J. D., and Stauffer, B. D. (2008). Hospi-
tal 30-day heart failure readmission measure method-
ology. Report prepared for the Centers for Medicare
& Medicaid Services.
Liu, H., Hussain, F., Tan, C. L., and Dash, M. (2002). Dis-
cretization: An enabling technique. Data Mining and
Knowledge Discovery, 6(4):393–423.
Szumilas, M. (2010). Explaining odds ratios. Journal of the
Canadian Academy of Child and Adolescent Psychia-
try, 19(3):227–229.
Zolfaghar, K., Agarwal, J., Sistla, D., Chin, S.-C., Roy,
S. B., and Verbiest, N. (2013a). Risk-o-meter: an in-
telligent clinical risk calculator. In KDD, pages 1518–
1521.
Zolfaghar, K., Meadem, N., Sistla, D., Chin, S.-C., Roy,
S. B., Verbiest, N., and Teredesai, A. (2013b). Explor-
ing preprocessing techniques for prediction of risk of
readmission for congestive heart failure patients. In
Data Mining and Healthcare Workshop.
Zolfaghar, K., Meadem, N., Teredesai, A., Roy, S. B., Chin,
S.-C., and Muckian, B. (2013c). Big data solutions
for predicting risk-of-readmission for congestive heart
failure patients. In IEEE Bigdata.
Divide-n-Discover-DiscretizationbasedDataExplorationFrameworkforHealthcareAnalytics
333
