
Modeling of Neuronal Population Activation under Electroconvulsive
Therapy
Fadi N. Karameh
1
, Mohamad Awada
1
, Firas Mourad
1
, Karim Zahed
1
, Ibrahim Abou-Faycal
1
and Ziad Nahas
2
1
Department of Electrical and Computer Engineering, American University of Beirut, 1107-2020, Beirut, Lebanon
2
Department of Psychiatry, American University of Beirut Medical Center, 1107-2020, Beirut, Lebanon
Keywords:
Neuronal Modeling, EEG, Electroconvulsive Therapy, Kalman Filtering, Estimation.
Abstract:
Electroconvulsive therapy (ECT) is a procedure that involves the induction of seizures in the brain of patients
with severe psychiatric disorders. The efficacy and therapeutic outcome of electrically-induced seizures is
dependent upon both the stimulus intensity and the electrode placement over the scalp, with potentially signif-
icant memory loss as side effect. Over the years, ECT modeling aimed to understand current propagation in the
head medium with increasingly realistic geometry and conductivity descriptions. The utility of these models
remain limited since seizure propagation in the active neural tissue has largely been ignored. Accordingly, a
modeling framework that combines head conductivity models with active neural models to describe observed
EEG signals under ECT is highly desirable. We present herein a simplified multi-area active neural model
that describes (i) the transition from normal to seizure states under external stimuli with particular emphasis
on disinhibition and (ii) the initiation and propagation of seizures between multiple connected brain areas. A
simulation scenario is shown to qualitatively resemble clinical EEG recordings of ECT. Fitting model param-
eters is then performed using modern nonlinear state estimation approaches (cubature Kalman filters). Future
work will integrate active models with passive volume conduction approaches to explore seizure induction and
propagation.
1 INTRODUCTION
Electroconvulsive therapy (ECT) remains the most ef-
fective, and often lifesaving, acute treatment for se-
vere psychiatric disorders. Each year, over 2 million
treatments are administered world wide, but not with-
out significant risks of memory loss.
Current ECT is commonly administered using two
stimulating electrodes placed over the scalp of the
patient under anesthesia. The location of the elec-
trodes, the stimulus intensity and the stimulus dura-
tion are three main parameters that have been clini-
cally linked to the focality and strength of the induced
seizures. Here, the therapeutic benefit of an ECT ses-
sion is related to the induction of prominent yet brief
(∼20 sec) seizures in the frontal areas of the brain fol-
lowed by a period of marked inhibition, as observed
in EEG recordings. Since electric current is injected
at the scalp, there is little control over the nature and
spatial extent of an induced seizure which is often
global and can reach deeper structures in the brain
related to memory formation and retention thus can
adversely affect their normal operation. Accordingly,
main recent thrust in ECT research has been focused
on developing methods of delivery that can both re-
tain seizure focality (and hence efficacy) and reduce
its side effects. To this end, several ECT protocols
have been introduced (Sackeim et al., 2008; Merkl
et al., 2009). These differ mainly in the electrode lo-
cation (bilateral, right/left unilateral, bifrontal), elec-
trode shape and size (rectangular pads, circular), as
well as electric stimulus shape (sinusoidal, unidirec-
tional and bidirectional square waves) and duration
(brief, ultra-brief).
At the earliest stages of protocol design, it is
necessary to understand the excitatory implications
(seizure strength and extent) of a given electrode-
current configuration. Specifically, the affected brain
areas can be implicated through (i) primary excita-
tion, as determined by the electric field strength gen-
erated by the electrodes and the passive electric cur-
rents in the brain conductive medium, and (ii) sec-
ondary excitation, as determined by the active propa-
gation of neuronal activity from one brain area to an-
229
N. Karameh F., Awada M., Mourad F., Zahed K., Abou-Faycal I. and Nahas Z..
Modeling of Neuronal Population Activation under Electroconvulsive Therapy.
DOI: 10.5220/0004804002290238
In Proceedings of the International Conference on Bio-inspired Systems and Signal Processing (BIOSIGNALS-2014), pages 229-238
ISBN: 978-989-758-011-6
Copyright
c
2014 SCITEPRESS (Science and Technology Publications, Lda.)

other within the brain via inter-areal connections or
pathways.
In this regard, simulation models can significantly
enhance our understanding of a given electrode con-
figuration and guide experimental testing. A princi-
ple challenge here is the introduction of stimulation
protocols that preserve therapeutic efficacy of ECT
seizures while reducing cognitive side effects. Sev-
eral simulation models have been introduced to simu-
late the electric fields generated in head models with
increasing realism starting from concentric spheres
of homogenous conductivities to realistic detailed
anatomical geometrical descriptions (such as those of
the skull-sutures, plates etc.- and the brain surface-
cortical sulci, corpus callosum etc. ), with heteroge-
nous conductivities (examples in (Deng et al., 2011;
Lee et al., 2012),(Bai et al., 2012)). These models
solve governing electrostatic equations over increas-
ingly accurate domains, and produce electric field in-
tensity profiles which are subsequently related to a
given experimentally determined threshold of seizure
initiation. Accordingly, such models primarily ad-
dress primary excitation (point (i)) albeit with little or
no attention given to secondary excitation, and hence
are well suited to describe an initial operating point
for seizure but not the dynamic spatiotemporal prop-
agation of seizures, since the latter is dominated by
the activity buildup and transport between brain areas
(excessively synchronized firing in large scale neural
populations).
Our approach advocates modeling ECT induced
seizures initiation and propagation effected by both
primary (passive) and secondary (active) excitation of
brain tissue under scalp electrical stimulation. In this
framework, the head-brain model is composed of two
main simulation blocks as shown in figure 1. First,
volume conduction is modeled to estimate the pri-
mary excitation arriving at the cortical surface due
to input current stimulus at the scalp. Second, pri-
mary excitation arrives to underlying cortical struc-
tures whereby activating multi-area neural population
models. The activity of these populations is then
communicated between different areas thus produc-
ing secondary excitation. Finally, the model output is
observed via EEG recordings at the scalp.
In this manuscript, we will focus on developing
population models that could explain the induction
of seizures within a local population due to exoge-
nous currents such as that arriving from scalp stimuli
(and hence is related to primary excitation), as well
as propagating seizures across interconnected popu-
lations (hence is related to secondary excitation). The
models will place a particular emphasis on the role of
fast inhibition preceding seizure onset as a potential
Area A
Scalp stimulation
Volume conduction model
!
0. "
#
#
V
$
!
iijjii
i
uCxxf
dt
tdx
,,,
)(
"
!
jjiijj
j
uCxxf
dt
tdx
,,,
)(
"
Area B
Neural population
model
Scalp EEG
Primary
excitation
Secondary
excitation
i
u
j
u
Figure 1: ECT modeling framework.
mechanism to reduce slow cortical inhibition and thus
promote seizure induction. Subsequently, the parame-
ters of the developed neural models will be estimated
to qualitatively resemble clinical EEG recordings of
ECT-induced seizures. Since the introduced models
are nonlinear, state-of-the-art nonlinear Kalman filter
estimation techniques are utilized to estimate both the
neural activity of the underlying populations and the
connectivity strength between corresponding brain ar-
eas thought to be implicated in seizure propagation.
2 NEURAL MODELS
The seizure generation models to be employed are
intended to represent the genesis of ECT induced
epileptic behavior both at the level of single area as
well as at the level of multiple interacting areas. In
this section we will initially present earlier models for
spontaneous seizure initiation and subsequently intro-
duce modifications to these models that allow exoge-
nous seizure initiation in single (local) and multiple
cortical areas.
2.1 Wendling Model
The single area neural population model is based
on the work by Wendling et al (Wendling et al.,
2002). This is a firing rate model with the basic
neural firing element representing the main pyramidal
cells that are reciprocally connected to local popula-
tions. The Wendling model, which is based on Jansen
model(Jansen and Rit, 1995), is able to generate EEG
like activity whose character depends on the set of
connection parameters utilized.
In its simplest embodiments, the firing rate model
of a single neural population is summarized by synap-
tic elements H
e
, H
i
representing excitatory and in-
hibitory connection of the population, and a sigmoidal
current to rate transformation representing the neu-
BIOSIGNALS2014-InternationalConferenceonBio-inspiredSystemsandSignalProcessing
230

)(th
e
)(th
i
!
.S
"
#
x
r
e
r
i
r
e
x
i
x
Excitatory
synapse
Inhibitory
synapse
Postsynaptic
current
Output rate
0 0.05 0.1 0.15
−1
0
1
time (sec)
fast, excit
slow, inhib
fast, inhib
Figure 2: Neural population models. Top: Schematic of
connectivity. Bottom: synaptic connections for fast excita-
tory, fast and slow inhibitory.
ral output (figure 2,top). A synapse H is thought of
as a second order linear system whose impulse re-
sponse follows a double-exponential (or alpha) func-
tion h(t) = Aate
−at
. Accordingly, for a given input
rate r
i
(t) arriving at this synapse, the synapse post-
synaptic output current x(t) can be computed using a
two-state linear system
˙x(t) = z(t) (1)
˙z(t) = Aar
i
(t) − 2az(t) − a
2
x(t) (2)
where z is an intermediate variable, a is the time con-
stant for that synapse and A is an amplitude con-
stant (values for these synaptic parameters used as in
(Wendling et al., 2002)-see synaptic responses in fig-
ure 2, bottom). The population output is the firing
rate which is produced after scaling and passing all
synaptic currents through a static sigmoidal nonlin-
earity r(t) = S{cx(t)}, S{x} =
2e
1+e
k(x
o
−x)
.
ep
c
pe
c
pf
c
ps
c
sf
d
sp
d
fp
d
Slow interneuron
(inhibitory)
Fast
interneuron
(inhibitory)
Fast interneuron
(excitatory)
Pyramidal
(excitatory)
slow GABA
A
fast GABA
A
fast AMPA
)(tu
o
fs
d
Figure 3: Local area model. Filled arrows represent fast
excitatory connections (h
e
(t), time constant ∼100 msec in
figure 2); filled circles represent fast inhibitory connections
(h
i
(t), time constant∼20 msec), and hollow circles repre-
sent slow inhibitory connections (h
i
(t),time constant ∼200
msec).
In extending the above basic neural population
model to represent a the dynamics of a local corti-
cal area, Wendling et al modeled the connectivity of
pyramidal cells to three distinct interneuron popula-
tions that are thought to be widely present in corti-
cal structures. As shown in the schematic of figure 3,
the pyramidal cell population (triangles) are recipro-
cally connected to (i) a population of local excitatory
interneurons that provide excitatory feedback to the
pyramidal cells (ii) a population of fast inhibitory in-
terneurons that provide fast GABA-A somatic inhibi-
tion, and (iii) a population of slow inhibitory interneu-
rons that provide slow GABA-A dendritic inhibition.
The corresponding extension of the neural population
model (equation 1) results in the following set of non-
linear state-space equations:
˙x
p
(t) = z
1
(t) (3)
˙z
1
(t) = AaS{x
e
(t) − x
is
− x
i f
(t)} − 2az
p
(t) − a
2
x
p
(t)
˙x
e
(t) = z
2
(t) (4)
˙z
2
(t) = Aa
[
u
0
(t) + c
ep
S{c
pe
x
p
(t)}
]
− 2az
2
(t) − a
2
x
e
˙x
is
(t) = z
3
(t) (5)
˙z
3
(t) = Bbd
sp
S{c
ps
x
p
(t)} − 2bz
3
(t) − b
2
x
is
˙x
i f
(t) = z
4
(t) (6)
˙z
4
(t) = Ggd
f p
S{c
p f
x
p
(t) − d
s f
x
ii
(t)}) − 2 gz
4
(t) − g
2
x
i f
˙x
ii
(t) = z
5
(t) (7)
˙z
5
(t) = BbS{c
ps
x
p
(t)} − 2bz
5
(t) − b
2
x
ii
(t)
e(t) = K
iv
(
x
e
(t) − x
is
− x
i f
(t)
)
(8)
where x
p
(t) is the synaptic current output from pyra-
midal cell population to all local cells; x
e
, x
is
, and
x
i f
are the excitatory input, slow (GABA
A
type) in-
hibitory input and fast (GABA
A
type) inhibitory in-
put, respectively, to the pyramidal cells (refer to fig-
ure 3) ; x
ii
is slow inhibitory input onto fast inhibitory
cell. The constants (A,a), (B, b) and (G, g) dictate
the time profiles of fast excitatory, slow inhibitory
and fast inhibitory cells respectively (see figure 2, bot-
tom). u
0
(t) is an external input assumed to arrive as a
firing rate to the local pyramidal population. Finally
the output of the model is the voltage trace e(t) which
is proportional to the over all postsynaptic current in
the pyramidal cell population and is assumed to be
representative of the EEG traces of the overall local
area.
The Wendling model has a set of tunable param-
eters. The constants d
m,n
and c
m,n
denote the in-
hibitory and excitatory connection strengths, respec-
tively, originating from population m to population n
and (m,n) ∈ {p:pyramidal, e:excitatory interneuron,
f: fast interneuron, s: slow interneuron}. For a given
set of fixed parameters, solutions to the above nonlin-
ear system produce oscillatory behavior that change
ModelingofNeuronalPopulationActivationunderElectroconvulsiveTherapy
231

little in character regardless of the input. In other
words, the oscillations can approximate normal back-
ground EEG, sporadic spikes, slow rhythmic activ-
ity, and sustained discharge of seizure like spikes.
In particular, a change in the balance of slow-to-fast
inhibition was shown to move the output from nor-
mal to sporadic spikes and into sustained slow quasi-
sinusoidal epileptic activity.
2.2 Induced-seizure Model
The model introduced above exhibit fixed oscillatory
behavior that depends on the connection parameters,
but not the excitatory drive. That is, the dynamics of
the nonlinear system demonstrate single stable solu-
tions that depend on the parameter set. As such, it is
well suited to model spontaneous seizures caused by
functional imbalance in the local population, but not
those seizures which are dictated by overwhelming
excitatory drive such as those occurring under ECT.
2.2.1 Local Model
We here introduce a simple modification of the local
area model that is (i) physiological in nature, and (ii)
allows the switch into seizure activity under exces-
sive inputs. Specifically, we propose that dendritic
targeting slow inhibitory (GABA-A) interneurons are
inhibited for short periods of time upon the arrival
of high afferent activity such as that occurring under
ECT stimulation. Further, this inhibition is mediated
by the fast inhibitory population that primarily targets
the somatic regions of pyramidal cells. The overall
effect is therefore a transient increase in somatic but a
decrease in dendritic inhibition in the target pyramidal
cells. This allows excessive excitation buildup in the
dendrites and a period of runaway activity to occur
in the pyramidal cells before being limited by now-
delayed slow inhibitory action. This is motivated by
the following :
a) A number of experimental and computational
models suggested that impaired dendritic inhibi-
tion may play in important role in spontaneously
occurring seizures. Using data from five pa-
tients to fit Wendling models, it was noted that
seizure onsets were consistently characterized by
a sudden drop in the dendritic slow inhibition
(Wendling et al., 2005). Furthermore, in the pe-
riod leading to seizure onset (preonset), fast in-
hibitory activity exhibited a significant increase,
which is in line with more evidence suggest-
ing fast activity as instrumental in local ictoge-
nesis (De Curtis and Gnatkovsky, 2009). Slice
experiments also point to drastic increases in
FS interneuron firing onto pyramidal cells prior
to an ictal event at which point these interneu-
rons underwent depolarization block (Cammarota
et al., 2013) and a collapse in the inhibitory veto
gave way to excitatory runaway (Trevelyan and
Schevon, 2013).
b) Recent studies of dendritic targeting interneurons
have shown reciprocal connectivity with networks
of fast spiking interneurons in the middle corti-
cal layers (Beierlein et al., 2003) or upper cor-
tical layers (Cruishank et al., 2012; Markram
et al., 2004). Such networks have distinct func-
tional role and laminar excitation (Katzel et al.,
2011), preferential inhibitory targets among in-
hibitory neuron subtypes (Pfeffer et al., 2013),
with somatic targeting fast spiking interneurons
firing mediating rapid inhibition of local pyrami-
dal cells (Avermann et al., 2012). Population of
slow GABA-A inhibitory cells can be targeted
by fast spiking cells (Staiger et al., 1997; Tam
´
as
et al., 2004), as reviewed in (Palmer et al., 2012).
Accordingly, the local area model is modified
to include a fast inhibitory to slow inhibitory neu-
ron connection (figure 3, green line) with the corre-
sponding change in the dynamics of slow interneu-
rons (equation 5)
˙x
is
(t)=z
3
(t) (9)
˙z
3
(t)=Bbd
sp
S{c
ps
x
p
(t) − d
f s
x
i f
} − 2bz
3
(t) − b
2
x
is
2.2.2 Multi-area Model
We here present the network model which accounts
for multiple interacting neural populations. The aim
is to allow one area to (i) initiate a seizure based solely
on external inputs (primary excitatory input, or u(t) in
figure 4), and (ii) initiate a feedback excitatory con-
nection with other activated areas which, when driven
with inputs that are below seizure threshold, can still
lead to an overall network-driven seizure activity. In
)(
0
tu
)(
1
tu
pp
k
1
fp
k
1
1
pf
k
1
pp
k
Area 1
Area 0
Figure 4: Multi-area model.
BIOSIGNALS2014-InternationalConferenceonBio-inspiredSystemsandSignalProcessing
232
the multiarea model, pyramidal populations are as-
sumed to be reciprocally connected (simulating cor-
ticortical long range excitatory connections). Further-
more, and as argued in point (b) above, the local fast
inhibitory interneuron is proposed to provide feedfor-
ward inhibition of pyramidal cell population, thereby
”sampling” the afferent long range input arriving onto
the pyramidal cell population from other populations.
Accordingly, equations 6 and 4 are updated as follows
˙z
2
(t) = Aa[u
0
(t) + c
ep
S{c
pe
x
p
(t) + k
p
1
p
x
p1
(t)}]
−2az
2
(t) − a
2
x
e
(10)
˙z
4
(t) = Ggd
f p
S{c
p f
x
p
(t) + k
p
1
f
x
p1
(t) − d
s f
x
ii
(t)})
−2gz
4
(t) − g
2
x
i f
(11)
where x
p1
(t) is the synaptic current associated with
pyramidal cells in area 1, and k
p
1
f
is a long range
excitatory input to local fast inhibitory cell.
2.3 Simulated Seizure Induction
The oscillatory characteristic of the introduced multi-
area model is studied with respect to the role of local
fast-to-slow inhibition d
f s
, the long range connections
from area 1 to area 0 ( denoted as k
p
1
p
, k
p
1
f
), as well
as from area 0 to area 1 (denoted as k
pp
1
, k
p f
1
). Fi-
nally, the effect of the strength of external stimuli ar-
riving at both areas u
0
(t),u
1
(t) on seizure initiation is
presented. In all the simulations below, various pa-
rameters other than those presented were fixed at val-
ues which allow normal background activity under no
external input (see (Wendling et al., 2002)).
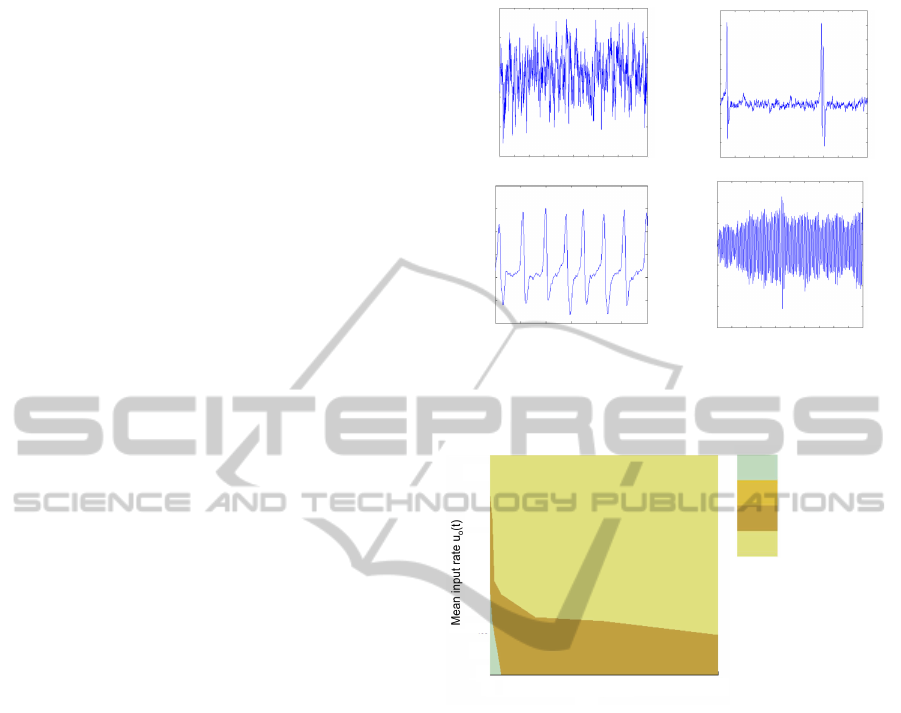
The EEG output of the model can vary between
four basic states, background normal EEG, normal
EEG interrupted by sporadic spikes, sustained slow
oscillations, and seizures, as shown in figure 5. In
what follows we will study the effect of various pa-
rameters, particularly those that were modified, on the
initiation of seizures under external stimulation.
Role of Local Fast-to-Slow Inhibition d
f s
. The
critical effect of this local inhibitory connection be-
tween fast and slow interneurons is demonstrated in
figure 6. Here, it is seen that for nonzero values of d
f s
,
the input threshold for inducing sustained oscillations
and seizure activity drops significantly. For d
f s
< 5,
a normal EEG rhythm can be obtained at low values
of external input u
0
(t) < 50Hz which will be trans-
formed to sustained oscillations for u
0
< 200Hz and
then seizure for larger u
0
. At larger values of d
f s
> 10,
the network will produce sustained oscillations at low
input strengths. Hence, normal multi-modal opera-
tion of this system implicates a range of 0 < d
f s
< 5.
12
8
4
0
-4
5
-5
0
0 1
2
15
0
4
8
0
2 4 6 8
1.5
1
0.5
0
0 2 4 6 8
time
(
sec
)
a
b
c
d
0
2
6 84
Figure 5: Various EEG patterns produced by the multi-area
model. a) Background activity. b) Sporadic spikes. c) Sus-
tained slow oscillations. d) Seizures.
450
350
250
150
50
10 30 50 70 900
0
d
fs
Background Activity
Sporadic Spikes
Sustained Activity
Seizure
Figure 6: Effect of local fast-to-slow inhibitory connection.
Range of input strength is selected to compare the network
threshold for seizure induction under assumed connection
strengths.
Mechanism of Seizure Induction. To understand
why the fast-to-slow inhibition reduced seizure
threshold with external input, we note that slow in-
hibition, which targets the dendritic region of pyrami-
dal cells, has the important role of reducing excita-
tion arriving in the dendritic tree of these cells. Un-
der normal operation, slow inhibition peaks slightly
after afferent excitation to pyramidal cells(time con-
stants in the range of 200 and 100 msec, respec-
tively), and sustains a balanced state of operation. The
suprathreshold activation of fast inhibitory cells by
external inputs will quickly activate the fast-to-slow
inhibition(time constant ∼20 msec), thus delaying the
dendritic inhibition and providing a time window of
runaway excitation in pyramidal cells. The cycle will
repeat after the now-delayed dendritic inhibition is re-
duced to baseline levels.
ModelingofNeuronalPopulationActivationunderElectroconvulsiveTherapy
233

Role of Long Range Connections. We will now
test the ability of long-range connections to induce
and propagate seizures between two reciprocally con-
nected areas. Throughout, the strength of local fast-
to-slow inhibition is set to d
f s
= 2. Considering the
situation where area 0 has normal driving input (that
which creates a normal background EEG, u
0
= 90
Hz), we will increase (i) excitation to connected area
1, (ii) long range inhibitory connection strength k
p f
and study the state of area 0 as the excitatory connec-
tions k
p
1
p
and k
pp
1
are varied. This is shown in figure
7.
In the case of low external input to area 1 (u
1
= 90
Hz), normal operation is observed for excitatory con-
nection strength k
p
1
p
< 50, k
pp
1
< 50 (region bounded
by 0 < k
p
1
p
+ k
pp
1
< 50). This is true regardless of
whether long range inhibition is absent (Figure 7, a;
k
p
1
f
= 0) or present (Figure 7, c; k
p
1
f
= 100,k
p f
1
=
25).
In the case of higher external input to area 1 (u
1
=
180 Hz) as would be expected with ECT stimuli, and
in the absence of long range inhibition k
p
1
f
= k
p f
1
=
0, normal operation persist in area 0 as long as area
1 to area 0 pyramidal connectivity is small k
p
1
p
< 5
(figure 7, b). It is only when moderate Pyramidal-
Pyramidal connectivity k
p
1
p
< 30 occurs that slow os-
cillations in area 0 can be observed. Nevertheless,
area 0 seizures are not observed in this case
The situation changes considerably when long-
range inhibition is included (figure 7, d, k
p
1
f
= 100,
k
p f
1
= 25). In this case, slow oscillations occur
even for negligible Pyramidal-Pyramidal connections.
Moreover, for seizures to be induced, it is sufficient
that modest increases occur in either feedforward or
feedback connection (k
p1p
> 50 or k
pp
1
> 50 ).
To summarize, the presence of long-range pyra-
midal to inhibitory connection is seen not to in-
duce seizure activity under normal nonreciprocal
Pyramidal-Pyramidal connections (only when both
reciprocal, feedforward and feedback, connections
are large that seizures occur; figure 7,c). Furthermore,
such connection promotes the generation of seizures
under modest increases in stimulation of one area
when the two areas are connected in either feedfor-
ward or feedback fashion.
3 CUBATURE KALMAN FILTER
In this section we employ recursive estimation tech-
niques to estimate the parameters of the model in-
troduced in Section 2. Given a set of measurements,
we utilize a Kalman-filtering based technique to esti-
mate the parameters in an efficient and recursive way.
K
p1p
K
pp1
50
100 150 200
50
100
250
350
0
0
K
p1p
K
pp1
350
250
100
50
0
50 100 150 200
0
a b
0
0
K
p1p
K
pp1
0
10
30
50
70
90
110
20 40 60 800
K
p1p
c
d
Figure 7: Effect of long-range inhibitory activation. Shown
is the state of area 0 (u
0
= 90 Hz). a) :u
1
= 90, k
p
1
f
=
k
p f
1
= 0, b): u
1
= 180, k
p
1
f
= k
p f
1
= 0. c):u
0
= 90, u
1
= 90,
k
p
1
f
= 100, k
p f
1
= 25 d): u
1
= 180, k
p
1
f
= 100, k
p f
1
= 25.
This is the cubature Kalman filter that is able to effi-
ciently estimate hidden nonlinear dynamics with the
assumption of Gaussian driving noise (Arasaratnam
and Haykin, 2009). Additionally, the technique will
allow us to estimate the evolution of the states with
time. Using a Kalman filter of an appropriate type
has been used in contexts similar to ours, particularly
in estimating fMRI connectivity in (Havlicek et al.,
2011).
3.1 Discrete-time Model
Since the measurements at hand are taken (and
stored) at regular intervals, they inherently form a
discrete-time process. The first step is to sample the
continuous-time model we developed yielding gov-
erning equations that take the general form:
• The “process equation” (Wendling model):
x[k] = f (x[k −1],u
0
[k − 1])
where x[k] is the state vector, the elements of
which are the k-sampled values of the various
state variables (x
p
(·),x
e
(·),···), u
0
[k] is the k-
sampled value of in the input u
0
(·) and f (·, ·) is
a non-linear function.
• The “measurement equation” (the difference be-
tween the states):
e[k] = h (x[k]) + ω[k],
BIOSIGNALS2014-InternationalConferenceonBio-inspiredSystemsandSignalProcessing
234

Table 1: CKF Pseudocode.
Initialization:
Set an initial estimate for mean of covariance matrix
Set the initial cubature points
Prediction:
Evaluate the time-prediction cubature points
Propagate these points through the function f (·,·)
Estimate the state as a weighted mean
Estimate the covariance matrix
Update:
Evaluate the update cubature points
Propagate these points through the function h(·)
Update the state estimate as a weighted mean
Update the covariance matrix
where e[k] is the kth sample value of the measure-
ment signal e(·), ω[·] is the measurement noise
process and h(·) is a linear operator.
Next, we augment the state vector to include the
parameters to be estimated and adjust the process and
measurement equations accordingly. Since the result-
ing formulation is non-linear, a square-root cubature
Kalman filter was preferred as it offered noticeable
numerical stability over the standard cubature Kalman
filter. Table 1 presents a pseudocode for the filtering
steps.
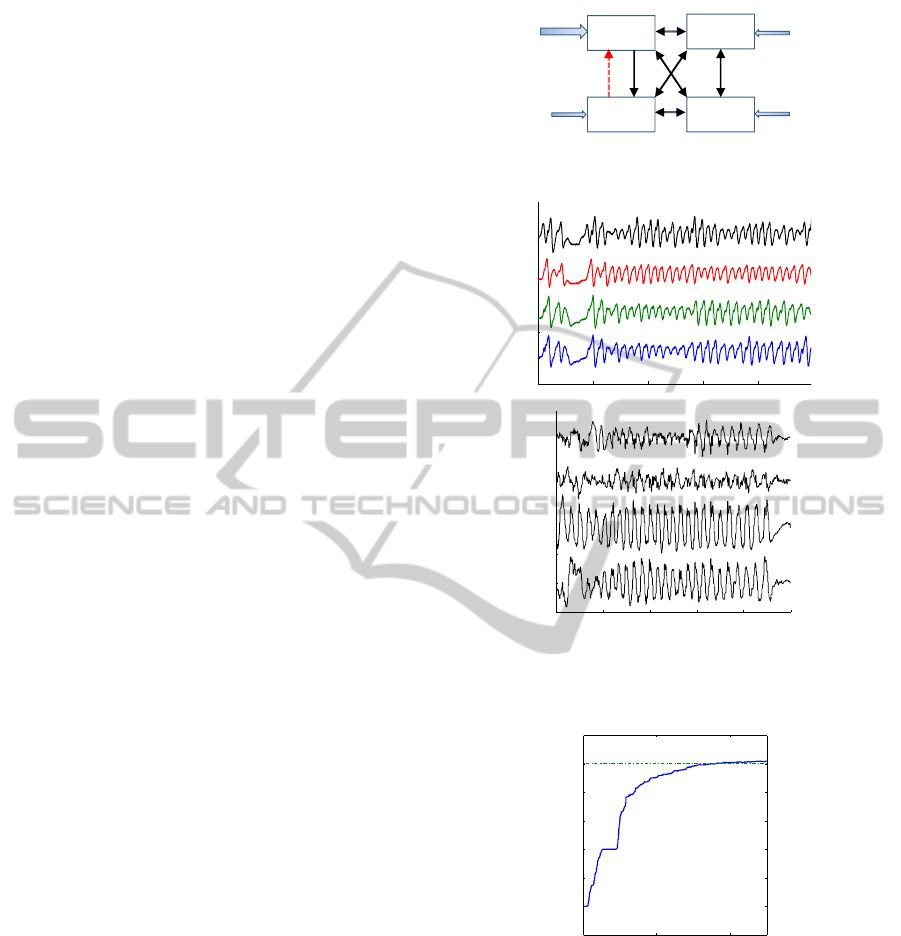
3.1.1 Multiarea Network Example
Here we present the results of estimating a surro-
gate EEG data created by simulating a 4-area net-
work model (figure 8). For simplicity, all the areas in
the network are assumed to be reciprocally connected.
Further, we assume that all the connection parameters
of the network are known except for the long-range
connections emanating from area 2 (both excitatory
and inhibitory). For this example, the connection pa-
rameters are as follows k
p
1
p
2
= k
p
1
p
3
= k
p
1
p
4
= 30,
k
p
3
p
1
= k
p
3
p
2
= k
p
3
p
4
= 20, k
p
4
p
1
= k
p
4
p
2
= k
p
4
p
3
=
20. The corresponding inhibitory connections are half
of those listed (e.g. k
p
1
f
2
= k
p
1
p
2
/2 = 15). Finally,
individual areas local connectivity was set to be the
same for all areas with d
f s
= 1. For the stimulus,
we assumed that the major ECT-like stimulus arrives
onto area 1 while significantly smaller stimuli arrive
to the remaining three areas. The activity in area
1 subsequently recruits the other areas via the long-
range reciprocal connections. Numerically, we as-
sume u
i
(t) = u
i
∗ p(t) + n(t) where p(t) is a repeat-
ing pulses of width=0.5 sec at intervals of 1 sec, n(t)
is a random white noise component with zero mean
and variance 10 Hz (keeping u
i
(t) ≥ 0∀t); finally u
i
is
a magnitude for area i, with corresponding strengths
u
1
= 150 Hz, u
2
= u
3
= u
4
= 60 Hz.
The resultant simulated EEG traces over the four
areas are shown in (figure 9, top). It is seen here
that area 1 precedes the other areas into slow spike-
and-wave form of seizure much like that seen in ac-
tual data (figure 9, bottom). Note that the real EEG
data is added here for qualitative comparison pur-
poses only and was not used to estimate connectivity
for that experiment (work in progress). To verify the
performance of the estimator, we can estimate based
on the simulated EEG traces the (assumed unknown
but constant) connectivity of area 2 to the other areas
k
p
2
p
i
= k
p
2
p
1
, i = {1,3,4}. Based on the applied cu-
bature filter, the estimated EEG is very similar to the
simulated one (not shown). In this example, only area
2 connectivity k
p
2
p
1
was unknown while other con-
nectivity strengths were assumed fixed. It is seen that,
starting from an initial significantly different strength
(k
p
2
p
1
= 10), that the estimate over time becomes
very close to the values actually used in the simula-
tion (k
p
2
p
1
= 60, figure 10; note that the inhibitory
connection k
p2 f
i
was also unknown but fixed at half
k
p
2
p
i
,i = {1,3,4} ). The choice of initial value, in this
instance, did not affect the performance of the esti-
mator, particularly that the model output is sensitive
to this parameter and the cubature filter is reported
to be more robust than other nonlinear estimators(see
below).
Performance Constraints in Kalman Filtering.
The cubature Kalman filter is a powerful tool for non-
linear dynamic system state and parameter estimation
under Gaussianity assumptions. A thorough evalua-
tion of its improved stability and convergence prop-
erties when compared to earlier nonlinear estimators
(unscented Kalman) have been reported in the litera-
ture (Arasaratnam and Haykin, 2009). The CKF per-
formance has also been compared with another re-
cently introduced Bayesian approaches (dynamic ex-
pectation maximization DEM) on benchmark exam-
ples (Havlicek et al., 2011) and was found to be pro-
duce improved performance particularly in terms of
less sensitivity to initial conditions and noise covari-
ance.
Kalman filtering techniques have been used in
several neural modeling applications. Unscented
Kalman filters were used in assimilating data related
to nonlinear dynamics of sleep rhythms in the brain
(Sedigh-Sarvestani et al., 2012), and of spontaneous
seizures(Ullah and Schiff, 2010). Cubature Kalman
filters were used to estimate neural dynamics from
functional imaging data (Havlicek et al., 2011).
In the current simulation/estimation approach for
ECT induced seizures, the CKF was used to estimate
hidden state vector augmented to include both neural
ModelingofNeuronalPopulationActivationunderElectroconvulsiveTherapy
235
firing states and inter-areal connectivity parameters.
Obviously, the ability to estimate a specific parameter
using Kalman filtering is limited by the observability
of that parameter at the output as well as the sensi-
tivity of the solution to initial parameter values (for
review, see (Sedigh-Sarvestani et al., 2012)). With
this in mind, it is important to note that the neural fir-
ing models utilized herein are based on an initial set
of known local connectivity parameters that produce
normal EEG rhythms at the single area level. During
estimation, the augmented state vector included those
inter-areal connectivity parameters that were noted to
affect the switch in simulated EEG from normal to
seizure-like patterns. Accordingly, the CKF is in-
tended as a core nonlinear estimator that allow for
testing and validating in a stepwise manner various
competing models with different parameters acting to
produce a given induced seizure rhythm.
3.2 Conclusions
The current paper advocates the use of combined
modeling and estimation in understanding the gener-
ation and propagation of ECT induced seizures be-
tween cortical areas. This effort is intended to be a
first step of an ongoing larger modeling framework
that includes both the passive head conduction and
active neural propagation. Our long-term aim is to
introduce computationally efficient models of ECT
induction that are both sufficiently accurate and are
amenable to incorporation to an ECT optimization
tool whereby electrode location and stimulus nature
are varied to minimize ECT side effects while pre-
serving ECT efficacy in treating depression. To our
knowledge, this is the first effort in modeling ECT
seizure generation at the active tissue level using well-
identified cortical cells. As mentioned in the introduc-
tion, earlier work have primarily focused on the vol-
ume conduction properties of a passive head model
at increasing geometric and conductivity realism of
scalp-skull-brain media. As for seizure initiation, the
neural activeness is either mapped to a static thresh-
old function (translated stimulation current to a mem-
brane potential (Deng et al., 2011)), or recently as a
homogenous excitable neural medium with no identi-
fiable cortical cellular populations (Bai et al., 2012).
It is important here to note that the proposed
model is intended to simulate externally induced
seizures in models of normal cortical operation and
is thus significantly distinct from the plethora of mod-
els that simulate spontaneously occurring seizure phe-
nomena in pathological cortical operation. Further-
more, and while numerous animal and experimen-
tal studies have been conducted to understand the
Area 1
Area 2
Area 4
Area 3
)(
1
tu
)(
2
tu
)(
3
tu
)(
4
tu
12
pp
k
Figure 8: Simulated network.
0 1 2 3 4 5
0
20
Area 1
Area 2
Area 3
Area 4
Time (sec)
0 1 2 3 4 5
0
100
Figure 9: Top:Simulated EEG traces. Bottom: Experimen-
tal EEG recordings during an ECT session(band pass fil-
tered between 2 and 30 Hz).
0 2 4
0
10
20
30
40
50
60
70
k
p
2
p
1
Time (sec)
Figure 10: Performance of the CKF. Time evolution of
the estimated excitatory connectivity parameter k
p2p
i
in
the 4-area simulated network shown in figure 8 (dotted
line=actual value).
key players in electrogenesis of spontaneous seizures,
similar studies on externally (ECT) induced seizures
are largely missing (for potential mechanism of ECT
efficacy at the system level see (Sanchez et al., 2009))
and limited to imaging (fMRI/SPECT) rather than
electrophysiological (surface/depth EEG) (cf (Enev
et al., 2007; Takano et al., 2011) and references
therein).
BIOSIGNALS2014-InternationalConferenceonBio-inspiredSystemsandSignalProcessing
236

Our approach is similar to spontaneous EEG
modeling efforts that recently emerged and incorpo-
rated head-brain active models in an attempt to ex-
plain spontaneous EEG rhythms. Still, such mod-
els were either hand-tuned and did not incorporate
a joint modeling-estimation modules as proposed
herein, or are computationally intensive. The cur-
rent manuscript advocates simple population-level
model that (a) allow emergent ECT-induced seizures
from normal operation conditions, (b) are biologically
plausible since they derive from neurophysiological
evidence, and (c) are computationally favorable since
they employ generalized cortical population models
and have few fixed parameters (to significantly mod-
ify behavior from normal to epileptic EEG), thereby
making them amenable to estimation.
It also demonstrated the utility of a general nonlin-
ear estimation framework in estimating the connec-
tion strengths based on real ECT seizure data. This
is an integral component to simulate and understand
how seizures propagate among cortical areas under
stimulation. The development of such biologically
plausible models carries the long-term potential of de-
veloping and designing improved ECT-stimulus de-
livery configurations that will (a) retain ECT thera-
peutic efficacy and (b) reduce cognitive side-effects
of associated epilepsies. The preliminary results in-
troduced here focused on the potential role of corti-
cal inhibition particularly, inhibition of inhibition, in
promoting seizures. It is suggested that commonly re-
ported fast activity at seizure onsets can actively con-
tribute to seizure generation (before depolarization
block) by inhibiting dendritic-targeting interneurons
thus disinhibiting local pyramidal cells. Other com-
monly reported global and local players in induced
epileptogenesis are to be addressed in more elabo-
rate models. These include thalamocortical interac-
tions (Demont-Guignard et al., 2012), slow synaptic
mechanisms such as presynaptic GABA-B receptors
activation (Dugladze et al., 2013), accumulation of
Cl
−
within the intracellular pyramidal cell membrane
under excessive stimulation, and possibly astrocyte-
neuron cell interactions.
The estimation framework, an augmented state cu-
bature Kalman filter, was shown to behave reasonably
well on a set of simulated EEG traces intended to ap-
proximate induced seizures. While the augmented
state vector here included only one parameter, our
ongoing work intends to estimate multiple connec-
tivity parameters from real EEG recordings obtained
from ECT-induced seizures and subsequently verify
the connection topology with known propagation pat-
terns of seizures in experimental setup. As mentioned
earlier, the employment of cubature Kalman filtering
for parameter estimation could suffer from lack of ac-
curacy particularly for those parameters that are not
observable at the output. Since our choice of model
starts with an initial parameter set that allows pro-
duces normal EEG behavior, only between-area con-
nectivity was estimated, as output-observable param-
eters, to fit the EEG transition into induced seizures.
ACKNOWLEDGEMENTS
Project supported by the National Council for Scien-
tific Research, Lebanon (LNCSR) and by the AUB
Farouk Jabre Interfaculty Award.
REFERENCES
Arasaratnam, I. and Haykin, S. (2009). Cubature kalman
filters. Automatic Control, IEEE Transactions on,
54(6):1254–1269.
Avermann, M., Tomm, C., Mateo, C., Gerstner, W., and Pe-
terson, C. (2012). Microcircuits of excitatory and in-
hibitory neurons in layer2/3 of mouse barrel cortex.
Journal of Physiology, 107(11):175–191.
Bai, S., Loo, C., Al Abed, A., and Dokos, S. (2012). A com-
putational model of direct brain excitation induced by
electroconvulsive therapy: comparison among three
conventional electrode placements. Brain Stimulation,
5(3):408–421.
Beierlein, M., Gibson, J. R., and Connors, B. W. (2003).
Two dynamically distinct inhibitory networks in layer
4 of the neocortex. Journal of neurophysiology,
90(5):2987–3000.
Cammarota, M., Losi, G., Chiavegato, A., Zonta, M., and
Carmignoto, G. (2013). Fast spiking interneuron con-
trol of seizure propagation in a cortical slice model of
focal epilepsy.
Cruishank, S., Ahmed, O., Stevens, T., Patrick, S., Gonza-
lez, A., Elmaleh, E., and Connors, B. (2012). Thala-
mic control of layer 1 circuits in prefrontal cortex.
De Curtis, M. and Gnatkovsky, V. (2009). Reevaluating
the mechanisms of focal ictogenesis: The role of low-
voltage fast activity. Epilepsia, 50(12):2514–2525.
Demont-Guignard, S., Benquet, P., Gerber, U., Biraben, A.,
Martin, B., and Wendling, F. (2012). Distinct hyperex-
citability mechanisms underlie fast ripples and epilep-
tic spikes. Annals of Neurology, 71:342–352.
Deng, Z.-D., Lisanby, S. H., and Peterchev, A. V. (2011).
Electric field strength and focality in electroconvul-
sive therapy and magnetic seizure therapy: a finite ele-
ment simulation study. Journal of neural engineering,
8(1):016007.
Dugladze, T., Maziashvili, N., B
¨
orgers, C., Gurgenidze, S.,
H
¨
aussler, U., Winkelmann, A., Haas, C. A., Meier,
J. C., Vida, I., Kopell, N. J., et al. (2013). Gabab
autoreceptor-mediated cell type-specific reduction of
ModelingofNeuronalPopulationActivationunderElectroconvulsiveTherapy
237

inhibition in epileptic mice. Proceedings of the Na-
tional Academy of Sciences, 110(37):15073–15078.
Enev, M., McNally, K. A., Varghese, G., Zubal, I. G., Os-
troff, R. B., and Blumenfeld, H. (2007). Imaging onset
and propagation of ect-induced seizures. Epilepsia,
48(2):238–244.
Havlicek, M., Friston, K. J., Jan, J., Brazdil, M., and Cal-
houn, V. D. (2011). Dynamic modeling of neuronal re-
sponses in fmri using cubature kalman filtering. Neu-
roimage, 56(4):2109–2128.
Jansen, B. H. and Rit, V. G. (1995). Electroencephalogram
and visual evoked potential generation in a mathemat-
ical model of coupled cortical columns. Biological
cybernetics, 73(4):357–366.
Katzel, D., Zemelman, B., Buetfeing, C., Wolfel, M., and
Miesenbock, G. (2011). The columnar and laminar
organization of inhibitory connections to neocortical
excitatory cells.
Lee, W. H., Deng, Z.-D., Kim, T.-S., Laine, A. F., Lisanby,
S. H., and Peterchev, A. V. (2012). Regional elec-
tric field induced by electroconvulsive therapy in
a realistic finite element head model: Influence of
white matter anisotropic conductivity. Neuroimage,
59(3):2110–2123.
Markram, H., Rodrequez, M., Wang, Y., Gupta, A., and Wu,
C. (2004). Interneurons of the neocortical inhibitory
system.
Merkl, A., Heuser, I., and Bajbouj, M. (2009). Antidepres-
sant electroconvulsive therapy: mechanism of action,
recent advances and limitations. Experimental neurol-
ogy, 219(1):20–26.
Palmer, L., Murayama, M., and Larkum, M. (2012). In-
hibitory regulation of dendritic activity in vivo. Fron-
tiers in neural circuits, 6.
Pfeffer, C. K., Xue, M., He, M., Huang, Z. J., and Scanziani,
M. (2013). Inhibition of inhibition in visual cortex:
the logic of connections between molecularly distinct
interneurons. Nature neuroscience, 16(8):1068–1076.
Sackeim, H. A., Prudic, J., Nobler, M. S., Fitzsimons, L.,
Lisanby, S. H., Payne, N., Berman, R. M., Brake-
meier, E.-L., Perera, T., and Devanand, D. (2008). Ef-
fects of pulse width and electrode placement on the ef-
ficacy and cognitive effects of electroconvulsive ther-
apy. Brain Stimulation, 1(2):71–83.
Sanchez, R., Alcoverro, O., Pagerols, J., and Rojo, J.
(2009). Electrophysiological mechanisms of action
of electroconvulsive therapy. Actas Esp Psiquiatr,
37(6):343–351.
Sedigh-Sarvestani, M., Schiff, S. J., and Gluckman, B. J.
(2012). Reconstructing mammalian sleep dynamics
with data assimilation. PLoS computational biology,
8(11):e1002788.
Staiger, J. F., Freund, T. F., and Zilles, K. (1997).
Interneurons immunoreactive for vasoactive intesti-
nal polypeptide (vip) are extensively innervated by
parvalbumin-containing boutons in rat primary so-
matosensory cortex. European Journal of Neuro-
science, 9(11):2259–2268.
Takano, H., Motohashi, N., Uema, T., Ogawa, K., Ohnishi,
T., Nishikawa, M., and Matsuda, H. (2011). Dif-
ferences in cerebral blood flow between missed and
generalized seizures with electroconvulsive therapy:
A positron emission tomographic study. Epilepsy re-
search, 97(1):225–228.
Tam
´
as, G., Szabadics, J., L
¨
orincz, A., and Somogyi, P.
(2004). Input and frequency-specific entrainment of
postsynaptic firing by ipsps of perisomatic or den-
dritic origin. European Journal of Neuroscience,
20(10):2681–2690.
Trevelyan, A. J. and Schevon, C. A. (2013). How inhibition
influences seizure propagation. Neuropharmacology,
69:45–54.
Ullah, G. and Schiff, S. J. (2010). Assimilating seizure dy-
namics. PLoS computational biology, 6(5):e1000776.
Wendling, F., Bartolomei, F., Bellanger, J., and Chauvel, P.
(2002). Epileptic fast activity can be explained by a
model of impaired gabaergic dendritic inhibition. Eu-
ropean Journal of Neuroscience, 15(9):1499–1508.
Wendling, F., Hernandez, A., Bellanger, J.-J., Chauvel, P.,
and Bartolomei, F. (2005). Interictal to ictal transi-
tion in human temporal lobe epilepsy: insights from a
computational model of intracerebral eeg. Journal of
Clinical Neurophysiology, 22(5):343–356.
BIOSIGNALS2014-InternationalConferenceonBio-inspiredSystemsandSignalProcessing
238
