
Application of RotaSVM for HLA Class II Protein-Peptide
Interaction Prediction
Shib Sankar Bhowmick
1,2, ∗
, Indrajit Saha
1,∗
, Giovanni Mazzocco
3
, Ujjwal Maulik
1
,
Luis Rato
2
, Debotosh Bhattacharjee
1
and Dariusz Plewczynski
3
1
Department of Computer Science and Engineering, Jadavpur University, Kolkata-700032, West Bengal, India
2
Department of Informatics, University of Evora, 7004-516 Evora, Portugal
3
Interdisciplinary Centre for Mathematical and Computational Modelling, University of Warsaw, 02-106 Warsaw, Poland
Keywords:
HLA Class II, Machine Learning, MHC, Peptide Binding, T Cell Epitopes.
Abstract:
In this article, the recently developed RotaSVM is used for accurate prediction of binding peptides to Human
Leukocyte Antigens class II (HLA class II) proteins. The HLA II - peptide complexes are generated in the
antigen presenting cells (APC) and transported to the cell membrane to elicit an immune response via T-cell
activation. The understanding of HLA class II protein-peptide binding interaction facilitates the design of
peptide-based vaccine, where the high rate of polymorphisms in HLA class II molecules poses a big chal-
lenge. To determine the binding activity of 636 non-redundant peptides, a set of 27 HLA class II proteins are
considered in the present study. The prediction of HLA class II - peptide binding is carried out by an ensemble
classifier called RotaSVM. In RotaSVM, the feature selection scheme generates bootstrap samples that are
further used to create a diverse set of features using Principal Component Analysis. Thereafter, Support Vec-
tor Machines are trained with these bootstrap samples with the integration of their original feature values. The
effectiveness of the RotaSVM for HLA class II protein-peptide binding prediction is demonstrated in com-
parison with other traditional classifiers by evaluating several validity measures with the visual plot of ROC
curves. Finally, Friedman test is conducted to judge the statistical significance of RotaSVM in prediction of
peptides binding to HLA class II proteins.
1 INTRODUCTION
Major Histocompatibility Complex (MHC)
molecules play a key role in the activation of
the adaptive immune response. They bind and
expose an antigen (immunogenic peptide) to T-cell
receptors (TCR) triggering an immune response
against the infected cell or foreign agent. Human
MHC proteins, also known as Human Leukocyte
Antigens (HLA), make multiple contacts with the
side-chains of binding peptides, defining the binding
motif and determine the specificity of binding. There
are two classes of HLA molecules: class I and class
II. The binding domain of the class I molecules is
composed of a single heavy chain, constituting a
closed binding groove that accepts only peptides with
fixed length of 9 amino acids (AAs). In contrast, class
∗
These two authors are joint first author and contributed
equally.
II molecules are composed of two variable chains,
with an open binding groove that allows peptides of
different length (between 11 and 22 AAs) to bind
using different binding frames (Stern and Wiley,
1994). This variability, along with the high degree of
polymorphism in HLA class II molecules constitute
a challenge for T cell epitope discovery. Even though
many of the alleles could be functionally highly
related, the binding pockets are alike among different
alleles. Generally, it is very difficult to identify such
similarities, since subtle differences in binding pocket
amino acids (AAs) can lead to dramatic changes in
the binding specificity (Nielsen et al., 2007; Saha
et al., 2013).
During the last decade, the high level of accuracy
in prediction of T cell epitopes makes prediction
algorithms a natural and integral part of most major
large-scale epitope discovery projects (Sette and
Peters, 2007; Lauemoller et al., 2000; Moutaftsi
178
Bhowmick S., Saha I., Mazzocco G., Maulik U., Rato L., Bhattacharjee D. and Plewczynski D..
Application of RotaSVM for HLA Class II Protein-Peptide Interaction Prediction.
DOI: 10.5220/0004804801780185
In Proceedings of the International Conference on Bioinformatics Models, Methods and Algorithms (BIOINFORMATICS-2014), pages 178-185
ISBN: 978-989-758-012-3
Copyright
c
2014 SCITEPRESS (Science and Technology Publications, Lda.)

et al., 2006). The single most selective event defining
T cell epitopes is the binding of peptide fragments
to the HLA complexes (Yewdell and Bennink, 1999;
Haque and Blum, 2005). Most HLA class II binding
prediction methods have been trained and evaluated
on very limited data sets covering only a single
or a few different HLA class II alleles (Karpenko
et al., 2005; Murugan and Dai, 2005; Chang et al.,
2006; Salomon and Flower, 2006; Bui et al., 2005;
Nielsen et al., 2004; Wan et al., 2006; Brusic et al.,
1998). To the best of our knowledge, methods like
Propred (Singh and Raghava, 2001) and TEPITOPE
(Sturniolo et al., 1999), are experimentally derived
virtual matrix-based prediction methods that cover
different HLA-DR alleles. NetMHCII (Sturniolo
et al., 1999) and ARB (Bui et al., 2005) are weighted
matrix data-driven methods that use peptide/MHC
binding data of 14 HLA-DR alleles as well as some
mouse MHC class II alleles. Very limited work has
been done on deriving HLA class II-peptide binding
prediction algorithms with broad allelic coverage.
Although the development of such methods based on
binding information or physiochemical properties of
AAs, would represent a significant help in the study
of human immune system.
In this article, the above fact motivated us to
use recently developed RotaSVM (Bhowmick et al.,
2013) for accurate prediction of peptide binding
to class II HLA proteins such as DP, DQ and DR.
RotaSVM is an ensemble classifier that combines
a rotational feature selection scheme with Support
Vector Machines (SVMs), in order to produce a
predefinite number of SVMs outputs. For each SVM,
the training data are generated from the bootstrap
samples by splitting the feature set randomly into ξ
number of subsets. Subsequently, principal compo-
nent analysis (PCA) is used for each subset to create
new feature sets and all the principal components are
retained to preserve the variability information about
the training data. Thereafter, such features are used to
train a SVM. During the testing phase of RotaSVM,
the sample data are the input to the rotation specific
SVM. Subsequently, it is classified by computing
average posterior probability. The classification is
performed on the binding dataset of 27 HLA class
II proteins. The performance of the RotaSVM is
demonstrated by comparison with the individual
Support Vector Machine(SVM) (Vapnik, 1995), Ran-
dom Forest (RF) (Breiman, 2001), Naive Bayes (NB)
(George and Langley, 1995) and K-Nearest Neighbor
(K-NN) (Cover and Hart, 1967) classifiers in terms
of average accuracy, precision or Positive Predictive
value (PPV), (Ramana and Gupta, 2010), recall,
F-measure, Matthews correlation coeffcient (MCC)
(Ramana and Gupta, 2010), and area under the ROC
curve (AUC) values of the random subsample dataset.
Goodness of the RotaSVM is judged by computing
gain values along with the statistical significance test,
called Friedman test (Friedman, 1937; Friedman,
1940).
2 MATERIALS AND METHODS
2.1 Dataset
An enhanced Greenbaum dataset consisting of 27
HLA class II proteins binding 636 peptides obtained
from Phleumpratense (Greenbaum et al., 2011) is
used in this present work. The dataset consists of
IC50 HLA II-peptide binding affinity values. The
raw dataset is transformed into binary binding ma-
trices which contain 1 and 0 for binding and non-
binding events, respectively. In this regard, for the
enhanced Greenbaum dataset, a compatible criterion
is adopted, where for considering a peptide as a binder
to the HLA class II proteins the maximum IC50 val-
ues are chosen around 1000 nM by setting the thresh-
old value for HLA class II at 1000 nM. This stringent
IC50 threshold value is adopted in order to decrease
the background noise of the data (Greenbaum et al.,
2011).
Before going to predict the HLA class II binding
peptides, the homogenization of the peptide length is
a mandatory step for RotaSVM predictor and there-
fore in the chosen dataset, homogenized length of 15
AAs for all the peptides is considered. In that ho-
mogenized dataset the bordering AAs that exceed 15
AAs peptides are removed. The dissection is selected
after an accurate comparative analysis of the less con-
served residues within longer peptides (Saha et al.,
2013). Thereafter, 40 high-quality AA indices (HQI
40) (Saha et al., 2011a; Plewczynski et al., 2012) are
used to encode each peptide, where AA index repre-
sents various physicochemical and biochemical prop-
erties of AAs in terms of numerical values. Therefore,
each peptide is expressed by 15 AAs × 40 HQI = 600
features.
For this experiment, Percentage of Positive Activ-
ity (PPA) is computed from binary binding affi nity
matrix to define the total number of binding events
among peptides and each HLA-II DP, DQ and DR
protein. To prepare data for this process, initially
the highest number of positive activity is computed
among all instances and then for each instance the
positive activity is computed with respect to this high-
est PPA. This process is carried out individually for
HLA-II DP, DQ and DR proteins. Thereafter, a
ApplicationofRotaSVMforHLAClassIIProtein-PeptideInteractionPrediction
179

threshold label is set and if the PPA of any instance
is greater than this threshold value, then the activity
value is considered as 1, otherwise it is equal to 0.
Each of these activity values is working as an indica-
tor of the peptide binding event. If the activity value
is 1, then it is binding to the respective HLA, oth-
erwise not. Since the activity value to an instance
is defined with respect to the threshold value, hence
a lower threshold gives a higher number of binding
peptides. Different incremental threshold values are
applied and the statistics are given in Table 1. Since,
it is observed that the number of positive and negative
binders, play a crucial role for supervised classifiers,
hence for RotaSVM, the threshold level at 15%, 30%
and 30% are considered to have balanced numbers of
positive and negative binders for HLA-II DP, DQ and
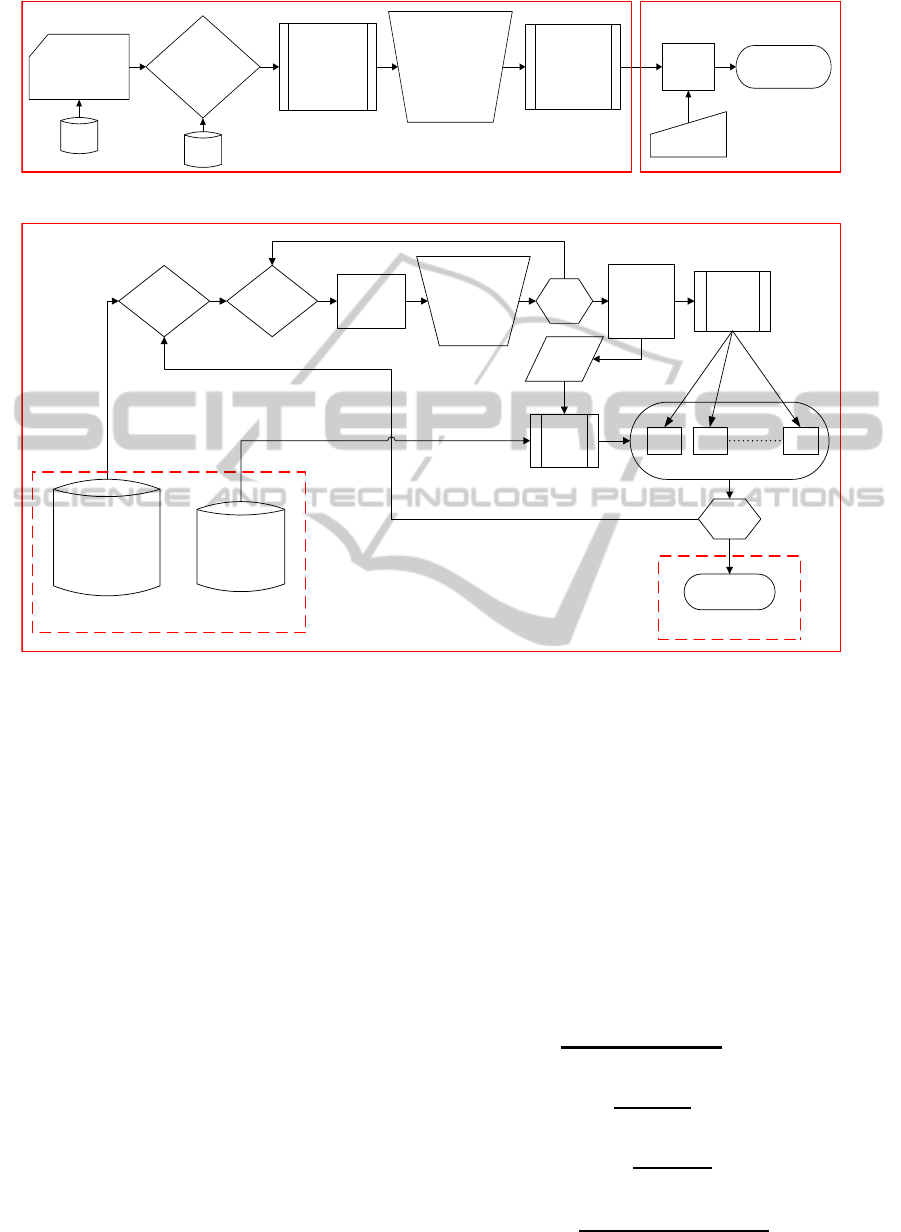
DR, respectively. The data generation and the exper-
imental procedure are shown through block diagram
in Figure 1.
Table 1: Statistics of dataset used in RotaSVM.
HLA II Threshold Number of Number of Percentage of
Levels (%) Positives Negatives Positives (%)
10 325 311 51.10
15 325 311 51.10
20 217 419 34.11
DP 25 217 419 34.11
30 217 419 34.11
40 153 483 24.05
50 108 528 16.98
10 526 110 82.70
15 526 110 82.70
20 330 306 51.88
DQ 25 330 306 51.88
30 330 306 51.88
40 158 478 24.84
50 74 562 11.63
10 518 118 81.44
15 464 172 72.95
20 413 223 64.93
DR 25 413 223 64.93
30 356 280 55.97
40 272 364 42.76
50 218 418 34.27
2.2 RotaSVM for HLA Class II
Protein-Peptide Binding Prediction
RotaSVM is a newly developed ensemble classifier,
where a set of SVMs is used as base classifier. To
construct the new feature set for each SVM, boot-
strap samples are extracted from the original training
set. Then the feature set is randomly split and lin-
early transformed to construct new subsets. In addi-
tion to this, final feature set is constructed with all the
transformed features for each SVM in the ensemble,
where the diversity of the RotaSVM is guaranteed by
this transformation. Thereafter, the average of poste-
rior probability gives the classification results. Here,
as the SVMs are used, the basic idea of SVM is to
find a hyperplane which separates the d-dimensional
data perfectly into two classes, however, since clas-
sification data are often not linearly separable, SVM
introduced the notion of a “kernel” which embeds the
data into a higher-dimensional feature space where
the data are linearly separable.
Consider a training set £ = {(x
i
, y
i
)}
N
i=1
consisting
of N independent instances, Y be the corresponding
label and ̥ be the feature set where each (x
i
, y
i
) is
described by an input attribute vector x
i
= (x
i1
, x
i2
,
. . . , x
id
) ∈R
d
and a class label y
i
. Let X be a N ×d data
matrix composed with the values of d input attribute
and ω be the set of class labels {ω
1
, ω
2
, . . . , ω
c
}, from
which Y takes values. Assume that the feature set is
split randomly into ξ subsets with approximate size
and ⊤ is the ensemble size in the RotaSVM. Here, ξ
and ⊤ should be specified in advance.
During the training of each SVM, the feature set
̥ is randomly split into ξ number of disjoint subsets.
Subsequently, a submatrix X
t,s
, where t is the times-
tamp of the SVM classifier runs and s is the subset
number, is created with the attributes in F
t,s
. From
this submatrix X
t,s
, a bootstrap subset of objects is
drawn with the size of 75% of the dataset to form a
new training set, which is denoted by X
′
t,s
. Thereafter,
PCA technique is applied to each subset to obtain a
matrix M
t,s
where all principal components are re-
tained in order to preserve the variability information
in the data. Thus, ξ axis rotations take place to form
the new attributes for each SVM classifier. Subse-
quently, the matrix M
t,s
is arranged into a block diag-
onal matrix B
t
. To construct the training set for clas-
sifier SVM
t
the columns of B
t
is rearranged according
to the original feature sequence, and assuming that
the rearranged rotation matrix is denoted by B
r
t
. The
training set for classifier SVM
t
is [XB
r
t
, Y]. Details of
RotaSVM are mentioned in Figure 2.
In the testing phase, given a test sample κ, let
SVM
t,i
(κB
r
t
) be the posterior probability produced by
the classifier SVM
t
on the hypothesis that κ belongs
to class ω
i
. Then the confidence for a class is calcu-
lated by the average posterior probability of combined
SVMs as follows:
ϕ
i
(κ) =
1
⊤
⊤
X
t=1
SVM
t,i
(κB
r
t
), where i = 1, 2, . . . , c (1)
Thereafter, κ is assigned to the class with the largest
confidence.
The RotaSVM is applied to predict the HLA class
II-peptide binding, separately for DP, DQ and DR.
Random sub-sampling validation is used for this ex-
periment to prepare the training and testing data. Ac-
cording to the used method, the dataset is randomly
split into training and testing (validation) data. For
each of the selected threshold values of DP, DQ and
BIOINFORMATICS2014-InternationalConferenceonBioinformaticsModels,MethodsandAlgorithms
180
Activity list preperation
based on Threshold
values for HLA
class II DP, DQ
and DR
separately
RotaSVM
Output
Prediction
Results
Unknown
Peptides
??
Homogenization
and Numeric conversion
of 15 Amino Acids long
sequences
HLA class II
Protein-Peptide
binding data
(27 Proteins and
636 Peptides)
IEDB
40
HQI
Data Generation
Prediction
Generation of
training data for
HLA class II
DP, DQ and
DR
separately
Selection of
Threshold value
based on Percentage
of Positive Activity
(PPA)
Figure 1: A block diagram of the workflow.
For t = 1 to T
For s = 1 to ξ
Creat sub
Matrix X
t,s
Apply PCA
on Bootstrap
sample of X´
t,s
and load
PCA Coeff.
in M
t,s
End
Loop
Arrange PCA
Coeff. in a
Rotation
Matrix B
r
t
New
Training
Set XB
r
t
, Y
PCA
Coeff.
B
r
t
New Test
Set XB
r
t
SVM SVM SVM
End
Loop
Avg. Posterior
Probability
Classifiers
RotaSVMInput Data Output Prediction results
Training Data
X = Dataset
Y = Class Label
T = Ensemble Size
ξ = Feature sets Number
Testing Data
X= Dataset for
Classification
Figure 2: A block diagram of the RotaSVM.
DR, the dataset is randomly split three times. This is
done to eliminate the possible bias during the train-
ing procedure in any given train/test dataset combina-
tion use space. Afterward, the train and test datasets
are normalized, where each input data is normalized
to the range [0,1]. Thereafter, for each such split,
RotaSVM learns the normalized training data and
predictive accuracy is assessed using three randomly
chosen normalized test data. The results are then av-
eraged over different such splits. Here, two thirds of
the dataset is used for training the classifier and rest
of the dataset is used for testing. Among 636 pep-
tides, which are responsible for binding to HLA-DP, -
DQ and -DR proteins, are separately identified by Ro-
taSVM.
3 RESULTS AND DISCUSSIONS
3.1 Performance Metrics
The performance evaluation of the RotaSVM for
HLA class II protein-peptide interaction prediction is
here reported. Different measures are used as perfor-
mance metric for the RotaSVM. These measures can
be derived from the following four scalar quantities;
TP (true positives: number of correctly predicted pep-
tides that bind HLA class II proteins), TN (true neg-
atives: number of correctly predicted peptide as non-
binders of HLA class II proteins), FP (false positives:
number of incorrectly predicted peptides that bind
HLA class II proteins), FN (false negatives: number
of non-correctly predicted peptides as non-binders of
HLA class II proteins). The above four measures in-
cluding the accuracy, precision or PPV, recall or sen-
sitivity, F-measure, MCC, and area under the ROC
curve (AUC) values are calculated as follows.
Accuracy =
(TP+ TN)
(TP+ TN + FP+ FN)
×100
(2)
Precision = PPV =
TP
(TP+ FP)
×100
(3)
Recall = Sensitivity =
TP
(TP+ FN)
×100
(4)
F-measure =
(Precision×Sensitivity)
(Precision+ Sensitivity)
×2
(5)
ApplicationofRotaSVMforHLAClassIIProtein-PeptideInteractionPrediction
181

Table 2: Performance comparison of RotaSVM based HLA II-peptide binding predictor with other classifiers in terms of
average Accuracy, Precision, Recall, F-measure, MCC, PPV and AUC.
Algorithm HLA II Accuracy Precision Recall or F-measure MCC AUC
(%) or PPV Sensitivity
DP 89.03 91.12 97.09 94.01 0.74 0.82
RotaSVM DQ 82.44 76.65 99.49 86.59 0.69 0.81
DR 80.74 80.92 99.07 89.08 0.43 0.88
DP 80.00 88.17 89.45 88.81 0.40 0.78
SVM DQ 76.06 76.36 99.49 86.40 0.33 0.78
DR 78.89 79.18 99.53 88.20 0.37 0.78
DP 77.42 88.39 85.82 87.08 0.36 0.76
RF DQ 67.18 77.83 79.80 78.80 0.21 0.64
DR 75.93 82.82 87.85 85.26 0.34 0.72
DP 74.52 95.79 74.55 83.84 0.34 0.69
NB DQ 77.22 77.69 98.48 86.86 0.36 0.77
DR 76.30 87.50 81.78 84.54 0.35 0.75
DP 80.97 89.13 89.45 89.29 0.45 0.79
K-NN DQ 71.04 75.95 90.91 82.76 0.32 0.76
DR 73.33 80.87 86.92 83.78 0.33 0.69
0 0.2 0.4 0.6 0.8 1
0
0.1
0.2
0.3
0.4
0.5
0.6
0.7
0.8
0.9
1
False positive rate (1−Specificity)
True positive rate (Sensitivity)
RotaSVM
SVM
RF
NB
K−NN
0 0.2 0.4 0.6 0.8 1
0
0.1
0.2
0.3
0.4
0.5
0.6
0.7
0.8
0.9
1
False positive rate (1−Specificity)
True positive rate (Sensitivity)
RotaSVM
SVM
RF
NB
K−NN
0 0.2 0.4 0.6 0.8 1
0
0.1
0.2
0.3
0.4
0.5
0.6
0.7
0.8
0.9
1
False positive rate (1−Specificity)
True positive rate (Sensitivity)
RotaSVM
SVM
RF
NB
K−NN
(i) (ii) (iii)
Figure 3: ROC plots of HLA class II protein-peptide binding prediction for (i) DP, (ii) DQ and (iii) DR.
MCC =
(TP×TN)−(FN×FP)
√
(TP+FN)×(TN+FP)×(TP+FP)×(TN+FN)
(6)
The effectiveness of the RotaSVM results is also
justified in terms of gain values. The gain achieved
by RotaSVM over other used classifiers is measured.
The calculated gain is expressed in percentage:
Gain =
(PA of RotaSVM - PA of RC)
(PA of RC)
×100
(7)
where PA signifies the Prediction Accuracy, and RC
refers to the Reference Classifier.
In this experiment, the values of ξ and ⊤ for Ro-
taSVM are set to be 3 and 10, respectively as well as
the parameters of SVM such as kernel function and
the soft margin (cost parameter) are set to be 0.5 and
2.0, respectively. Note that, RBF (Radial Basis Func-
tion) kernel is used here for SVM. The K value for
the K-NN classifier is chosen as 13 for the satisfac-
tory operation of the classifier. However, to reduce
the computational time, we adopted the number of it-
eration of the RotaSVM to be as 20. The RotaSVM is
implemented in Matlab version 2012b.
3.2 Perfomance Analysis of RotaSVM
The overall performance of RotaSVM is computed
using three different test sets as described in previ-
ous section. Here, 636 peptides are binded to HLA-
DP, -DQ and -DR, separately. For HLA-DP the av-
erage obtained values of accuracy, precision, recall,
F-measure, MCC and AUC are 89.03%, 91.12, 97.09,
94.01, 0.74 and 0.82 respectively, as reported in Ta-
ble 2. Among three different HLA class II proteins
these are the best results produced by RotaSVM in
comparison with SVM, RF, NB and K-NN classi-
fiers. RotaSVM provides highest values of accuracy,
F-measure and MCC on HLA-DP. In addition, Ro-
taSVM shows equal best values of recall or sensitiv-
ity, 99.49, along with the SVM classifier on HLA-
DQ. However, it is observed that lower threshold val-
ues generate overfitting by producing similar preci-
sion and recall values. Hence, 15%, 30% and 30%
threshold levels are chosen for DP, DQ and DR re-
spectively, to have balanced number of positive and
BIOINFORMATICS2014-InternationalConferenceonBioinformaticsModels,MethodsandAlgorithms
182

negative binding peptides.
ROC curves (Swets, 1988) are plotted here as one
of the robust approaches for classifier evaluation. The
ROC curves show the trade-off between average true
positive rate (sensitivity) and false positive rate (1-
specificity) over their entire range of possible val-
ues. Furthermore, the performances of each classifier
are also measured by AUC, which reflects the abil-
ity of the classifiers to discriminate binders from non-
binders. We have plotted the ROC curves for all clas-
sifiers based on HLA class II protein-peptide binding
prediction in Figure 3. RotaSVM has produced best
values of AUC for DP, DQ and DR, 0.82, 0.81 and
0.88, respectively in comparison with other methods.
These results further reinforced the efficacy of the Ro-
taSVM.
The gain values of RotaSVM over other classi-
fiers are reported in Table 3. Based on obtained accu-
racy the gains are computed for three different types
of HLA class II proteins-peptides binding prediction.
The results suggest a positive gain of RotaSVM over
all other used classifiers. It demonstrates the effec-
tiveness of RotaSVM in finding HLA class II protein-
peptide binding interaction.
Table 3: Gain values of RotaSVM in comparison with other
classifiers.
HLA II SVM (%) RF (%) NB (%) K-NN (%)
DP 11.29 15.00 19.48 09.96
DQ 08.39 22.71 06.76 16.04
DR 02.35 06.34 05.83 10.10
3.3 Statistical Analysis
Statistical significance of RotaSVM results with re-
spect to other classifiers is analysed by using the
Friedman test (Friedman, 1937; Friedman, 1940), at
the 5% significance level. Friedman test is a non-
parametric test, where accuracy values of 20 runs for
three difference HLA-DP, -DQ and -DR are consid-
ered. According to Friedman test it is assumed that,
for a null hypothesis there is no significant differ-
ence between the accuracy values of different groups.
Whereas, according to the alternative hypothesis it
is considered that there is a strong significant differ-
ence in the accuracy values within the groups. Ta-
ble 4 reports the rank of each individual classifier for
HLA-DP, -DQ and -DR as well as the average rank of
each classifier. Moreover, the results in Table 5 reveal
average Chi-Square value and corresponding p-value
are 47.713 and 0.142×10
−5
, respectively, which in-
dicate the acceptance of alternative hypothesis. That
means, the average accuracy values produced by Ro-
taSVM are statistically significant for all proteins, and
this fact remarks the significant superiority of the Ro-
taSVM for predicting HLA class II protein-peptide
binding activity.
Table 4: The Friedman ranks of all classifiers.
HLA II RotaSVM SVM RF NB K-NN
DP 2.00 3.47 3.53 4.00 3.47
DQ 2.43 3.93 5.00 3.29 4.42
DR 2.92 3.65 3.77 3.99 4.14
Average Rank 2.45 3.68 4.10 3.76 4.01
Table 5: The results of Friedman test.
HLA II Chi-Square p-value
value
DP 71.802 0.111 ×10
−5
DQ 32.754 0.100 ×10
−5
DR 38.584 0.215 ×10
−5
Average 47.713 0.142×10
−5
4 CONCLUSIONS
This article demonstrates the effectiveness of the
ensemble classier, called RotaSVM, with the use of
principal component analysis to create new feature
sets for prediction of binding peptides to Human
Leukocyte Antigens class II proteins. The effec-
tiveness of the RotaSVM is shown by comparing it
with the traditional machine learning algorithms like
support vector machine, random forest, naive bayes
and K-nearest neighbor in terms of average precision,
recall, accuracy, F-measure, Matthew’s correlation
coefficient and area under the ROC curve values.
Finally, the goodness of the RotaSVM for predicting
HLA class II protein-peptide binding activity is also
shown by computing the gain values along with the
statistical significance test. From the results, it can
be concluded that the RotaSVM achieved maximum
22.71% gain over Random Forest classifier for
HLA-DQ and average gain of 11.19% over all the
classifiers for three HLA class II proteins.
For future scope of research, this RotaSVM can
be applied to facilitate the laboratory experimental
work, when there is the need of HLA specific protein-
peptide binding prediction. In addition to this, feature
selection and classification play a crucial role in
Microarray data analysis (Saha et al., 2011b; Saha
et al., 2012; Saha et al., 2011d), pixel classification
of satellite images (Saha et al., 2011c; Maulik and
Saha, 2010) and other fields of engineering and
science (Maulik et al., 2010; Saha et al., 2010; Sur
et al., 2009; Saha and Mukhopadhyay,2008). In such
cases, application of RotaSVM would be interesting
ApplicationofRotaSVMforHLAClassIIProtein-PeptideInteractionPrediction
183

to study. Currently, the authors are working in
this direction.
ACKNOWLEDGEMENTS
This work is partially supported by Erasmus Mundus
Mobility with Asia (EMMA) grant 2012 from the Eu-
ropean Union at the Department of Informatics, Uni-
versity of Evora in Portugal and University with Po-
tential for Excellence (UPE)-Phase II project grant
from University Grants Commission (UGC) in India.
REFERENCES
Bhowmick, S. S., Saha, I., Rato, L., and Bhattacharjee, D.
(2013). RotaSVM: A new ensemble classifier. Ad-
vances in Intelligent Systems and Computing, 227:47–
57.
Breiman, L. (2001). Random forests. Machine Learning,
45(1):5–32.
Brusic, V., Rudy, G., Honeyman, G., Hammer, J., and L,
L. H. (1998). Prediction of MHC class II-binding
peptides using an evolutionary algorithm and artificial
neural network. Bioinformatics, 14:121–130.
Bui, H. H., Sidney, J., Peters, B., Sathiamurthy, M., Sinichi,
A., Purton, K. A., Moth, B. R., Chisari, F. V., Watkins,
D. I., and Sette, A. (2005). Automated generation and
evaluation of specific MHC binding predictive tools:
ARB matrix applications. Immunogenetics, 57:304–
314.
Chang, S. T., Ghosh, D., Kirschner, D. E., and Linder-
man, J. J. (2006). Peptide length-based prediction
of peptide-MHC class II binding. Bioinformatics,
22:2761–2767.
Cover, T. and Hart, P. (1967). Nearest neighbor pattern clas-
sification. IEEE Transactions on Information Theory,
13(1):21–27.
Friedman, M. (1937). The use of ranks to avoid the as-
sumption of normality implicit in the analysis of vari-
ance. Journal of the American Statistical Association,
32:675–701.
Friedman, M. (1940). A comparison of alternative tests of
significance for the problem of m rankings. Annals of
Mathematical Statistics, 11:86–92.
George, H. and Langley, J. P. (1995). Estimating continuous
distributions in bayesian classifiers. in Proceedings of
the Eleventh Conference on Uncertainty in Artificial
Intelligence, 69:338–345.
Greenbaum, J., Sidney, J., Chung, J., Brander, C., Peters,
B., and Sette, A. (2011). Functional classification of
class II human leukocyte antigen (HLA) molecules re-
veals seven different supertypes and a surprising de-
gree of repertoire sharing across supertypes. Immuno-
genetics, 63(6):325–335.
Haque, A. and Blum, J. S. (2005). New insights in anti-
gen processing and epitope selection: development
of novel immunotherapeutic strategies for cancer, au-
toimmunity and infectious diseases. Journal of Bi-
ological Regulators and Homeostatic Agents, 19:93–
104.
Karpenko, O., Shi, J., and Dai, Y. (2005). Prediction of
MHC class II binders using the ant colony search strat-
egy. Artificial Intelligence in Medicine, 35:147–156.
Lauemoller, S. L., Kesmir, C., Corbet, S. L., Fomsgaard, A.,
Holm, A., Claesson, M. H., Brunak, S., and Buus, S.
(2000). Identifying cytotoxic T cell epitopes from ge-
nomic and proteomic information. Rev Immunogenet,
2:447–491.
Maulik, U., Bandyopadhyay, S., and Saha, I. (2010). In-
tegrating clustering and supervised learning for cate-
gorical data analysis. IEEE Transactions on Systems,
Man and Cybernetics Part-A, 40(4):664–675.
Maulik, U. and Saha, I. (2010). Automatic fuzzy clustering
using modified differential evolution for image classi-
fication. IEEE Transactions on Geoscience and Re-
mote Sensing, 48(9):3503–3510.
Moutaftsi, M., Peters, B., Pasquetto, V., Tscharke, D. C.,
Sidney, J., Bui, H. H., Grey, H., and Sette, A. (2006).
A consensus epitope prediction approach identifies the
breadth of murine T(CD8+)-cell responses to vaccinia
virus. Nature Biotechnology, 24:817–819.
Murugan, N. and Dai, Y. (2005). Prediction of MHC class II
binding peptides based on an iterative learning model.
Immunome Research, 1:6.
Nielsen, M., Lundegaard, C., Blicher, T., Lamberth, K.,
Harndahl, M., and et al. (2007). NetMHCpan, a
method for quantitative predictions of peptide bind-
ing to any HLA-A and -B locus protein of known se-
quence. PLoS ONE, 2:e796.
Nielsen, M., Lundegaard, C., Worning, P., Hvid, C. S.,
Lamberth, K., Buus, S., Brunak, S., and Lund, O.
(2004). Improved prediction of MHC class I and class
II epitopes using a novel gibbs sampling approach.
Bioinformatics, 20:1388–1397.
Plewczynski, D., Basu, S., and Saha, I. (2012). AMS 4.0:
consensus prediction of post-translational modifica-
tions in protein sequences. Amino Acid, 43(2):573–
582.
Ramana, J. and Gupta, D. (2010). Machine learning meth-
ods for prediction of CDK-Inhibitors. PLoS ONE,
5(10).
Saha, I., Maulik, U., Bandyopadhyay, S., and Plewczynski,
D. (2011a). Fuzzy clustering of physicochemical and
biochemical properties of amino acids. Amino Acid,
43(2):583–594.
Saha, I., Maulik, U., Bandyopadhyay, S., and Plewczyn-
ski, D. (2011b). Improvement of new automatic dif-
ferential fuzzy clustering using SVM classifier for mi-
croarray analysis. Expert Systems with Applications,
38(12):15122–15133.
Saha, I., Maulik, U., Bandyopadhyay, S., and Plewczynski,
D. (2011c). SVMeFC: SVM ensemble fuzzy clus-
tering for satellite image segmentation. IEEE Geo-
science and Remote Sensing Letters, 9(1):52–55.
BIOINFORMATICS2014-InternationalConferenceonBioinformaticsModels,MethodsandAlgorithms
184

Saha, I., Maulik, U., Bandyopadhyay, S., and Plewczyn-
ski, D. (2011d). Unsupervised and supervised learn-
ing approaches together for microarray analysis. Fun-
damenta Informaticae, 106(1):45–73.
Saha, I., Mazzocco, G., and Plewczynski, D. (2013). Con-
sensus classification of human leukocyte antigen class
II proteins. Immunogenetics, 65(2):97–105.
Saha, I. and Mukhopadhyay, A. (2008). Improved crisp
and fuzzy clustering techniques for categorical data.
IAENG International Journal of Computer Science,
35(4):438–450.
Saha, I., Plewczynski, D., Maulik, U., and Bandyopadhyay,
S. (2010). Real-coded differential crisp clustering for
MRI brain image segmentation. in Proceedings of the
IEEE Congress on Evolutionary Computation, pages
3912–3919.
Saha, I., Plewczynski, D., Maulik, U., and Bandyopadhyay,
S. (2012). Improved differential evolution for microar-
ray analysis. International journal of data mining and
bioinformatics, 6(1):86–103.
Salomon, J. and Flower, D. R. (2006). Predicting class II
MHC-peptide binding: a kernel based approach using
similarity scores. BMC Bioinformatics, 7:501.
Sette, A. and Peters, B. (2007). Immune epitope mapping
in the post-genomic era: lessons for vaccine develop-
ment. Current Opinion in Immunology, 19:106–110.
Singh, H. and Raghava, G. P. (2001). Propred: prediction
of HLA-DR binding sites. Bioinformatics, 17:1236–
1237.
Stern, L. J. and Wiley, D.C. (1994). Antigenic peptide bind-
ing by class I and class II histocompatibility proteins.
Structure, 2(4):245–251.
Sturniolo, T., Bono, E., Ding, J., Raddrizzani, L., Tuereci,
O., Sahin, U., Braxenthaler, M., Gallazzi, F., Protti,
M. P., Sinigaglia, F., and Hammer, J. (1999). Genera-
tion of tissue-specific and promiscuous HLA ligand
databases using DNA microarrays and virtual HLA
class II matrices. Nature Biotechnology, 17:555–561.
Sur, A., Patra, N., Chakraborty, S., and Saha, I. (2009). A
new wavelet based edge detection technique for iris
imagery. IEEE International Conference on Advance
Computing Conference, pages 120–124.
Swets, J. A. (1988). Measuring the accuracy of diagnostic
systems. Science, 240:1285–1293.
Vapnik, V. N. (1995). The Nature of Statistical Learning
Theory. Springer.
Wan, J., Liu, W., Xu, Q., Ren, Y., Flower, D. R., and Li, T.
(2006). SVRMHC prediction server for MHC-binding
peptides. BMC Bioinformatics, 7:463.
Yewdell, J. W. and Bennink, J. R. (1999). Immunodom-
inance in major histocompatibility complex class I-
restricted T lymphocyte responses. Annual Review of
Immunology, 17:51–88.
ApplicationofRotaSVMforHLAClassIIProtein-PeptideInteractionPrediction
185
