
How Green Are Java Best Coding Practices?
J
´
er
ˆ
ome Rocheteau, Virginie Gaillard and Lamya Belhaj
Institut Catholique d’Arts et M
´
etiers, 35, Avenue du Champ de Manœuvre, 44470 Carquefou, France
Keywords:
Software Energy Consumption, Java, Best Coding Practices, Software Ecodesign.
Abstract:
This paper aims at explaining both how to measure energy consumption of Java source codes and what kind
of conclusions can be drawn of these measures. This paper provides a formalization of best coding practices
with a semantics based on quantitative metrics that correspond to the time, memory and energy saved while
applying best coding practices. This paper also explains how to measure such source codes in order to provide
repeatable and stable measures by combining both physical and logical sensors.
1 INTRODUCTION
Information and Communication Technologies ac-
counted 2% of global carbon emissions in 2007 e.g.
830 MtCO2e according to (Webb, 2008) and is ex-
pected to growth to 1.430 MtCO2e. Rising energy
costs of computers and mobile devices becomes a
crucial issue and software has a major influence on
these device consumption. In this paper, we target
software developers and we propose to qualify en-
ergy savings applying the best coding practices. Best
coding practices can be seen as a set of informal
rules that the software development community has
learned over time to improve the quality of applica-
tions, simplify their maintenance and increase their
performance (Bloch, 2008). Defined as follows best
coding practices should exactly cover that of eco-
design. In fact, eco-design can be defined as an ap-
proach to design a product with considerations for its
environmental impacts during its entire lifecycle. It
aims at understanding our ecological footprint on the
planet by searching for new building solutions that are
environmentally friendly and leading to a reduction in
the consumption of materials and energy. As improv-
ing code performance often has a positive effect on
energy consumption: the latter decreases. This state-
ment that best coding practices are eco-design rules as
a matter of fact will be examined in this paper which
focuses on Java best practices only as a starting point.
But it also aims at measuring which are the best or the
most green patterns among best coding practices.
However, it remains two issues to tackle. Firstly, as
it has been defined previously, best coding practices
are informal set of rules. This means that we should
formalize them in order to assign them an energy se-
mantics. Secondly, when best coding practices show
examples of source code, this always involves very
small pieces of code or codes without their context
of use. As it has been pointed out by (Wilke et al.,
2011a), works about software energy consumption
actually consists in test scenarios (use cases) of whole
applications but not on micro-benchmarking. It has
to provide repeatable and stable measures from such
small source codes that should be undertaken in very
tiny laps of time with very little electrical power.
In this paper, we propose to deal with these two
problems as follows. We formalize best coding prac-
tices by a pair of two executable source codes. One
the green code corresponds to the model code that
should be implemented for a given purpose, the other
one the grey code corresponds to the code that should
be replaced by the first one. Then, we assign a code
semantics as a triple given by:
1. the time required by the code to be run,
2. the memory space used by the code while running,
3. the energy consumed by the code during its run.
Furthermore, this semantics is naturally prolonged to
best coding practices as the rate respectively between
the time, memory and energy of its green code over
its grey one.
The second issue is tackled by setting up a mea-
sure system that manages codes, performs their mea-
sures and provides analysis results. It is composed
of physical and logical sensors synchronized together
by a main application. Logical sensors consist in pro-
grams that provide the time and the memory used by
each code measure as well as its number of execu-
235
Rocheteau J., Gaillard V. and Belhaj L..
How Green Are Java Best Coding Practices?.
DOI: 10.5220/0004808302350246
In Proceedings of the 3rd International Conference on Smart Grids and Green IT Systems (SMARTGREENS-2014), pages 235-246
ISBN: 978-989-758-025-3
Copyright
c
2014 SCITEPRESS (Science and Technology Publications, Lda.)

tions. The latter value is important in order to re-
late each metric to one execution of a given code.
Moreover, the system involves a micro-benchmarking
framework that prevents us from edge effects due to
Java virtual machines. Physical sensor provide the en-
ergy consumed by each code measure. The main ap-
plication manages sensors, code measures and stores
their results.
2 RELATED WORK
Works undertaken on computer energetic consump-
tion has evolved from hardware to software as the ob-
ject of studies and from physical sensors to logical
ones as measurement instruments. Moreover, energy
analysis of software focus more and more on fine-
grain code blocks and not even more on whole ap-
plications.
We follow this last path as well as we examine
best coding practices from an energy point of view.
However, at the same time, we defend a hybrid ap-
proach of physical and logical sensor systems. We
argue that it still provides a better precision for our
study cases. Effectively, the pieces of code that we
analyze run in a few nano-seconds and consume few
nano-Joules. Moreover, mixing measure values en-
ables us to set up robust energy indicators and could
certainly be extended to other data.
Nevertheless, the vision exposed in (Wilke et al.,
2011b) sketches the future of energy consumption
monitoring as reducing the energy it consumes. In
fact, it aims at designing a static analysis method able
to calculate energy consumption correctly. Although,
its authors establish an abstract interpretation for soft-
ware energy, we target an analysis based on waste
density. Therefore, it requires determining the ele-
mentary energy waste or gaining throughout the com-
pliance or not with best coding practices.
2.1 Software Energy Consumption
Two salient points have been very well explained
in (Garrett, 2007). Firstly, we cannot afford to wait for
technological breakthroughs in semiconductor tech-
nology for power savings. Secondly, as a conse-
quence of the first point, we have to find a way to re-
duce energy consumption of our hardware devices by
reducing those of our software. And more precisely
throughout middleware components e.g. hardware
devices and operating systems. This is possible as
hardware provides power management systems such
as processor frequency scaling or idle-power state
management; however, as it is also exposed in (Saxe,
2010), this leads us to design energy efficient soft-
ware.
Software doesn’t consume energy directly! Com-
ponents that require electrical power are hardware
ones, not software. However, as hardware executes
software instructions, it is meaningful to state that
software consumes energy i.e. software makes hard-
ware consume energy while the latter executes in-
structions of the former. It has been shown in (Wilke
et al., 2011a) there exists 6 levels from hardware com-
ponents to software ones that could rise energy con-
sumption. Several works focus on different elements
of different scales as for example, from databases
in (Tsirogiannis et al., 2010) to data centers in (Poess
and Nambiar, 2008); from programming languages
in (Noureddine et al., 2012a) to one language oper-
ation codes in (Lafond and Lilius, 2006).
This leads us to elaborate an incremental testing
plan of Java best coding practices. The latter consists
in testing best practices in the same environment e.g.
exactly the same hardware and software components.
Then, we test again the same ideal practices within
the same environment with two parameters: the pro-
cessor and the Java virtual machine. By combination,
it only represents Four different testing environments
for Java best practices but it stands for the main com-
ponents for leveraging energy consumption in the lit-
erature.
2.2 Software Energy Benchmarking
Software energy benchmarking can be divided into
two sub-categories: the behavioral evaluations and
the structural ones. Behavioral evaluations corre-
spond to the fact that energy measures are related to
a use case or scenario. It then consists in measur-
ing energy consumption during an application carried
out according to a scenario. These means of evalu-
ations have been applied by (Wilke et al., 2012), for
instance, on mobile applications in order to propose
energy efficiency classes the same as for washing ma-
chines, dryers, refrigerators and freezers. In (Noured-
dine et al., 2012a), the energy efficiency of program-
ming languages is estimated on several implementa-
tions of the game Tower of Hanoi. The latter cor-
responds to what we call a behavioral evaluations
e.g. evaluations of the application main functionali-
ties. This last study breaks a common belief that stan-
dard Java is not energy efficient as it shows that only
the C implementation compiled with all options for
optimization is more energy efficient. These sorts of
evaluations are wide spread in energy benchmarking.
By structural evaluations, we conclude that energy
measures are related to structural code blocks and not
SMARTGREENS2014-3rdInternationalConferenceonSmartGridsandGreenITSystems
236

to a scenario. For example, (Lafond and Lilius, 2006)
elaborate a framework for estimating energy cost of
Java applications by analyzing its byte code. It then
consists in evaluating the Java virtual machine op-
eration codes and in assigning them an energy cost
in nano-Joules. Moreover, in (Seo et al., 2007), a
framework is elaborated for estimating energy costs
of Java applications either while designing or at run-
time. They focus on a component based approach i.e.
the total energy cost has been split into 3 sub-costs:
computation, communication and infrastructure cost.
These energy cost models concern Java components.
In order to provide a static analysis, we cannot afford
to analyze Java byte code suggested by (Lafond and
Lilius, 2006). However, we aim at providing the same
standard of results for Java best practices.
2.3 Power Instruments
Instruments for measuring energy consumption can
be divided into 2 categories: the physical devices and
the logical ones. The first ones, like watt-meters or
power-meters, allow to keep defining the baseline of
power measure precision. The second ones claim to
be as accurate as physical measures but with the po-
tential of being focused and portable. By focused,
we mean that it can monitor a single process inside
threads of processes whereas an external physical de-
vice could monitor all active threads at a given time.
Effectively, (Noureddine et al., 2012b) states that a
margin error of only 0.5% exists for their CPU power
model between values provided by a power-meter and
those drawn out from Power API (Boudon, 2013).
Moreover, the PowerTOP tool (van de Ven and Ac-
cardi, 2013) is known for helping developers to fix
power leaks in their source code. This is even more
explicit for JouleUnit (Wilke et al., 2013) that itself
provide the baseline results in the project of elaborat-
ing an abstract interpretation for energy consumption
of mobile application (Wilke et al., 2011b). Other log-
ical tools are discussed in (Noureddine et al., 2012a)
but they only provide raw data, e.g. CPU frequency
or utilized memory, but neither power nor energy in-
formation.
However, our own experiments with these tools
did not provide the same accuracy as those claimed
by their authors, the outcome turning out not to be
relevant in our working context. We suggest that the
reason lies in the fact that best practices involves too
short carried out times required by these tools for re-
trieving input data to their software energy consump-
tion models. In fact, they behave all in the same man-
ner as they extract information of idle-power states or
battery status from the operating system log files in
order to estimate the processor energy consumption
(for instance, by using the procfs library under Linux
boxes). We then designed a hybrid instrument sys-
tem for measuring time, memory and energy used by
a software implementation (see section 4.1). Whereas
the physical sensor we use was originally devoted for
calibrating logical sensors, the ability of retrieving
and handling its digital outputs makes it possible to
employ it in the same way as a software component
and to provide its results as a service.
3 JAVA BEST PRACTICES
This section aims at describing how to handle best
coding practices for establishing or not their energy
savings. Firstly, it is explained in the section 3.1 how
to transform informal textual recommendations into
occurrences of a formal definition as pairs of codes
that are opposed throughout these best practices, ex-
plicitly or implicitly. Secondly, the section 3.2 ex-
plains the energy semantics of such best practices
which relies on time, memory and energy consumed
while running the codes involved in given best prac-
tices. Finally, the twenty Java best practices that will
be analyzed below are presented in the section 3.3.
3.1 Best Practice Formalization
Java best coding practices are collections of sugges-
tions and recommendations about the best code to
produce according to a context or a coding goal as
it is presented in (Bloch, 2008). Moreover, best prac-
tices could tackle either low-level design patterns as
well as high-level ones. For instance, design by con-
tracts
1
is addressed by a best practice whereas another
one explains that developers should not use tab char-
acters in the source code for indenting lines of code!
These examples show that best coding practices scale
from abstract to concrete layers of programming pro-
cesses. Best practices aim at improving code imple-
mentations in different manners (Sestoft, 2005, bonus
on performance):
Efficiency: some other best practices improve code
performances in time and memory;
Maintainability: some best practices help develop-
ers to maintain pieces of code in ensuring the
use of standards and uniform coding, in reducing
oversight errors;
1
Design by contracts is an approach for designing soft-
ware with formal, precise and verifiable interface specifica-
tions for software components. This extends the ordinary
definition of abstract data types with preconditions, post-
conditions and invariants.
HowGreenAreJavaBestCodingPractices?
237

Interoperability: other best practices reshape codes
for running them throughout different environ-
ments.
Best coding practices could own samples of code
or not. It could be explained by:
1. what should be done (prefer-this shape),
2. what should not be done (avoid-that shape),
3. both (replace-this-by-that shape).
We focus on best practices that reduce the code foot-
prints as well as in time as in memory i.e. those
of concerning time and memory efficiency in order
to examine if they involve energy consumption rise.
Secondly, we select or complete best practices in or-
der to manage those with a replace-this-by-that shape.
This means that best practices are formally defined by
two codes: a green or clean one (the practice to pre-
fer) and a dirty or grey one (the practice to avoid).
Notice that these codes can be seen as unit test in the
manner they are design (Koskela, 2013). Best prac-
tices are then formalized as follows by the means of
this definition of rule:
Rule: a rule R is a pair composed of two source codes
that are unit tests with exactly one test method.
Concretely, the figure 1 illustrates the best prac-
tice stating that it is preferable to initialize strings of
characters literally e.g. without the use of a new con-
structor. This means that we have to complete every
best practices without any code examples, to complete
every prefer-this or replace-that shaped best practices
in order to rewrite them accordingly to the replace-
that-by-this shape.
3.2 Energy Model
The table 1 corresponds to the energy model of twenty
rules i.e. formalized best practices. Effectively, there
are 8 attributes per rule; four attributes by code as a
rule is composed by two codes. These four attributes
are:
Energy. This is the average measure of energy con-
sumed by the green or grey code in nano-Joules;
Time. This is the average time taken by the green or
grey code in nano-seconds;
Memory. This is the average memory space used by
the green or the grey code;
StdDev. This is, for the green or grey code, the stan-
dard deviation rate of each energy measure against
the energy average measure of this code.
Therefore, an energy interpretation of rules consists
in comparisons, firstly, between the green energy and
the grey one i.e. the energy of its green code and that
of its grey one, between its green time and its grey
one, between its green memory and its grey one as
well as between the standard deviation of measures
of its green code and standard deviation of measures
of its grey one. The first two indicators precisely fo-
cused on energy savings. The following two indica-
tors concerns impact factors on the previous one. As
for the last indicator, it defines the confidence about
measures that support these indicators. Finally, our
energy model makes possible to state that a best prac-
tice is an eco-design rule if it provides absolute or
relative energy gains. And the lowest are both of its
green and grey standard deviations, the strongest this
statement holds.
3.3 Study Cases
Twenty Java best practices are analyzed within the ta-
bles 5 and 1. These best practices can be dispatched
into 5 groups.
A first set of four best practices focuses on FOR
loops in Java. The first rule compares a loop of in-
tegers (the green code) between a loop of floats (the
grey one) with exactly the same size of items and the
same loop body. The second rule compares a loop
of integers which the number of iterated items is pro-
vided by a method called once before the loop starts
(the green code) and a loop of integers in which such
method is called in the loop condition statement (the
grey one). The third rule compares a decreasing loop
of integers in which the condition statement is a com-
parison to zero (the green code) and an increasing
loop of integers in which the condition statement is
a comparison to the number of iterated items. The
fourth and last rule compares a loop with two condi-
tion statements: the loop of the green code tests the
most common condition first and the grey one tests
the same most common condition at last.
The second group of best practices is composed
8 rules that corresponds to the same rule instantiated
according to 8 Java types (strings, floats, integers,
booleans, characters, doubles, longs and shorts). It is
illustrated by the figure 1 for the Java type of strings.
They compares initializations of variables either by a
literal value, or by allocating a new object.
The third and fourth groups of best practices re-
spectively focuses on how and when it is the best to
set the size of string buffers and string builders. Both
groups are composed of the same 3 rules. The first
rule compares an initialization with the size set in pa-
rameter and an initialization without such setting. The
second rule compares the invocation of the method
that ensures the capacity of such structures against a
SMARTGREENS2014-3rdInternationalConferenceonSmartGridsandGreenITSystems
238

Listing 1: Example of Green Code.
p u b l i c c l a s s S t r i n g V a l u e {
p r i v a t e S t r i n g [ ] a r r a y ;
p u b l i c v o i d s e tUp ( ) {
a r r a y = new S t r i n g [ 1 0 0 0 ] ;
}
p u b l i c v o i d doRun ( ) {
f o r ( i n t i = 0 ; i < 1000 ; i ++) {
a r r a y [ i ] = ” a b c d e f g ” ;
}
}
p u b l i c v o i d te arDown ( ) { }
}
Listing 2: Example of Grey Code.
p u b l i c c l a s s S t r i n g O b j e c t {
p r i v a t e S t r i n g [ ] a r r a y ;
p u b l i c v o i d s e tUp ( ) {
a r r a y = new S t r i n g [ 1 0 0 0 ] ;
}
p u b l i c v o i d doRun ( ) {
f o r ( i n t i = 0 ; i < 1000 ; i ++) {
a r r a y [ i ] = new S t r i n g ( ” a b c d e f g ” ) ;
}
}
p u b l i c v o i d te arDown ( ) { }
}
Listing 3: Rule.
<rule id="prefer-string-value-initialization">
<title>Prefer string value initialization</title>
<description>
Primitive type objects should be initialized literally
e.g. with primitive values and without the use of any constructors.
</description>
<check green="codes.r96.StringValue" grey="codes.r96.StringObject" />
</rule>
Figure 1: Java Best Practice Example.
code that doesn’t invoke such a method. The third rule
compares the invocation of the method that set the
length of such structures against a code that doesn’t
invoke such a method.
The fifth and last group of best practices gathers
2 rules that compares the use of Java primitive types
against wrappers. The first rule compares a code in
which variables have for type the primitive type int
and the same code in which variables have for type
the wrapper one Integer. The second rule compares
a code in which variables have for type the primitive
type float and the same code in which variables have
for type the wrapper one Float.
4 MEASURE PROTOCOL
Measure protocol consists in a process described by
the section 4.3. The latter consists in iterating a single
measure task detailed in section 4.2. The measure in-
struments are previously described in the section 4.1.
4.1 Measure Instruments
The goal of our work consists in measuring the gains
involved by applying a best coding practice. These
gains correspond to performance gain e.g. the dif-
ference between the time required by the conducting
of the grey code and the time required by that of the
green code. It also corresponds to the memory gain
e.g. the memory space used by the carrying out of
the grey code against that of the green code. And the
same for the energy gain e.g. the amount of energy
saved by the carrying out of the green code with re-
spect to that of the grey code. This is supposed to be
able to manage fine-grained measures of codes: their
short-time implementations and low energy consump-
tions. This also means to support the fact that mea-
sures have to be stable and repeatable.
We designed and implemented a digital power-
meter made of two current probes and two differen-
tial probes connected together to one acquisition de-
vice that digitalised current and voltage values on 12
bits every 80 milliseconds. It is plugged to any com-
puter by USB and controlled by a logger
2
. This logger
2
It consists in the NI USB-6008 on 12 bits with a 10kHz
frequency e.g. it makes possible to acquire 10.000 measures
HowGreenAreJavaBestCodingPractices?
239

provides a column-separated value (CSV) file with
at least n + 1 columns. The first one corresponds to
the elapsed time from the moment the driver has been
launched e.g. the first value starts at 0, the next starts
at 80 and so on. The other n columns contain the
power measured at the corresponding moment for a
devoted couple of current and differential probes. In-
deed, the CSV file can be seen as a group of func-
tions (p
1
, ··· , p
n
) from an initial segment of the nat-
ural numbers (from 0 to a multiple of 80 ms). Each
function p
i
corresponds to the power p
i
(t
j
) (in watts)
required by the measured device at time t
j
. The fig-
ure 2 presents a graphical view of this CSV file; it
represents the power variation over the time for n de-
vices as the first column of this CSV file corresponds
to the x-axis and the n next columns are dispatched
along the y-axis.
Therefore, the consumed energy is computed ac-
cording to the trapezoidal rule by integrating the
power over the time in order to estimate the area un-
der each function pi, area that corresponds to the total
consumed energy.
We use a Java agent for measuring object memory
space
3
. It provides the memory space allocated by
each unit tests. The latter is more precise than clas-
sical sensors that provide the maximum resident size
as it doesn’t take into account the memory footprint
required by the Java virtual machine.
4.2 Measure Task
Our hybrid approach for measuring energy of Java
code run concentrates on the measure task as the lat-
ter synchronizes the launch of both the physical and
the logical sensors and as it merges their respective
results. This task requires the identifier of the code to
measure and the number of measures to plan. Then, it
processes these following sub-tasks:
1. it calls the logical sensor service that warms up
the given code;
2. it starts the physical sensor;
3. it waits 4 seconds and then calls to logical sensor
service that executes the code;
4. it waits 3 seconds when the previous service re-
sponds and then stops the physical sensor;
5. it computes the consumed energy by the trape-
zoidal rule and stores it into a database.
per second. The logger is designed and implemented using
LabView (www.ni.com/labview).
3
This Java instrument is provided by the library Class-
Mexer (http://www.javamex.com/classmexer).
Such a measure task treats data provided both by the
physical sensor (illustrated by the figure 2) and the
logical one as follows:
• it computes the total consumed energy by the
trapezoidal rule;
• it computes the average power at idleness e.g. dur-
ing the first seconds and the last ones;
• it computes the consumed energy at idleness for
the whole measure by the trapezoidal rule;
• it computes the difference between the total en-
ergy and the idle one in order to highlight the en-
ergy consumed by the code runs only;
• the code consumed energy is normalized accord-
ing to the number of code runs provided by the
logical sensor;
• the three values for time, memory space and con-
sumed energy per code run is recorded into a
database table which primary key is composed by
the code identifier and the time stamp of this mea-
sure.
In fact, this measure task allows us to merge the
energy indicator, computed from the physical sensor
output, with those of time and space provided by the
logical output. It ensures a very fine-grain precision
when such measures tasks are carried out properly.
4.3 Measure Process
But not all measure tasks are correctly performed:
third-party inconveniences can occur and then have
side effects on the measure task results. The mea-
sure process aims at detecting measure task results
that should be omitted for robust measure result sets.
Effectively, this measure process outcome con-
sists in providing stable and repeatable measures for a
given code in order to compare the green code and the
grey one from a Java best coding practice and to en-
sure the amount of energy gain for applying this best
practice. Moreover, this measure process automatizes
thousands of measure launching, their planning and
their cleansing until a quality extent has been reached.
This quality extent - or maturity - is composed of
the number of measures made for a given code and
their standard deviation against the average respec-
tive each time, space and energy values of measures.
This process then iterates measure tasks until each
code measure set reaches the quality extent and re-
tains from these measure sets only those that match
the cleansing rules (see section 5). The measurement
process is itself composed of 6 sub-processes:
SMARTGREENS2014-3rdInternationalConferenceonSmartGridsandGreenITSystems
240
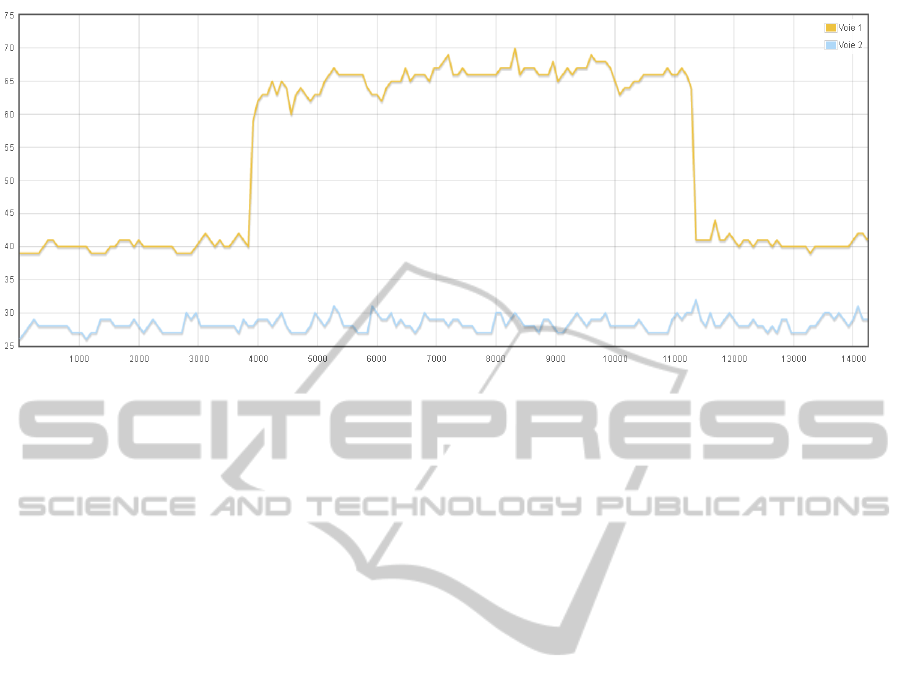
Figure 2: Measure Task Result.
1. the sub-process retrieve consists in retrieving
(hence the name) the code identifiers available on
the logical sensor side;
2. the sub-process clean detects measures that
should be enabled or disabled for all available
codes (see section 5);
3. the sub-process embedd just updates measure
database according to the previous results;
4. the sub-process plan plans measures for codes
which enabled measure set does not reach the de-
fined quality extent;
5. the sub-process launch starts the measurement
task if some measures have been planned and then
iterates from sub-process 2 to sub-process 5, or
exits to sub-process 6 otherwise;
6. the sub-process send reports the results.
In fact, the crucial sub-process is the clean as it re-
moves from the final average values measures either
that should be removed.
5 CODE MEASURE CLEANSING
There are 3 main reasons for removing a measure.
The first one corresponds to the fact that a measure
task has been launched while another third-part pro-
cess was running after the physical sensor start and
before the code run. This case is the left line chart
of the figure 3. And this leads to overestimation of
average power at idle, and then to overestimation of
the consumed energy at idle and therefore to under
estimate the code consumed energy.
The second reason, that is illustrated by the right
line chart of the figure 3, corresponds to the fact
that another third-part process was running before the
physical sensor stop but after the code run has fin-
ished. This leads to overestimate the total energy and
thus to overestimate the code energy (as the idle en-
ergy should correctly be estimated in this case). The
last reason for a measure not to be clean corresponds
to the fact that a third-part process was running be-
tween the beginning and the end of the code run. This
leads therefore to overestimate the code energy.
5.1 Cleansing Rules
Technically, the measure cleansing sub-process con-
sists in a 3-filter process:
• Dirty measures issued from first two reasons are
filtered out by checking the idle periods (e.g. the
first 4 seconds of the measure and the last 3 sec-
onds) in order to detect power values out of an
allowed scope of values.
• Dirty measures issued from the last reason are
firstly filtered out by a mere rule drawn out from
the measurement protocol: as it waits 4 seconds
before, as it runs a code for 10 seconds and as it
waits 3 seconds afterwards, measures which time
value provided by the physical sensor does not ex-
actly match 17 seconds are filtered out. whereas
this could lead to filtered out acceptable measures
i.e. false positive measures (see section 5). this fil-
ter does not keep unacceptable measures i.e. true
negative ones.
• Dirty measures are also filtered out by statistical
means in order to only keep homogeneous mea-
sures. A split-and-merge algorithm (also know
as RamerDouglasPeucker algorithm (Douglas and
Peucker, 1973)) is used allowing us a similar pre-
HowGreenAreJavaBestCodingPractices?
241
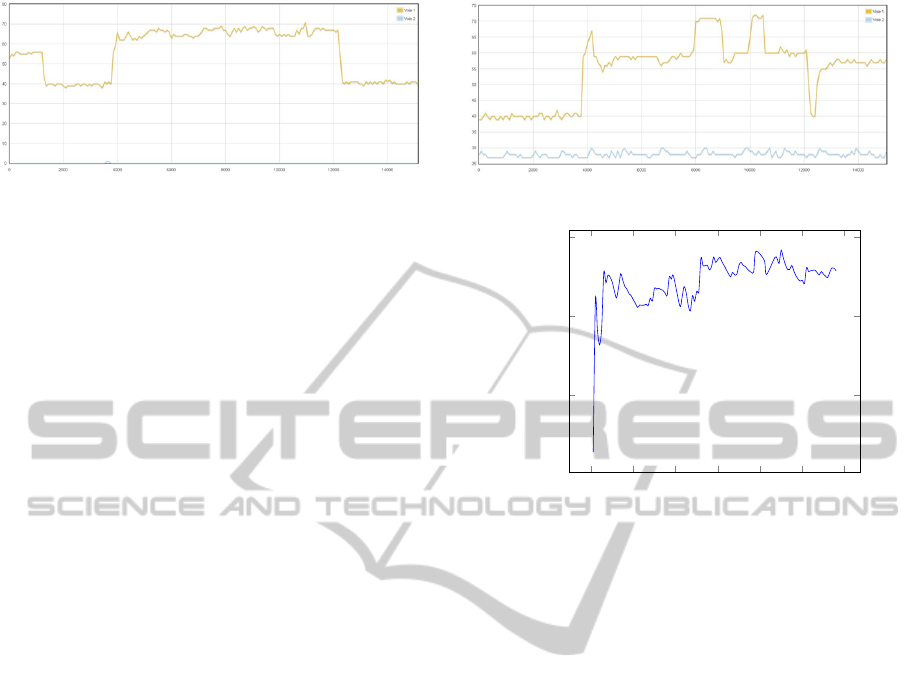
Figure 3: Wrong Measure Examples.
cision than the quartile methods but ensuring us a
perfect recall (the quartile methods do not).
5.2 Cleansing Evaluation
The cleansing algorithm has a major role in our mea-
sure process as it removes measures and tasks which
have not been performed correctly. Rules imple-
mented and described in section 5 are evaluated in
terms of precision and recall(Witten et al., 2011,
p. 175-176) against a set of 200 measures manually
annotated by 3 experts. Each expert assigns a Boolean
value to each measure: true if the given measure is
judged correct and false otherwise. Then, an inter-
annotator agreement is computed by the means of
Fleisss kappa(Fleiss, 1981, p. 38-46). Annotators dis-
agree on 4 measures only (2% of all measures) for a
Fleisss kappa of 0.94 which means an almost perfect
agreement between experts; thus, having a good pre-
cision rate for an algorithm means in this context that
this algorithm does not disable measures that have
been annotated correct. And, having a good recall rate
means that it does disable measures that have been an-
notated incorrect.
We challenge our algorithm against a statistical
baseline: the quartile method. The latter has a pre-
cision of 0.953, a recall of 0.911 for an overall F-
score of 0.931. As for our cleansing algorithm, it
provides a lower precision of 0.941 but a perfect re-
call of 1.0 for a better overall F-score of 0.970. This
means that our algorithm disables more measures that
are annotated correct than the quartile method but it
disables all measures that have been annotated incor-
rect whereas the quartile method does not. Thats why
we keep using this ad hoc algorithm as it perfectly
matches our requirements.
5.3 Code Measure Maturity
Another major issue concerns the number of measures
required for a given code. As a measure performs in
17 seconds, we cannot afford to plan too many mea-
sures per code. On the other hand, we shall provide
results that have to be repeatable in the same environ-
ment and provide minimal but stable result sets.
0 20 40
60
80 100 120
5
10
15
Measure Number
Relative Standard Deviation
Figure 4: Evolution of the relative standard deviation ac-
cording to the number of measures.
Tthe figure 4 sketches the average relative stan-
dard deviation between clean measures for every
green and grey codes. This points out that one hun-
dred of clean measures are not required in order to
provide a stable set of measures, e.g. which stan-
dard deviation is low. Effectively, it shows that stan-
dard deviations range between 10% and 15% from the
twentieth one. It leads us to fix an absolute threshold
of at least 25 clean measures which standard deviation
is less than 10%. The measure set of a given code is
stated mature if and only if it matches these two con-
straints.
6 RESULT ANALYSIS
Results are presented both in the table 5 as well as in
the table 1. The latter contains the energy model de-
fined in the section 3.2 for the twenty Java best prac-
tices described int the section 3.3. Data of the table 5
are build on those of the table 1 as, firstly, it reminds
the energy consumed at runtime by the green code and
the grey one and, secondly, it computes the following
two indicators:
Absolute Gain. This consists in the difference be-
tween the grey code energy and that of the green
code. A positive absolute gain means that the best
coding practice could be stated as an eco-design
SMARTGREENS2014-3rdInternationalConferenceonSmartGridsandGreenITSystems
242

Java Best Coding Practices
Green Energy
Grey Energy
Absolute Gain
Relative Gain
Prefer integer loop counters 82 98 16 16.32%
Avoid method loop conditions 8376 8602 226 2.62%
Prefer comparison-to-0 conditions 89 284 195 68.66%
Prefer first common condition 97 100 3 3.00%
Prefer string literal initialization 697 7885 7188 91.16%
Prefer float literal initialization 10311 10448 137 1.31%
Prefer integer literal initialization 685 9575 8890 92.54%
Prefer boolean literal initialization 683 6267 5584 89.10%
Prefer char literal initialization 695 33067 32372 97.89%
Prefer double literal initialization 10003 10210 207 2.02%
Prefer long literal initialization 669 8236 7567 91.87%
Prefer short literal initialization 680 7819 7139 91.30%
Prefer StringBuffer capacity initialization 593 1053 460 43.68%
Set StringBuffer capacity 598 1053 455 43.20%
Set StringBuffer length 1211 1053 -158 -15.00%
Prefer StringBuilder capacity initialization 378 899 521 57.95%
Set StringBuilder capacity 429 899 470 52.28%
Set StringBuilder length 1043 899 -144 -16.01%
Prefer integer primitives than wrappers 1009 3357 2348 69.94%
Prefer float primitives than wrappers 1048 3449 2401 69.61%
Figure 5: Energy Gains of Java Best Coding Practices.
practice whereas negative absolute gain should
not appear.
Relative Gain. This is the rate between the previous
absolute gain and the grey code energy. It cor-
responds to the proportion of energy that can be
saved in applying the best coding practice.
The latter represents eco-design indicators and have
to be handle separately. In fact, a best practice which
relative gain is low but which absolute one is conse-
quent could truly leverage down energy consumption
of a software in which there are a lot of occurrences
that this best practice is not applied at all. In the oppo-
site, a best practice which relative gain is high could
not have a major influence on energy consumption of
a software in which this best practice is applied only
a few times. This leads us to manage these two indi-
cators separately.
These results that are commented below should all
present gains because these best practices have been
selected as they claim to improve efficiency in time
or memory and therefore in energy. Moreover, these
results can be trusted as no code standard deviation
exceeds 10%. However, as it can be noticed, some re-
sults are not always positive. In such cases, it couldn’t
be state that the involved best practice should be ig-
nore or avoid: it could mean that our implementation
of this best practice is wrong. In the opposite, best
practices with positive gains can be declared as eco-
design rules as it has been proved that one of its possi-
ble implements generates gains in a concrete environ-
ment. The following lessons can be drawn out from
the analysis of these twenty rules, group by group:
Rules About Loops. Loops with a condition to zero
generate substantial gains. Moreover, it is prefer-
able to iterate using integer counters than float ones.
The rule that states to avoid methods in loop con-
dition statements should be specified because the
test method has no parameters and we suppose that
the Java virtual machine optimized tests in loops.
The Java virtual machine should also have optimized
codes of the rule which states that it is preferable to
place the most common condition in the first place in-
side loop condition statements.
Rules about Literal Initialization. For most of the
Java types, it is better to initialize objects with literal
values than new objects. However, rules for the Java
types float and double involve that no gains. This
could due to an sort of JVM optimization for the
floating-point unit. For these, it is interesting to ob-
serve that their green codes takes more time to run
than the grey ones, memory footprints are exactly the
same; nevertheless these rules still generate energy
savings!
HowGreenAreJavaBestCodingPractices?
243

Table 1: Energy Measure Results of Java Best Coding Practices.
Java Best Coding Practices
Green Energy
Grey Energy
Green Time
Grey Time
Green Memory
Grey Memory
Green StdDev
Grey StdDev
Prefer integer loop counters 82 98 4744 5931 16 16 8.66% 7.46%
Avoid method loop conditions 8376 8602 6181 6364 20056 20056 3.83% 6.14%
Prefer comparison-to-0 conditions 89 284 4709 17367 16 16 5.09% 5.78%
Prefer first common condition 97 100 4934 5017 16 16 4.37% 4.60%
Prefer string literal initialization 697 7885 842 7827 4136 36104 4.40% 8.14%
Prefer float literal initialization 10311 10448 4736 4127 20032 20032 5.85% 6.58%
Prefer integer literal initialization 685 9575 833 4591 4048 20032 5.21% 6.51%
Prefer boolean literal initialization 683 6267 775 4741 4048 20032 4.77% 7.03%
Prefer char literal initialization 695 33067 840 4595 4048 20032 5.04% 4.65%
Prefer double literal initialization 10003 10210 5810 4270 28032 28032 5.58% 7.83%
Prefer long literal initialization 669 8236 807 6066 4056 28032 2.89% 5.32%
Prefer short literal initialization 680 7819 819 3846 4048 20031 4.87% 7.71%
Prefer StringBuffer capacity initialization 593 1053 38085 59111 52056 73784 7.11% 8.40%
Set StringBuffer capacity 598 1053 38495 59111 52056 73784 7.86% 8.40%
Set StringBuffer length 1211 1053 70765 59111 104064 73784 9.40% 8.40%
Prefer StringBuilder capacity initialization 378 899 19278 41088 52056 73784 8.27% 7.18%
Set StringBuilder capacity 429 899 20976 41088 52056 73784 6.01% 7.18%
Set StringBuilder length 1043 899 20976 41088 104064 73784 6.01% 7.18%
Prefer integer primitives than wrappers 1009 3357 70198 144021 608 1472 4.83% 8.48%
Prefer float primitives than wrappers 1048 3449 71636 133655 608 1472 4.48% 8.21%
SMARTGREENS2014-3rdInternationalConferenceonSmartGridsandGreenITSystems
244

Rules about String Buffers and Builders. It is
preferable to ensure the capacity of string buffers or
string builders either while initializing such objects
with the corresponding parameter or by calling the ap-
propriate method. Absolute and relative gains are so
close enough to corroborate the fact that such struc-
ture constructors ensure the capacity of strings. How-
ever, it is not recommended to set the length of string
buffers or string builders as it just modify an inter-
nal field of such structures without allocating mem-
ory space. Effectively, the ensureCapacity method is
used to allocate memory space of strings whereas the
setLiength method is for shorten the size of already
allocated strings.
Rules About Primitive Types and Wrappers. If it
is possible, it is preferable to manage primitive types
than wrappers. However, this rule should be com-
pleted with other ones. In fact, once codes deal with
collections, Java virtual machines automatically casts
primitives types into wrappers as collections require
wrappers. This is called auto-boxing and it also con-
sumes energy; furthermore much more energy than
directly using wrappers in collections.
7 CONCLUSION
This document investigates how to qualify energetic
relevance of Java best coding practices. This has been
achieved, firstly, using a formalism of best coding
practices which semantics consists in the comparison
between a model code of this best practice (the green
code) and another as the opposite of the model code.
Secondly, this has also been achieved using an orig-
inal and robust hybrid sensor system for estimating
time, memory and energy required by a code imple-
mentation. This has lead us to these silent conclu-
sions: there is no need to carry out numerous mea-
surement operations for to obtain a consistent mea-
sure set.
This work leads us to improve, firstly, our mea-
surement platform and, secondly, our measurement
protocol, these two perspectives with the aim to de-
velop an energy model programs. Our current plat-
form is the result of a bottom-up approach which
aims at producing measures by the means of a pre-
determined set of sensors. We plan to develop a new
platform from a top-down approach and focused on
analysis along these axis: the hardware architecture,
the operating system, the programming language , the
runtime environment, the type of measure, the type of
sensor and obviously the analyzed code. Such a plat-
form would make possible to elaborate energy mod-
els of programs in different programming languages,
in different runtime environneents. For example, the
energy model a FOR loop should depend on the num-
ber of iterated items, the type of these items and the
complexity of the loop body. Such a goal requires de-
signing much more sophisticated measure protocols
than simple comparisons as it is currently the case.
ACKNOWLEDGEMENTS
This work is partially funded by the Pays-de-la-Loire
Regional Council through the research project Code
Vert (http://www.code-vert.org) 2012-2014.
REFERENCES
Bloch, J. (2008). Effective Java. The Java series. Pearson
Education.
Boudon, A. (2013). Power API: Library API
to monitor energy spent at the process-level.
http://abourdon.github.io/powerapi-akka.
Douglas, D. H. and Peucker, T. K. (1973). Algorithms for
the reduction of the number of points required to rep-
resent a digitized line or its caricature. 10(2):112–122.
Fleiss, J. L. (1981). Statistical Methods for Rates and Pro-
portions. Wiley, John and Sons, Incorporated, New
York, N.Y.
Garrett, M. (2007). Powering down. ACM Queue, 5(7):16–
21.
Koskela, L. (2013). Effective Unit Testing: A Guide for Java
Developers. Running Series. Manning Publications
Company.
Lafond, S. and Lilius, J. (2006). An energy consumption
model for an embedded java virtual machine. In Ar-
chitecture of Computing Systems - ARCS 2006, 19th
International Conference, Frankfurt/Main, Germany,
March 13-16, 2006, Proceedings, volume 3894 of
Lecture Notes in Computer Science, pages 311–325.
Springer.
Noureddine, A., Bourdon, A., Rouvoy, R., and Seinturier,
L. (2012a). A preliminary study of the impact of soft-
ware engineering on greenit. In Green and Sustain-
able Software (GREENS), 2012 First International
Workshop on, pages 21–27. IEEE.
Noureddine, A., Bourdon, A., Rouvoy, R., and Seinturier,
L. (2012b). Runtime monitoring of software energy
hotspots. In Automated Software Engineering (ASE),
2012 Proceedings of the 27th IEEE/ACM Interna-
tional Conference on, pages 160–169. IEEE.
Poess, M. and Nambiar, R. O. (2008). Energy cost, the key
challenge of today’s data centers: a power consump-
tion analysis of tpc-c results. Proceedings of the Very
Large Ddata Bases endowment, 1(2):1229–1240.
Saxe, E. (2010). Power-efficient software. ACM Queue,
8(1):10.
HowGreenAreJavaBestCodingPractices?
245

Seo, C., Malek, S., and Medvidovic, N. (2007). An
energy consumption framework for distributed java-
based systems. In 22nd IEEE/ACM International
Conference on Automated Software Engineering (ASE
2007), November 5-9, 2007, Atlanta, Georgia, USA,
pages 421–424. ACM.
Sestoft, P. (2005). Java Precisely. MIT Press.
Tsirogiannis, D., Harizopoulos, S., and Shah, M. A. (2010).
Analyzing the energy efficiency of a database server.
In Proceedings of the ACM SIGMOD International
Conference on Management of Data, SIGMOD 2010,
Indianapolis, Indiana, USA, June 6-10, 2010, pages
231–242. ACM.
van de Ven, A. and Accardi, K. (2013). PowerTOP: a Linux
tool to diagnose issues with power consumption and
power management. https://01.org/powertop.
Webb, M. (2008). Smart 2020 enabling the low carbon
economy in the information age.
Wilke, C., Gtz, S., Cech, S., Waltsgott, J., and Fritzsche,
R. (2011a). Aspects of softwares energy consump-
tion. Technical Report TUD-FI11-04, ISSN 1430-
211X, Technische Universitt Dresden.
Wilke, C., Gtz, S., Reimann, J., and Assmann, U. (2011b).
Vision paper: Towards model-based energy testing.
In Proceedings of 14th International Conference on
Model Driven Engineering Languages and Systems
(MODELS 2011).
Wilke, C., Gtz, S., and Richly, S. (2013). Joule-
Unit A Generic Framework for Software En-
ergy Profiling and Testing. In Software Engi-
neering Green By Software Engineering Workshop.
lhttp://code.google.com/p/jouleunit.
Wilke, C., Richly, S., Pschel, G., Piechnick, C., Gtz, S., and
Amann, U. (2012). Energy labels for mobile applica-
tions. In Workshop zur Entwicklung Energiebewusster
Software, EEbS 2012.
Witten, I. H., Frank, E., and Hall, M. A. (2011). Data
Mining: Practical Machine Learning Tools and Tech-
niques. Morgan Kaufmann, 3 edition.
SMARTGREENS2014-3rdInternationalConferenceonSmartGridsandGreenITSystems
246
