
Does the Audience Hear My Heart?
Comparing the Physiological Responses of Listeners with Those of the Composer
Benjamin Luke Evans, Nagisa Munekata and Tetsuo Ono
Graduate School of Information Science, Hokkaido University, N14-W9 Kita-ku, Sapporo, Hokkaido 060-0814, Japan
Keywords: Music, Composer Intention, Listener Impression, Skin Conductance Response, Skin Conductance Level,
Finger Tip Temperature.
Abstract: Based on the assumption that composers compose with specific “intentions” in mind, we have conducted
experiments to compare the “impressions” perceived by individual listeners with those “intentions” of the
composer. We recorded physiological signals (skin conductance and finger tip temperature) of both the
composer and listeners as they listened to the same music. Listener data was then cumulated and averaged
for each song and compared to the data of the composer. Overall tendencies in physiological data, as well as
a separate survey taken regarding emotions conveyed in the music, showed similarities between composer
“intentions” and listener “impressions”, indicating positive possibilities for using physiological data as an
objective index of composers in future studies.
1 INTRODUCTION
Musical pieces abound everywhere we turn in
society today. They exist as entertainment at concert
halls and in movies, as public announcements at
shopping malls, as an indicator on home appliances
and even as apps in our mobile phones. The modern
world is certainly no longer a quiet world.
Every musical piece or jingle we hear was
designed by someone, with the intention of
conveying something to those who hear it. It may be
an emotion that it seeks to evoke to highlight a scene
in a movie, or perhaps a warning to cause concern
about an error in a computer system. A composer’s
intention could be either a concrete message or an
abstract emotion.
Empirical study of emotion conveyed through
music has been pursued for more than a hundred
years (MacDorman, 2007). However, hardly any
research has been done to evaluate the emotional
intentions of the composer behind music. Although
musical intention is a topic discussed in musical
aesthetics, most of those studies deal with the
intentions of composers who lived many years ago,
making it nigh on impossible to obtain objective
information regarding what those composers were
intending when composing their music.
Physiological data has been widely used as an
indicator for listener impressions to music, though it
is still uncertain what exactly listeners are
responding to. It may be caused by emphatic
resonance with the song, directly induced by the
music, caused by memories reflected upon during
the music, etc. We have incorporated physiological
analyses of composer data into our research to test
the grounds for using it as an indicator of composer
intention in future research.
The aim of this research is to record objective
data of the composer and listeners, and to see what
correlation can be drawn between the two. We
recorded physiological data of the two parties
listening to the same music and have conducted
preliminary comparisons of the between-subject data.
Contrasting this with data gained from surveys, we
have listed some noticeable attributes of both
composer intention and listener impression, and
have concluded this paper with some points of
discussion for further research in this area.
2 RELATED WORK
2.1 Music and Physiological Data
Much research has been done regarding the
physiological responses listeners feel towards the
music they listen to. Nakamura found a correlation
161
Luke Evans B., Munekata N. and Ono T..
Does the Audience Hear My Heart? - Comparing the Physiological Responses of Listeners with Those of the Composer.
DOI: 10.5220/0004810301610166
In Proceedings of the International Conference on Physiological Computing Systems (PhyCS-2014), pages 161-166
ISBN: 978-989-758-006-2
Copyright
c
2014 SCITEPRESS (Science and Technology Publications, Lda.)

between the impressions of the listeners and their
skin conductance response (SCR, also known as
GSR: galvanic skin response) while they were
listening to music (Nakamura, 1984). Rickard also
found significant differences in SCR change, as well
as the number of chills listeners would experience,
when listening to different types of music (Rickard,
2004). Matsui et al. found statistical difference in
levels of arousal and variance in the number of
breaths of the listeners when using multiple varied
arrangements of the same original song (Matsui,
2003). Van der Zwaag et al. investigated the
emotional impact pop and rock songs had on
listeners while conducting a typical office task (Van
der Zwaag, 2011). They found SCR to increase with
the percussiveness of the music. They also noticed
physiological responses reveal patterns that may not
have been revealed in the self-reports of participants.
As far as we know, no research has dealt directly
with the physiological data of composers. We
believe this is due to the difficulty of obtaining
objective data regarding a composer, since composer
data for classical songs are hard to obtain and
copyright regulations prohibit research from using
music and data from more recent composers. In this
research, we have used music written by one of the
authors, which has allowed us some freedom into
investigating composer intention and considering
whether physiological data is usable as an indicator
of that intention.
2.2 Composer Intentions in Music
Previous research dealing with the emotions
conveyed through music can be split into two basic
categories: research on the impressions of listeners
and research on the emotions listeners think the
music is intended to convey (Nakamura, 1983). Not
much research has been done on the intentions of the
composer, nor on the relation those have with the
impressions of the listener. The few studies that have
been conducted in these areas are as follows.
Baraldi had performers play a single note on a
MIDI (Musical Instrument Digital Interface) piano
and compared their intended emotions with the
impressions of the listeners (Baraldi, 2006). Weale,
using Electroacoustic Music, evaluated the listening
experiences of listeners as they were gradually given
more and more information regarding the song, the
composer and the intentions of the composer (Weale,
2006).
3 PHYSIOLOGICAL DATA AND
EXPERIMENTAL EQUIPMENT
In this research, we measured three types of
physiological data from both composer and listeners.
They are skin conductance response (SCR), skin
conductance level (SCL) and finger tip temperature
(FTT). All three of these represent peripheral
functions of the sympathetic nervous system and are
known to have an intimate relation with emotional
states. In particular, previous research has found skin
conductance to be a good indicator of strong
impressions as a response to music (Rickard, 2004)
and also as an indicator of anxiety (Mauri, 2010).
SCR signals indicate rapid change in skin
conductance and are used to measure transitory
excitement. To measure SCR, we used an original
measuring device developed in our previous work
(Munekata, 2006) which incorporates circuitry by
Fowles (Fowles, 1981). Acquired analogical data is
converted to a digital signal (8bit, sampling rate
20Hz) and sent to a computer via optical cables.
SCL signals indicate gradual change in skin
conductance and are used to measure transitions
from equilibrium to states of stimulation. SCL was
measured using a device we are currently co-
developing with Asahi Kasei Corporation. SCL data
is acquired as a digital signal (16bit, sampling rate
20Hz) and transferred to a computer using Bluetooth
transmission. We have provided an example of a
typical signal trace in Figure 1.
Figure 1: Typical signal trace of SCR and SCL.
FTT has been used to monitor if a person is relaxed
or not (Shivakumar, 2012). For our experiments, we
used an original device which includes a
thermocouple and original circuitry to measure FTT.
The device measures temperatures between 21 and
38 degree Celsius in increments of 0.0667 degrees.
Data is transmitted to a computer digitally (8bit,
sampling rate 20Hz) using Bluetooth transmission.
PhyCS2014-InternationalConferenceonPhysiologicalComputingSystems
162

4 EXPERIMENTS
4.1 Description of Songs
We chose four songs from those which Evans
(author) had written/arranged and performed at least
12 months prior to these experiments. Each song
was submitted as an mp3 audio file, converted from
standard MIDI files of the original sheet music used
in the performances. Each song was rearranged as an
instrumental piece with no lyrics included.
In a preliminary experiment, participants
reported an initial nervousness at the beginning of
the experiment, mostly due to being attached to
multiple physiological response-measuring devices.
We therefore decided to play two songs in each
experiment, always starting with a stabiliser song.
Data from the second songs (A and B) only will be
analysed.
Song A was written in C minor, in 8/12 time, and
as a piano solo piece. Partway through, song A
would modulate to E flat major, but would modulate
back to C minor for the conclusion of the song. Song
B was also written in 8/12 time, but in B flat major,
and as a capella piece. Song A was made using the
MIDI sound “Steinway Piano”, while song B used
“Choir Ahs”.
4.2 Listener Experiment
Fourteen faculty and students (two females, twelve
males) from the information engineering department
of Hokkaido University, Japan, participated in a two
day experiment. All participants were naïve to the
purpose of the experiment, including the fact that
one of the experimenters was also the composer of
the songs they were to listen to.
Participants were lead to the experiment room
where they received an explanation of the
experiment procedure. The room was dimly lit and
kept at a constant comfortable temperature
throughout the experiment. Participants were then
attached to the physiological measurement devices
explained in section three. Audio-Technica noise
cancelling headphones were placed on the
participants’ heads, and after a brief volume check, a
list of sounds and songs were played. After all
sounds were played, the experimenter removed the
headphones and all measurement devices.
Participants were then asked to complete a survey
regarding the impressions they had of the final song
played.
The list of songs was as follows. First,
participants listened to ambient forest sounds for a
minute. Second, they listened to a stabilizer song.
Third, participants listened again to the same
ambient forest sounds, and fourth, participants
listened to either song A or B. All participants
listened to all four songs produced by the composer
over the two days of experiments. Participants heard
songs A and B in a counter-balanced order across
sessions.
In the survey, participants were given a set of
nine emotions to be evaluated in a five-point Likert-
type scale ranging from ‘not at all’ to ‘extremely’
regarding the impressions they had of the last song
they had heard in the experiment (song A or B).
Many emotion sets have been studied and used in
the research fields of both psychology and
musicology. In this research, we have used the
emotion set compiled by Bruner (Bruner, 1990)
from more than 30 experiments, and in particular,
seven related works by other researchers regarding
music and marketing. Bruner also compiled a list of
musical characteristics researchers have found
associated to each of those emotions, as can be seen
in Table 1.
4.3 Composer Experiment
Prior to our experiment with listeners, the composer
also answered a similar survey to listeners regarding
the intentions he had when composing songs A and
B. We also measured the physiological responses of
the composer as he listened to the two songs in a two
day experiment identical to that of the listeners. The
composer did not listen to the songs or sound files
for at least a month before the experiment. In the
Table 1: Musical Characteristics for Producing Various Emotional Expressions (Bruner, 1990).
DoestheAudienceHearMyHeart?-ComparingthePhysiologicalResponsesofListenerswithThoseoftheComposer
163
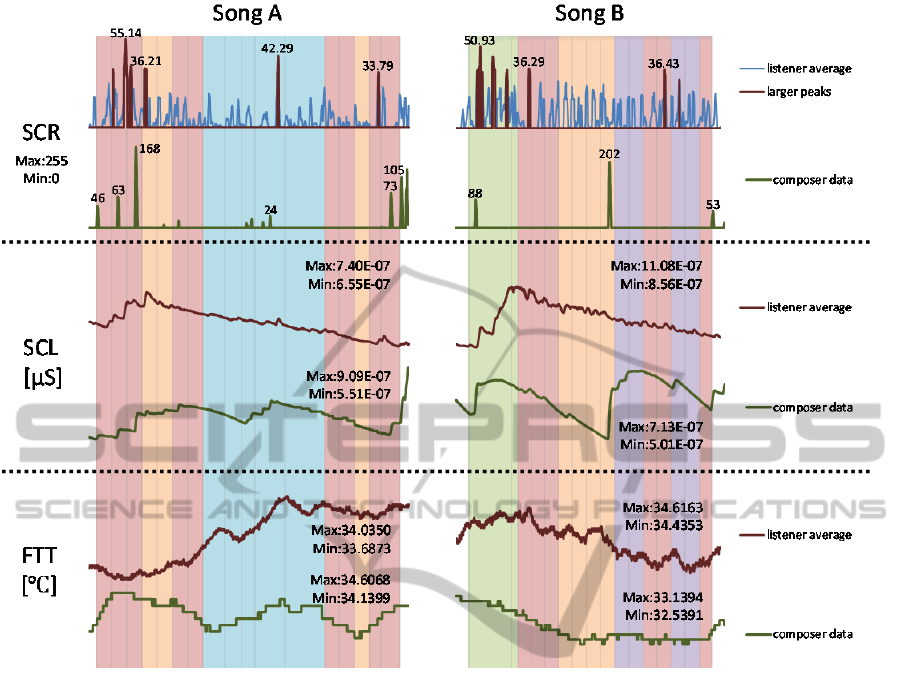
Figure 2: Physiological data acquired from experiments of listeners (n=14) and composer.
experiment, the composer was to focus on the music
itself and not the performance for which he had
originally composed the music.
5 RESULTS
5.1 Physiological Data
Each individual is known to have different baselines
for each of their physiological status. Their
responses can also differ widely in both magnitude
and frequency. In this research, we chose to compare
the general responses of listeners with those of the
composer by cumulating and averaging the
physiological data acquired from participants for
each song (figure 2).
Coloured shadings behind each graph of figure 2
correspond to the structure of the song being played.
Red, orange and purple represent the main melody,
an arranged version of the main melody and a
second main melody respectively. The blue area of
song A indicates the modulated portion of the song
where the melody is in a major key. The green area
of song B indicates the introduction for the song.
Gray vertical lines represent boundaries of musical
phrases identified by the composer. Below we have
listed some noticeable characteristics from these
graphs regarding both listener and composer data.
We first notice a uniform trend between the two
songs regarding skin conductance data. SCR figures
are high for both songs roughly ten to twenty
seconds after the song has begun, and right before
the song ends. SCL figures begin to decrease right
around the first major change in melody, which, in
the case of song B, is also the end of the introduction.
The composer shows a uniform response to both
songs in the change of SCL. The composer’s skin
conductance changed greatly at the beginning,
ending and centre of each song. The rise in skin
conductance observed in the middle of song B,
though, cannot be seen in the listeners’ response.
When looking at FTT, we notice the listeners’
temperature rises for song A, but decreases for song
PhyCS2014-InternationalConferenceonPhysiologicalComputingSystems
164
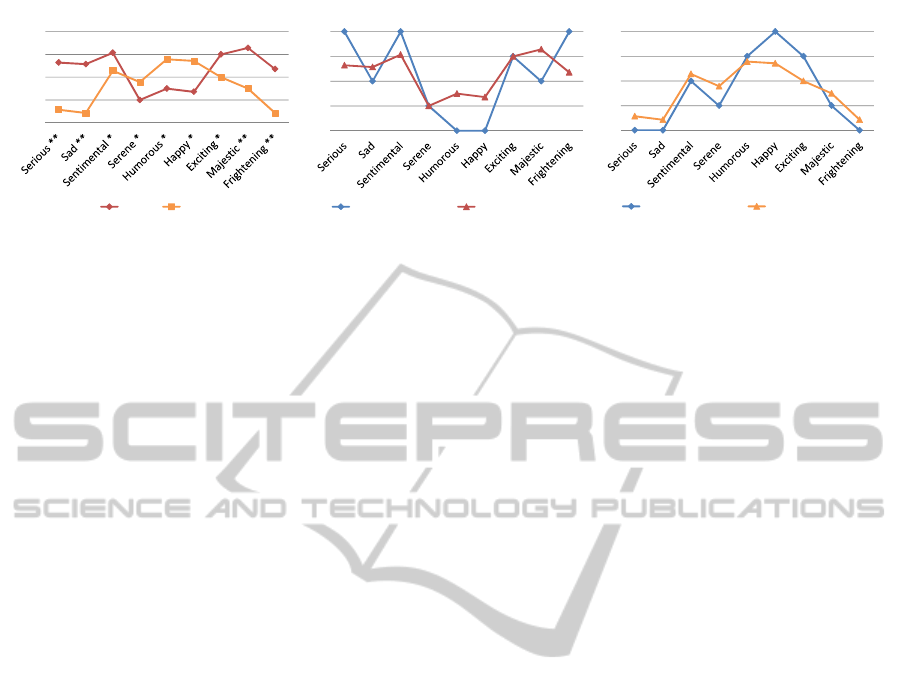
Figure 3: Survey results regarding composer intention and average of listener impressions (* p<0.5, ** p<0.1).
B. The rise during the modulated part of song A is
particularly noticeable. The composer’s FTT does
not rise as much throughout the whole duration of
song A, but does change in a similar way to listeners’
from the modulated part of the song, through to the
end of the song. The composer’s FTT decreases for
song B in a similar way to the listeners’ temperature.
5.2 Survey Data
A One-way ANOVA of the emotional values
evaluated in the survey revealed a significant
difference between songs A and B for all nine
emotions. This difference was most significant for
emotions ‘Serious’ (F(1,13) = 29.00, p < 0.01), ‘Sad’
(F(1,13) = 71.34, p < 0.01), ‘Majestic’ (F(1,13) =
31.61, p < 0.01) and ‘Frightening’ (F(1,13) = 20.56,
p < 0.01). This indicates participants received a
significantly different overall impression of the two
songs in regards to emotions conveyed by the songs.
Also, a similarity in the emotional evaluation of
listeners and composer can be noticed, as seen in
figure 3. Both composer and listeners have evaluated
song A in an overall convex manner and song B in a
concave manner. This would indicate the
composer’s overall intentions behind songs A and B
were, for the most part, successfully conveyed to the
listeners.
6 DISCUSSIONS
Despite the fact that the span of this experiment
covered music by only one composer, and was
analysed by only a small group of listeners, the
parallelisms between composer intention and listener
impressions (as seen in the data of figures 2 and 3)
do give us multiple aspects of this research we
would like to further investigate.
The first thing we notice is how the FTT of
listeners and composer decreases throughout song B.
This, combined with the fact that there is a
consistent change in listener SCR throughout the
song, implies that there is a constant stimulus in
song B causing some sort of tension throughout the
whole song. Analyses of the rhythms in song B
show that the melody is heavily syncopated, with 35
out of 63 bars of music containing some sort of
syncopation; mostly missed-beat syncopations, but
in some cases suspensions across beats. Syncopation
is widely used as a means of generating musical
tension, but these results may indicate they cause
physiological tension in listeners also.
Another noticeable characteristic is how skin
conductance figures rise during the initial phrases of
both songs. Both composer and listeners show SCR
responses at the beginning of each song. This could
imply there is a uniform excitement (or anticipation)
among listeners regarding songs they are about to
listen to. This excitement/anticipation may be either
a conscious or subconscious response to the music
depending on the person.
It is also interesting to note how participant SCL
has peaked right at the first major change in melody
for both songs. The descent of SCL for the
remainder of the song would indicate listeners were
generally more relaxed once they got accustomed to
the song, and it was individual musical events, not
the song as a whole, which would later cause
physiological responses in the listeners.
The changes noticeable in physiological data
during the modulated part of song A has left much
room for speculation. Overall, FTT has risen in this
section of the music for both listeners and composer.
The difference in temperature change of listeners is
particularly noticeable when compared to the
slightly concave graph structure in the first and last
parts of the song. It is uncertain at this point whether
this change in temperature pattern is due to the
change in the musical mode (major and minor), or
due to the change in melody structure and thus
deserves further investigation.
1
2
3
4
5
SongB
ComposerIntention ListenerImpression
1
2
3
4
5
SongA
ComposerIntention ListenerImpression
1
2
3
4
5
ListenerImpressions
SongA SongB
DoestheAudienceHearMyHeart?-ComparingthePhysiologicalResponsesofListenerswithThoseoftheComposer
165

7 CONCLUSIONS
In this research, we have taken physiological data of
both composer and listeners listening to the same
music. We also had listeners evaluate their
impressions of the music using an emotion set
derived by Bruner, and compared that to the
evaluation of intended emotions by the composer.
Both physiological data and survey data show some
correlation between that of the composer and listener
averages, suggesting composer intentions are, to a
degree, successfully conveyed through music.
A distinctive point of our research is that we
have taken the concept of composer “intention”, a
concept similar to that which one will find in
musical aesthetics, and have tested the grounds for
investigating it in light of physiology and
musicology. That is why in this paper we have
focused mainly on the structure, or form, of attained
data and have not done many detailed analyses. We
have laid out some outstanding observations from
the data, but have limited attributing musical and
psychophysiological opinions to these observations.
We will now take our findings from these
experiments and structure more specific plans for
future research. Recruiting multiple composers will
be necessary in forming general models of composer
intention and also finding concrete relations between
those intentions and listener impressions. Musical
variables, such as melody and rhythm structure, will
need to be controlled in order to find distinct musical
attributes, if any, that affect the relation of composer
intentions and listener impressions. Finally,
evaluation of individual’s physiological data would
be worthy of future investigation also, as it may shed
light on the diverse listening preferences and habits
of listeners, giving composers insight into the
audience of their music.
REFERENCES
Baraldi, F. B., de Poli, G., Roda A., 2006. Communicating
Expressive Intentions with a Single Piano Note. In
Journal of New Music Research, Vol.35, No.3,
pp.197-210., The Society for Psychophysiological
Research, inc.
Bruner, G. C. II, 1990. Music, Mood and Marketing. In
Journal of marketing, Vol.54, No.4, pp.94-104.
Proquest Research Library.
Fowles, D. C., Christie, M. J., Edelberg R., Grings, W. W.,
Lykken, D. T., Venables, P. H., 1981. Publication
Recommendations for Electrodermal Measurements.
Committee Report in Psychophysiology, Vol.18, No.3,
pp.232-239., Routledge.
MacDorman, K. F., 2007. Automatic Emotion Prediction
of Song Excerpts: Index Construction, Algorithm
Design, and Empirical Comparison. In Journal of New
Music Research, Vol.36, No.4, pp.281-299.
Routledge.
Matsui, K., Kawai, J., Sawamura, K., Obara, M.,
Matsumoto, K., 2003. Physiological and Psychological
Reaserch regarding Somatological Responses to
Musical Stimuli (In Japanese). In Journal of Clinical
and Educational Psychology, Vol.29, No.1, pp.43-57.
Kwansei Gakuin University.
Mauri, M., et al., 2010, Psychophysiological signals
associated with affective states. In Proceedings of the
32
nd
Annual International Conference of the IEEE
EMBS, pp.3563-3566.
Munekata, N., Yoshida, N., Sakurazawa, S., Tsukahara, Y.,
and Matsubara, H., 2006. Design of Positive
Biofeedback Using a Robot’s Behaviors as Motion
Media. In Proceedings of the 5
th
international
conference on Entertainment Computing –ICEC’06,
pp.340-349. International Federation for Information
Processing.
Nakamura, H., 1983. The relationship between ratings of
the emotional characters of musics and the emotions
aroused by them. In The Japanese Journal of
Psychology, Vol.54, No.1, pp.54-57.
Nakamura, H., 1984. Effects of musical emotionality upon
GSR and respiration rate: The relationship between
verbal reports and physiological responses. In The
Japanese Journal of Psychology, Vol.55, No.1, pp.47-
50.
Rickard, N. S., 2004. Intense emotional responses to
music: a test of the physiological arousal hypothesis.
In Psychology of Music, Vol.32, No.4, pp.371-388.
Society for Education, Music and Psychology
Research.
Shivakumar, G., Vijaya, P. A., 2012. Emotion Recognition
Using Finger Tip Temperature: First Step towards and
Automatic System. In International Journal of
Computer and Electrical Engineering, Vol.4, No.3,
pp.252-255.
Van der Zwaag, M. D., 2011. Emotional and
psychophysiological responses to tempo, mode, and
percussiveness. In Musicae Scientiae, Vol.15, No.2,
pp.250-269. Sage.
Weale, R., 2006. Discovering How Accessible
Electroacoustic Music Can Be: the
Intention/Reception project. In Organised Sound,
Vol.32, No.4, pp.371-388. Society for Education,
Music and Psychology Research.
PhyCS2014-InternationalConferenceonPhysiologicalComputingSystems
166
