
A Supply Chain Strategy Management Model for Small and
Medium Sized Enterprises
Madani Alomar and Z. J. Pasek
Industrial and Manufacturing Systems Engineering, University of Windsor, Windsor, Canada
Keywords: Small and Medium-Sized Enterprises, AHP, SCOR Model, Supply Chain Strategy, Performance Measurement
System, Dynamic Strategy.
Abstract: This paper proposes a model that will assist companies, particularly the small and medium-sized enterprises,
assess their performance by prioritizing performance measures and selecting an adequate operations strategy
under various market scenarios. The outlined model utilizes and integrates the Supply Chain Operations
Reference framework and the Analytical Hierarchy Process approach to construct, link, and assess a four level
hierarchal structure. The model also helps small and medium-sized enterprises put more emphasis on supply
chain operations and management. The use and benefits of the proposed model are illustrated on a case of a
family owned, medium-sized manufacturing company.
1 INTRODUCTION
Manufacturers today are faced with complex global
challenges such as low cost competitors, fluctuating
commodity prices, increasing customer expectations,
and volatile economic conditions. The uncertainty
associated with these factors has contributed on one
hand to significant changes in the business
environment resulting in tremendous growth and
opportunities for new markets, and on the other hand
in increased frequency and complexity of challenges
that threaten the operations and survival of firms.
These competitive pressures are driving manufacturing
firms to continuously re-evaluate and adjust their
competitive strategies, supply chains, and
manufacturing technologies in order to improve
performance, compete, and survive long- term.
Small and medium-sized enterprises (SMEs) are
much more vulnerable to these external pressures than
larger companies, thus their responses often fall short,
due to limited resources and capabilities (e.g.,
financial resources, managerial talent, and access to
markets)
Numerous studies have revealed that Small
businesses are extremely susceptible to failures; about
50% of small businesses in Canada and 53% in the
United States fail to survive for more than five years
(Branch, 2012) Several research studies have linked
the success of businesses to the type of performance
measurement system (PMS) used by the firms and to
the successful design and implementation. Other
researchers have considered strategic performance
measurement system as a means to attain competitive
advantage, continuous improvement and ability to
successfully manage changes (Holban, 2009; Cocca
and Alberti, 2009). Despite these results, several
investigators found that many small enterprises
predominantly emphasize financial index only
(Hudson et al., 2001; Hvolby and Thorstenson, 2001;
Gosselin, 2005), neglecting the others.
This paper proposes an approach methodology and
a model that will assist SMEs in building a strategic
and dynamic performance measurement system that
considers two types of supply chain strategies, and the
supply chain performance attributes based on Supply
Chain Operations Reference (SCOR) framework. The
model relies on Analytical Hierarchy Process (AHP)
approach to integrate various market scenarios,
performance attributes and supply chain strategies into
one comprehensive model. Unlike other previous
works where the use of AHP and performance
measures were mainly addressing the selection of best
supplier, vendors, markets or manufacturing
departments, this work discusses the improvement of
one enterprise performance under different market
circumstances and the importance of different
performance measures.
46
Alomar M. and Pasek Z..
A Supply Chain Strategy Management Model for Small and Medium Sized Enterprises.
DOI: 10.5220/0004813700460056
In Proceedings of the 3rd International Conference on Operations Research and Enterprise Systems (ICORES-2014), pages 46-56
ISBN: 978-989-758-017-8
Copyright
c
2014 SCITEPRESS (Science and Technology Publications, Lda.)

2 PERFORMANCE
MEASURMENT SYSTEMS IN
SMES
Performance measurement is at the core of a control
and management system of an enterprise. It plays a
key role in developing strategic plans and assessing
organizational objectives. It is also important in
assessing business ability to gain and sustain
competitive advantage and directing corrective
adjustments and actions as well (Holban, 2009).
Various researchers have linked the success of
businesses to the type of performance measurement
system used by them and to the successful design and
implementation of the measurement system. Other
researchers have considered strategic performance
measurement system as means to attain competitive
advantage, continuous improvement and ability to
respond to internal and external changes (Cocca and
Alberti, 2009).
In this sense, the performance measurement system
is the instrument to support the decision-making either
for launching, selecting actions or redefining
objectives (Bititci, 1995; Globerson, 1985; Neely,
1999). From a global perspective, performance
measurement system as a multi-criteria instrument
consists of a set of performance expressions or metrics
(Melnyk et al, 2004).
The early generations of performance measurement
models focused extensively on financial and
accounting areas and completely ignored the
operational and other non-financial issues. Currently,
the new generation of performance measurement
models makes a strong effort to be strategically
oriented and to address other performance dimensions
including combination of financial and non-financial
areas (Taticchi, Tonelli, &Cagnazzo, 2010).
Nevertheless, according to Tangen: “these new
approaches have a good academic groundwork and are
theoretically sound but they rarely help with the
practical understanding of specific measures at an
operational level”. This is considered a major obstacle
in implementing multi-dimensional performance
measurement system in small enterprises (Tangen,
2004).
Other researchers have tied the failure of
implementing existing performance measurement
systems in small and medium-sized enterprises to the
following issues:
• Use of models or frameworks originally introduced
for large enterprises, the one size fits all, leads to
implementation failure. (Taticchi et al., 2010).
• Improper use of well-known performance
measurement models and frameworks (Tenhunen,
et al., 2001).
• Informal approach to performance measurement
models and frameworks (no rigorous plan or
execution) (Chennell et al., 2005).
Numbers of studies have revealed that many of the
small and medium-sized enterprises did not achieve
the requirements of a strategic performance
measurement system. For example: (Hudson et al.,
2001) found that all companies under the study had a
surplus of financial measures, but their performance
measurement systems were not derived from strategy,
often unclear with complex or obsolete data, and
historically focused on some outdated measures.
Another empirical survey conducted on 83 Danish
enterprises (Hvolby and Thorstenson, 2001) found that
50% of these enterprises have either only one-
performance indicator such as cost or no performance
indicators in place at all. An additional empirical study
(Gosselin, 2005) revealed that majority of small and
medium sized Canadian manufacturing firms continue
using financial measures.
Despite the recommendations from industrial and
academic experts, the proportion of firms that
implement well-known performance measurement
systems remains low (Gosselin, 2005). The results
indicated that the types of performance measures used
by the SMEs were rarely connected to strategy. The
study also revealed that about 70% of the companies
failed to implement well-known strategic performance
measurement models (Gosselin, 2005). The majority
of SMEs according to the previous studies use
traditional management accounting systems.
Nevertheless, the traditional management
accounting systems and financial measures simply do
not provide the richness of information that allows a
company to remain competitive in today's market
place (Dixon et al., 1990) see also table 1. It is
necessary to understand that the metrics and the
measures that are used in performance measurement
system should have the power to capture the depth of
organizational performance, the measures should
reflect their clear relations with a range of levels of
decision-making such as strategic, tactical, and
operational, the metrics should reflect an acceptable
balance between financial and non-financial measures,
and the measurement system should ensure proper
assignment of measures to the areas where they would
be most suitable.
ASupplyChainStrategyManagementModelforSmallandMediumSizedEnterprises
47

Table 1: Traditional versus no-traditional PMS.
Traditional performance measures Non-traditional performance measures
Based on outdated traditional accounting
system
Based on company strategy
Mainly financial measures Mainly non-financial measures
Intended for middle and higher managers Intended for all employees
Lagging metrics On-time metrics
Do not vary between locations Vary between locations
Do not change over time Change overtime as the needs change
Intended mainly for monitoring performance Intended to improve performance
Not applicable for new advanced technology
and methods, JIT,TQM,FMS
Applicable for new advances technology and
methods: JIT,TQM,FMS
Ignoring continuous improvement Help in achieving continuous improvement
3 SMES AND THE CHALLENGES
Studies show that small and medium-sized enterprises
are distinguished from larger firms by a number of key
characteristics (Hudson, Lean, and Smart, 2001) such
as personalized management with little delegation of
authority, severe resource limitations in terms of
skilled manpower, management and finance, and
flexible structure, reactive or fire-fighting mentality,
informal and dynamic strategies, dependency on small
number of customers, limited markets, and high
potential to innovativeness.
These characteristics are also viewed as challenges
that influence the implementation of well-known
performance measurement systems that are designed
for larger firms in small and medium-sized enterprises
(Garengo et al., 2005).
For example, the dynamic strategy of small
business means that these businesses are more
frequently revising their decisions than the larger
firms. This greatly influences internal operations, and
the relations with customers and suppliers. Such
behaviour requires a better system of control with
higher capability to control effectively and rapidly
reflect these changes and their consequences on the
internal operations as well as the external ones. These
limitations of small manufacturing enterprises
emphasize need for a performance measurement and
control system that effectively reflects key business
operations with fewer but critical measures that are
written in form of an understandable structure, and
flexible enough to fit specific needs of each individual
enterprise and the changeable market conditions as
well.
4 ANALYTICAL HIERARCHY
PROCESS (AHP)
The Analytic Hierarchy Process (AHP), introduced in
1970 (Saaty, 2008), has become one of the most
broadly used methods for multiple criteria decision-
making (MCDM). It is a decision approach designed
to assist in the solution of complex multiple criteria
problems in a number of application areas. AHP is a
problem-solving framework, flexible, organized
method employed to represent the elements of a
compound problem, hierarchically (Chen et al., 2006).
It has been considered to be an essential tool for both
practitioners and academic researchers in organizing
and analysing complex decisions (Cheng et al., 2002).
AHP has been extensively used for selection
process such as comparing the overall performance of
manufacturing departments (Rangone, 1996),
manufacturing supply chain (Wang et al., 2005),
benchmarking logistics performance (Chan et al.,
2006), and vendor evaluation and selection (Haq and
Kannan, 2006). More researchers are realizing that
AHP is an effective technique and are applying it to
several manufacturing areas (Wang et al., 2005). AHP
has several benefits (Cheng et al., 2002).
It helps to decompose an unstructured problem into
a rational decision hierarchy.
Second, it can draw out more information from the
experts or decision makers by employing the pair-
wise comparison of individual groups of elements.
Third, it sets the computations to assign weights to
the elements.
Fourth, it uses the consistency measure to validate
the consistency of the rating from the experts and
decision makers
ICORES2014-InternationalConferenceonOperationsResearchandEnterpriseSystems
48

The AHP procedure to solve a complex problem
involves four steps:
1- Breaking down the complexity of a problem into
multiple levels and synthesizing the relations of the
components are the underlying concepts of AHP
(Cheng and Li, 2001) see figure 1.
2- Pair-wise comparison aims to determine the
relative importance of the elements in each level of
the hierarchy. It starts from the second level and
ends at the lowest. A set of comparison matrices of
all elements in a level of the hierarchy with respect
to an element of the immediately higher level are
built so as to prioritize and convert individual
comparative judgments into ratio scale
measurements. The preferences are quantified by
using a nine-point scale. The meaning of each
scale measurement is explained in table 2.
Decision maker needs to express preference
between each pair of the elements in terms of how
much more one element is important than other
element. Table 3 shows a matrix that expresses
personal judgment and preferences.
3- Relative weight calculation. After the pair-wise
comparison matrix is developed, a vector of
priorities (i.e. eigenvector) in the matrix is
calculated and is then normalized to sum to 1.0.
This is done by dividing the elements of each
column of the matrix by the sum of that column
(i.e. normalizing the column). Then, obtain the
eigenvector by adding the elements in each
resulting row to obtain a row sum, and dividing
this sum by the number of elements in the row to
obtain relative weight.
4- Consistency check. A consistency ratio (CR) is
used to measure the consistency in the pair-wise
comparison. The purpose is to ensure that the
judgments of decision makers are consistent. For
example, when using AHP technique, a
consistency ratio between factors and criteria can
be obtained by the following equation:
CR = CI/RI (1)
Where:
CI: consistency index
RI: consistency ratio based on the value of n
Checking consistency provides more information
about the accuracy of the comparison and the decision
alternatives selection. The final score of decision
alternatives can be obtained by applying the following
general equation:
∑∑
1
1
(2)
Where:
S
k
= overall decision of alternative k score
W
i
= relative weight of criteria i
w
ij
= relative weight of indicator j of criteria i
r
ijk
= rating of decision alternative k and for
indicator j of criteria i
n
i
= total number of indicators belong to criteria
Table 2: Comparison scale for the importance using AHP
grading system.
Intensity of
Importance
Definition Explanation
1
Equal
Importance
Two activities/factors
contribute equally to the
objective
3
Somewhat more
important
Experience and judgment
slightly favour one over
the other
5
Strong
importance
Experience and judgment
strongly favour one over
the other
7
Very strong
importance
Experience and judgment
very strongly favour one
over the other. Its
importance is
demonstrated in practice
9
Absolutely
extremely
important
The evidence favouring
one over the other is of the
highest possible validity
2 , 4 , 6 , 8
Intermediate
values
When compromise is
needed
Reciprocal Opposite value
When activity I has one of
the above numbers
assigned to it with activity
j, then j has the reciprocal
value when compared to I.
Source: Saaty(2008)
Table 3: Pair-wise comparison for n number of elements at
the same level.
I1 I2 I3 In
I1 1 2 4
I2 0.5 1
I3 0.25 1
In 1
5 SCOR PERFORMANCE
LEVELS AND ATTRIBUTES
Supply Chain Council (SCC) is a global non-profit
organization formed in 1996 to make and evolve a
standard industry process reference model of the
supply chain for the benefits of helping enterprises
improve supply chain operations. SCC has established
the supply chain framework- the (SCOR) process
ASupplyChainStrategyManagementModelforSmallandMediumSizedEnterprises
49

reference model- for evaluating and comparing supply
chain activities and related performance (supply-
chain.org, 2013). The SCOR model consists of
standard supply chain processes, standard performance
attributes and metrics, standard practices and standard
job skills.
SCOR model divides the supply chain attributes
into two categories: internal and customer related
attributes. The SCOR performance attributes such as:
Supply Chain Reliability, Responsiveness, and Agility
are considered as customer related attributes. Cost and
Assets management are internal attributes. The SCOR
performance section consists of two types of elements:
Performance Attributes and Performance Metrics.
A performance attribute is a combination of
characteristics used to express a strategy. However, an
attribute itself cannot be measured, it is used to set and
identify strategic direction. The metrics that are
assigned to each performance attribute measure the
ability of the supply chain to achieve these attributes.
Table 4 shows five performance attributes; two of
them (the cost and assets management) are considered
as internal-focused. Reliability, Responsiveness, and
Agility are considered as Customer-focused.
Associated with the performance attributes are the
level 1 strategic metrics. These level 1 metrics are the
calculations by which an organization can measure
how successful it is in achieving its desired position
within the competitive market.
Table 4: SCOR performance attributes and definitions.
Performance Attribute Definition
Internal
Costs: CO
The cost of operating the
supply chain processes.
Assets management:
AM
The ability to efficiently utilize
assets
Customer
Reliability: RL
The ability to perform tasks and
activates as planned or
expected. It focuses on the
outcomes of the processes
Responsiveness: RS
The speed at which tasks and
activities are performed
Agility: AG
The ability to respond to
external effects, i.e. demand
and supply uncertainties.
For example, the performance attribute supply
chain cost includes two types of costs: supply chain
management cost and cost of goods sold. Reliability
on the other hand involves only perfect order
fulfilment. Each of level one strategic metric also
divided to level 2 and 3 metrics, more information
about SCOR performance attributes can be found at
Supply Chain Council website (supply-chain.org).
However, the framework does not provide users
and practitioners with any guidelines on how to use or
where to start the evaluation that requires another tool
that simplify such a complex framework.
6 THE APPROACH
Since business conditions became more unpredictable
and unstable, manufacturing firms are required to
adjust their operations strategies in order to meet these
changes. The evaluation of the alternative supply chain
strategies; effective or responsive requires that the
performance of the strategies on agility, reliability,
responsiveness, cost, to be re-evaluated, re-prioritized,
quantified and aggregated to capture the new business
goals. However, this process is not a straightforward
task, since the performance and strategy evaluation
process depends on many factors that by nature are
interconnected and require a specific level of skill and
qualifications that mostly do not exist in many SMEs.
Successful performance measuring systems have to
satisfy and completely fulfil the following points:
The metrics used in performance measurement
systems should have the power to capture and
represent the organizational performance.
The measures need to convey clear connections
with a range of levels of decision-making such as
strategic and operational.
The metrics should also need to reflect an
acceptable balance between non-financial and
financial measures,
A measurement system that ensures a suitable
allocation of metrics to the areas where they would
be most appropriate.
Therefore, the framework outlined in this paper helps
SMEs construct and build a strategic performance
measurement system which involves the two types of
supply chain strategies: Efficient and Responsive, and
supply chain performance attributes based on SCOR
model.
The framework utilizes AHP approach to integrate
SCOR performance attributes, and the two types of
supply chain strategies into one comprehensive model,
(figure 1). The supply chain model is use for several
reasons. First, SMEs need to think and act relying on a
wider range of measures that covers financial and non-
financial issues.
Secondly, this effort aims at bridging the gap
between supply chain models and SMEs. For example,
a study (Arend and Winsner, 2005) revealed that there
is a poor fit between supply chain management and the
small and medium-sized enterprises. The authors
attributed this poor fit to variety of reasons such as
ICORES2014-InternationalConferenceonOperationsResearchandEnterpriseSystems
50
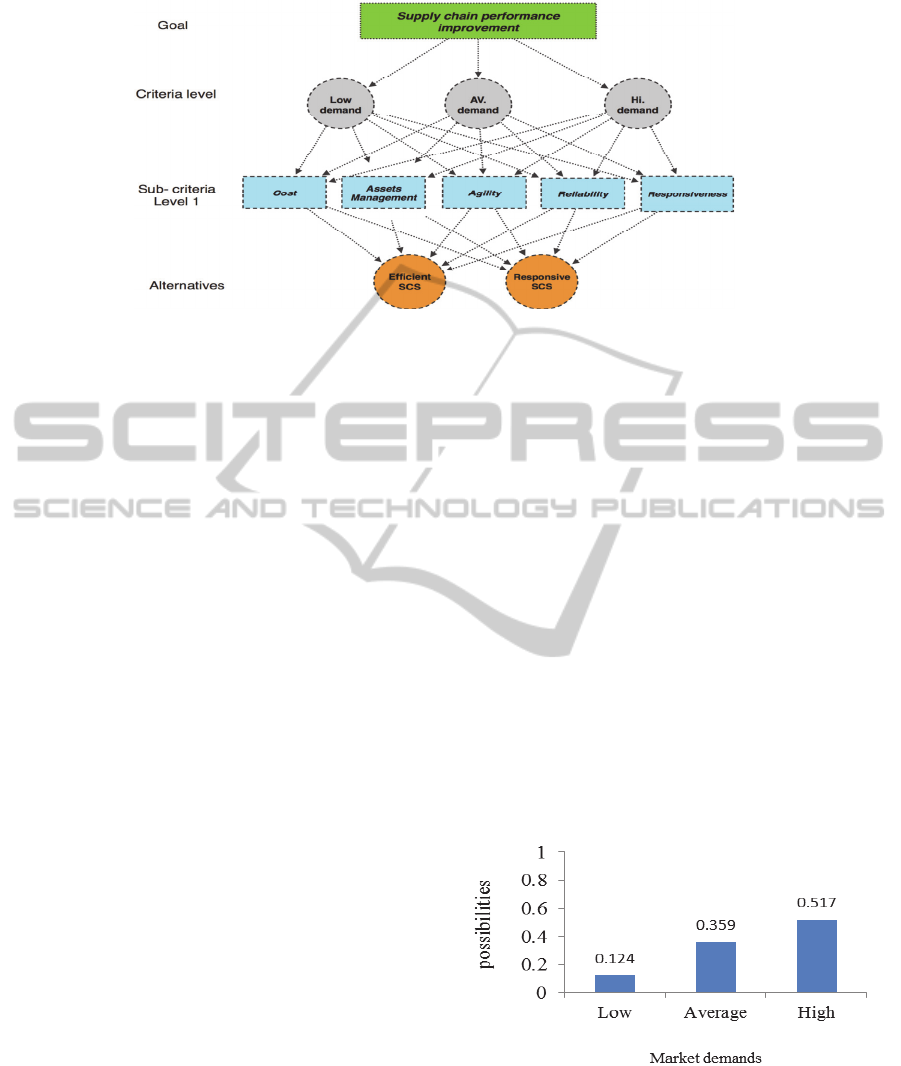
Figure 1: The four levels structure of the model.
improper implementation of supply chain management
by the small and medium-sized enterprises, and due to
the lack of use of supply chain management to
complement strategic focus.
The Expert Choice software was used to assist us
in building the hierarchal structure of the company’s
overall goal, market scenarios, performance attributes
and supply chain strategies. Expert Choice is intuitive,
graphically based and structured in a user-friendly
fashion so as to be valuable for conceptual and
analytical thinkers, novices and category. Expert
Choice software is intended to help decision-makers
and the software users overcome the limits of the
human mind to synthesize qualitative and quantitative
inputs from multiple stakeholders. The Expert Choice
software:
Conveys structure and measurement to the
planning and budgeting process
Aids you determine strategic priorities and
optimally allocates business resources
Converses priorities and builds consensus
Documents and justifies strategic decisions
Enables you to move forward quickly and
confidently (Expert Choice, 2013)
The AHP and Expert Choice software engage decision
makers in structuring a decision into smaller parts,
proceeding from the goal to objectives to sub-
objectives down to the alternative courses of action.
Decision makers then make simple pairwise
comparison judgments throughout the hierarchy to
arrive at overall priorities for the alternatives. The
decision problem may involve social, political,
technical, and economic factors. (Expert Choice,
2013).
The model is illustrated in the next section on a
case of a medium-sized manufacturing enterprise.
As shown in figure1, two key supply chain
strategies are considered at the last level that
represents the available alternatives that the decision
maker has to choose from based on market conditions,
business environment and company’s overall goal. The
third level, the attributes level, includes: Cost, Assets
management as internal or let us say financial
attributes and Agility, Reliability, and Responsiveness
as customer or nonfinancial performance and strategy
attributes. Notice that the SCOR attributes bring
financial and non-financial measures together to
achieve an important part of the non-traditional
performance system requirements. The second level or
the scenario level shows various market conditions:
low demand, average demand and high demand. Each
and every business encounters one or more of these
market conditions, but the question of how, when, and
why one supply chain strategy is chosen over the other
and on what basis usually remains fairly open. Some
of these issues will be highlighted in the next section
through the presented case study.
Figure 2: The likelihood of different scenarios.
7 CASE STUDY
A Saudi-based and family-owned medium-size
manufacturing firm, call it company X, specialized in
ASupplyChainStrategyManagementModelforSmallandMediumSizedEnterprises
51
production of plastic pipes and fittings products. The
company strategy is to produce and deliver high
quality products to its customers at the agreed delivery
time and method. Most of its customers are large
firms, mega project contractors and government
agencies. Although the company operates in a highly
competitive market, the plastic pipes and fittings
market, its product prices are almost the highest
compared to similar products on the market.
Based on the information collected about the
company policy and operations, the Expert Choice
software was used to translate and build the four level
hierarchal structures: the goal, scenarios, criteria, and
alternatives levels. The evaluation of these alternative
strategies is carried out level-by-level, starting from
top down towards the lower levels. The process begins
on level two by assessing likelihood of occurrence of
scenarios of different market demands during the
planning period. The evaluation process of different
scenario according to company X is shown in table 5.
Table 5: Pair wise comparison at level 2.
Low Av. High
Low 1 4 3
Av. 1/4 1 2
High 1/3 1/2 1
The results of the second level evaluation process
show that the possibility of high demand scenario
occurrence is relatively higher than the other ones,
figure 2.
The second step evaluates the relative effects of
each criterion “attribute” on performance under a
specific scenario. For example, what would be the
relative effect of cost (CO), assets management (AM),
agility (AG), reliability (RL), and responsiveness (RS)
on performance if demand is low?, see table 6. Notices
that the relative effects of each performance attribute
or criterion may vary depending on market conditions
or product types.
Table 6: The pair wise comparison of performance attributes
under low market demand.
CO AM AG RL RS
CO 1 3 4 3 4
AM 0.33 1 3 2 2
AG 0.25 0.33 1 3 4
RL 0.33 0.50 0.33 1 1
RS 0.25 0.50 0.25 1 1
The results obtained from the evaluation process of
performance attributes are shown in figure 3. In order
to complete the level calculations one needs two more
comparison processes for average and high market
demand. The third step addresses the performance of
each strategy on each performance criterion.
Figure 3: Weights of performance attributes under low
market demand.
Finally, the overall performance of each strategy
can be calculated through the composition process by
using Expert Choice. The performance of the two
alternatives: efficient and responsive supply chain
strategy is shown in the following figure.
Figure 4: Overall weight of the two alternatives.
8 RESULTS AND DISCUSSION
The proposed framework was used to develop a model
for a specific medium-sized manufacturing company.
Notice that the company expectations of having high
demand for the plastic pipes and fittings products is
about 52%, 36% for average demand and 12% for low
demand during the planning period. With high market
demand, customers usually pay less attention to
products prices and manufacturers without difficulty
cover fixed and other related costs in mass production
environment. This means that the company must place
more emphasis on customer-related attributes as a
major performance success factors.
ICORES2014-InternationalConferenceonOperationsResearchandEnterpriseSystems
52
Within the planning period, the evaluation process
clearly shows that focus on responsiveness is the most
appropriate strategy that company X needs to adopt
since the possibility of having high demand is
relatively higher than the others. However,
maintaining forever the same performance measures or
supply chain will not help in rapidly changing business
environment.
As the external environment changes frequently
and rapidly, the group of performance attributes and
measures in use by businesses must also change to
reflect the changes in internal and/or external
environment. Generally speaking, the changes in the
performance measurement system can be done by
adding, eliminating, replacing, or even reprioritizing
performance measures and metrics. For example, a
performance measure such as, for example supply
chain responsiveness which initially has high priority
may move down to low priority in other circumstances
or because of changes in the internal and external
business environment.
In the case presented, the judgments of the
likelihood of having high, average and low demand are
based on previously collected information about the
market demands of company X in the last few years.
However, the demand may change at any time during
the planning period which in some cases leads to
remarkable increase or decrease of the real market
needs. These types of changes usually call for
adjustments in businesses strategies, policies, or goals
in order to meet the new challenges. For this reason,
sensitivity analyses to evaluate changes in scenarios
during planning period of company X were used.
The model remains as is with the same scenarios of
market demands: low, average, and high in the second
level. The third level has five supply chain
performance attributes: cost, assets management,
agility, reliability, and responsiveness. And finally in
fourth level provides a choice between two types of
supply chains: efficient or responsive.
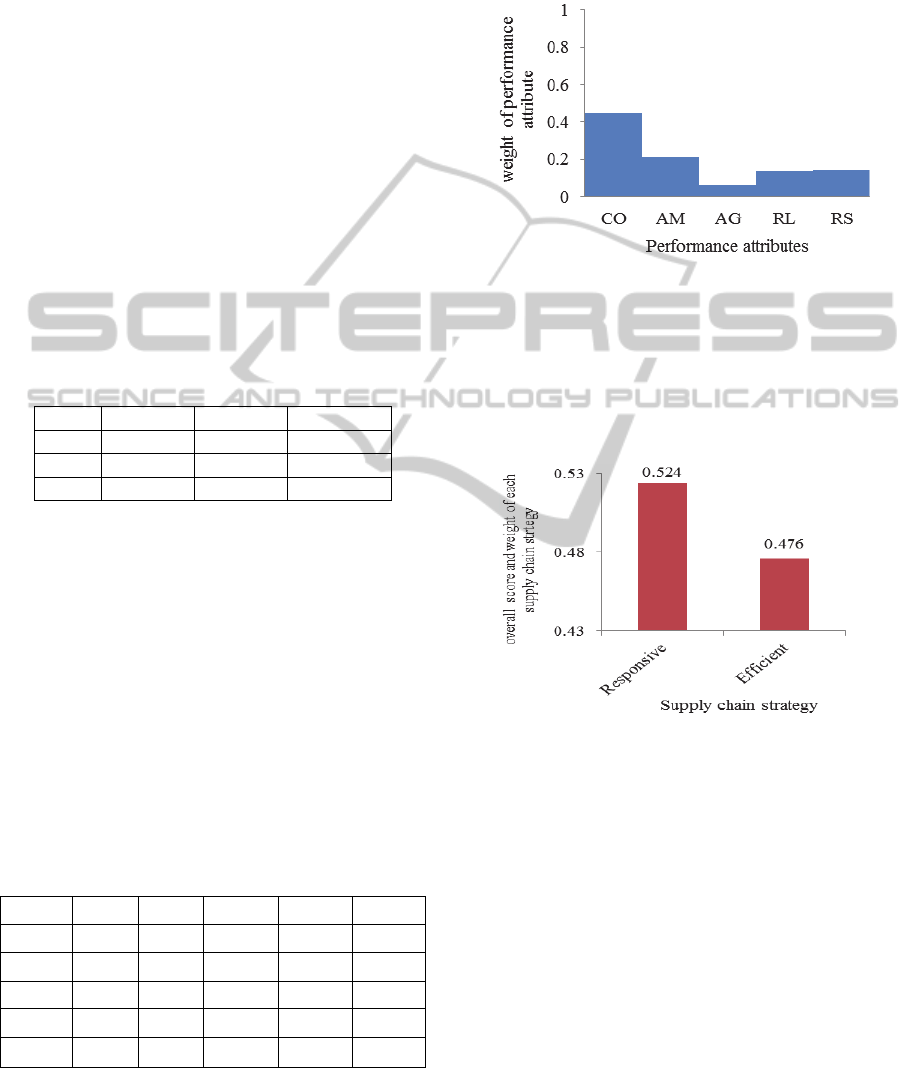
Some changes were made to the input data and
judgments of level 2, the market scenarios level. For
example, the likelihood of having high demand was set
to 100% in order to capture and observe the changes in
the model outputs. The 100% high demand market
resulted in selection of responsive supply chain
strategy with about 0.66 priority weights as shown in
figure 5 below.
However, market conditions and demands always
change, thus companies also need to examine the
extremes of the markets. Therefore, the model was
reset to100% low demand. With this setting, the model
chooses efficient supply chain strategy as the best
strategy for the low demand market, see figure 6.
Similar steps were conducted to reset the model to
100% average demand. With this setting, the model
gave the priority to efficient supply chain strategy but
with less weight compared to 100% low demand
scenario, figure 7.
Figure 5: When occurrence of high demand is 100%.
Figure 6: When the event of low demand is 100%.
Figure 7: When average demand is 100%.
Table 7 shows the results of different scenarios
generated using sensitivity analysis using Expert
choice. In general, when the probability of the
occurrence of low or average demand is 100%, the
performance of efficient supply chain strategy will be
better than the performance of responsive supply chain
strategy. When the probability of high demand is
certain, likelihood of 100%, responsive supply chain
strategy should give better performance than efficient
supply chain strategy. For company X, the market
demand can be divided to three intervals or classes:
low, average, and high. In addition, the company sets
the limits for each one as shown in table 8 below.
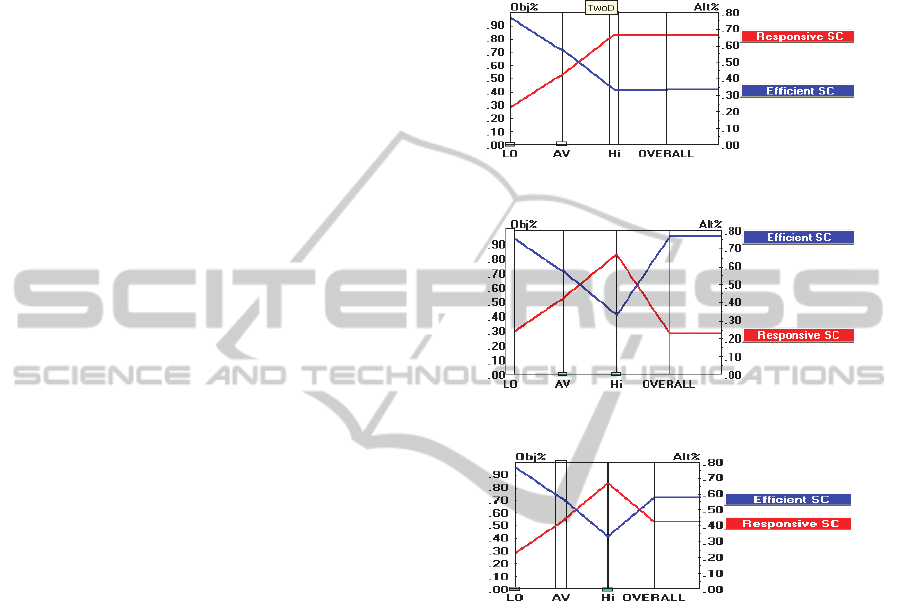
Based on these intervals and the forecasted demand
for the planning period, the coming 18 months, the
company has to adopt both strategies but in different
time periods as shown in figure 8. The company needs
to adopt responsive supply chain strategy for the first
five months within the planning period and go back to
efficient supply chain for the rest of the year.
ASupplyChainStrategyManagementModelforSmallandMediumSizedEnterprises
53
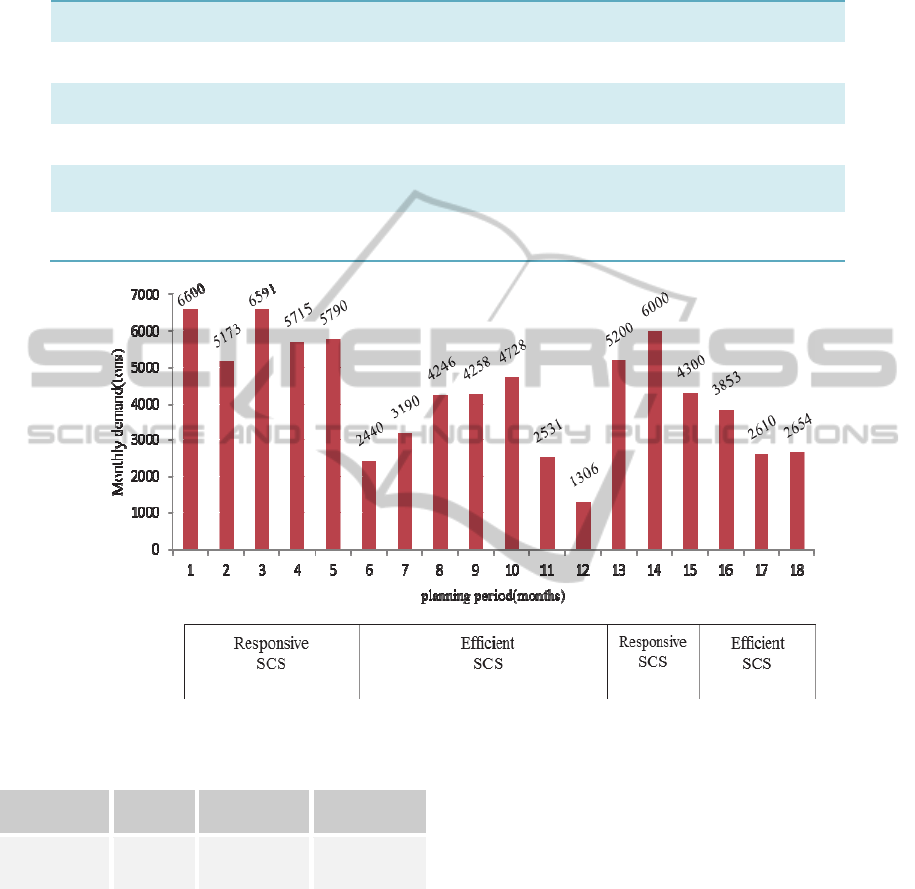
Table 7: Different scenarios call for differing supply chain strategies.
Prob.Low Prob.AV. Prob.Hi PriorityEfficient
Priority
Responsiveness
StrategytoAdopt
0.124 0.359 0.517 0.474 0.526 Responsive
1.00 0.00 0.00 0.768 0.232 Efficient
0.00 1.00 0.00 0.573 0.427 Efficient
0.00 0.00 1.00 0.333 0.667 Responsive
0.379 0.00 0.621 0.500 0.500 Either
0.386 0.00 0.614 0.502 0.498 Efficient
Figure 8: Forecasted market demand of company x and the selection of the supply chain strategy.
Table 8: Demand categories for company x.
Demand Low Average High
Weight
(Tons)
0-2499 2500-4999 5000-8000
The Fisher’s framework suggests that there are two
types of products, functional and innovative products
(Fisher, 1997). Based on this classification, he
suggested two types of supply chain strategies that fit
each product type. For instance, he recommended
efficient supply chain strategy for functional products,
and a responsive supply chain for innovative types of
products.
Although efficient supply chain strategy performs
well with functional products, i.e. plastic pipes and
fittings, our case shows that there are few months
within the planning period that require some degree of
responsiveness in order to meet customer orders,
particularly orders for government projects.
Nevertheless, implementation of the model
requires users to be aware of the difference between
the two strategies. For instance, in the presented case
the company needs to minimize inventory to lower the
cost during low demand time. It also needs to select
material suppliers based on cost as a main factor while
trying to reduce manufacturing costs and lower the
margins. On the other hand (during high demand
period), the company has to reduce lead time, put
higher price margins, respond quickly to demand and
select suppliers based on flexibility, speed and
reliability. Table 9 shows the general differences and a
comparison between the two strategies.
ICORES2014-InternationalConferenceonOperationsResearchandEnterpriseSystems
54

9 CONCLUSIONS
A quantitative model for performance measurement
system with the example used illustrates how
practitioners especially in SMEs can implement the
model in order to improve business performance.
Using SCOR model helped in identifying a set of
financial and nonfinancial performance measures that
are generally used to evaluate supply chain
performance in large firms. The use of AHP approach
was useful in structuring the model to four levels:
Overall goal, Scenarios, Criteria, and Alternatives.
Table 9: Characteristics of efficient and responsive supply
chain strategies.
Efficient Supply
Chain
Responsive Supply
Chain
Primary goal Supply demand
at lowest cost
Respond quickly to
demand
Product design
strategy
Max.
Performance at a
min. product cost
Create modularity to
allow postponement
of product
differentiation
Pricing strategy Lower margins
because price is a
prime custom
driver
Higher margins
because price is not
a prime customer
driver
Manufacturing
strategy
Lower costs
through high
utilization
Maintain capacity
flexibility to buffer
against
demand/supply
uncertainty
Inventory
strategy
Min. inventory to
lower cost
Maintain buffer
inventory to deal
with demand/supply
uncertainty
Lead time
strategy
Reduce, but not
at the expense of
costs
Reduce
aggressively, even if
the cost are
significant
Supplier strategy Select based on
cost and quality
Select based on
speed, flexibility,
reliability, and
quality
Source: (Chopra and Meindle, 2004)
The use of Expert Choice software facilitated an
excellent environment in structuring the model
hierarchically, carrying out evaluation by level, and
making final alternatives evaluation and selection.
Some sensitivity analyses were performed in order to
sense the difference when changes occur in the internal
or external environment through our model. We
witnessed through the case that the link between
product type and supply chain strategy type works very
well which proofs previous suggestions. We also
observed that adding market demands with three
different scenarios into the model provides us with
different results for one market scenario, which
suggests that there are two key players in strategy
selection and that are the product type and the market
demand.
The authors of this paper believe that the outlined
model achieves important directions of non-traditional
performance measurement system such as: flexibility,
easy to use, up to date, comprehensive, involves
financial and non-financial measures, and based on
business strategy as well. Unlike previous
implementations of AHP and performance measures
model, the proposed model introduced a new approach
that SMEs can use to evaluate their internal needs and
external requirements by combining the two
approaches correctly.
The proposed model also effectively engages users,
mainly SMEs, to the world of supply chain
management and operations.
REFERENCES
Arend, R. and Wisner, J. 2005. Small business and supply
chain management: is there a fit? Journal of business
venture, 20 pp. 403-436.
Bititci, U. 1995. Modelling of performance measurement
systems in manufacturing enterprises. Journal of
production economics, 42 (2), pp. 137-147.
Branch, S. 2012. Key Small Business Statistics - SME
Research and Statistics. [online] Available at:
http://ic.gc.ca/eic/site/061.nsf/eng/h_02689.html
[Accessed: 25 Sep 2013].
Chen, K., Huang, M. and Chang, P. 2006. Performance
evaluation on manufacturing times. The International
Journal of Advanced Manufacturing Technology, 31 (3-
4), pp. 335-341.
Cheng, E. and Li, H. 2001. Analytic hierarchy process: an
approach to determine measures for business
performance. Measuring Business Excellence, 5 (3), pp.
30-37.
Cheng, E., Li, H. and Ho, D. 2002. Analytic hierarchy
process: A defective tool when used improperly..
Measuring Business Excellence, 6 (4), pp. 33-37.
Chennell, A., Dransfield, S., Field, J., Fisher, N., Saunders,
I. and Shaw, D. 2005. "OPM: A system for
organizational performance measurement", paper
presented at Performance Measurement in Past, Present
and Future, Cranfield: Cranfield University, Cranfield:
pp. 96-103.
Chopra, S. and Meindl, P. 2004. Supply chain management.
Upper Saddle River, NJ: Pearson Prentice-Hall.
Cocca, A. and Alberti, M. 2009. "SME's Three step
Pyramid: A new performance measurement framework
for SMEs", paper presented at 16th International Annual
EUROMA Conference: Implementation–realizing
Operations Management Knowledge, Göteborg.
Dixon, J., Nanni, A. and Vollmann, T. 1990. "The new
performance challenge: Measuring operations for world-
class competition", paper presented at Business One,
Homewood, IL, Dow Jones-Irwin.
ASupplyChainStrategyManagementModelforSmallandMediumSizedEnterprises
55

Expert Choice. 2013. Collaboration and Decision Support
Software for Groups & Organizations. [online]
Available at: http://expertchoice.com [Accessed: 7 Oct
2013].
Fisher, M. 1997. What is the right supply chain for your
product?. Harvard business review, 75 pp. 105-117.
Garengo, P., Biazzo, S. and Bititci, U. 2005. Performance
measurement systems in SMEs: a review for a research
agenda. International journal of management reviews, 7
(1), pp. 25-47.
Globerson, S. 1985. Issues in developing a performance
criteria system for an organization. International Journal
of Production Research, 23 (4), pp. 639--646.
Gosselin, M. 2005. An empirical study of performance
measurement in manufacturing firms. International
Journal of Productivity and Performance Management,
54 (5/6), pp. 419-437.
Haq, A. and Kannan, G. 2006. Fuzzy analytical hierarchy
process for evaluating and selecting a vendor in a supply
chain model. The International Journal of Advanced
Manufacturing Technology, 29 (7-8), pp. 826-835.
Holban, I. 2009. "Strategic performance measurement
system and SMEs competitive advantage", paper
presented at International conference on economics and
administration, University of Bucharest, Romania,
Bucharest: Faculty of administration and businesses.
Hudson, M., Lean, J. and Smart, P. 2001. Improving control
through effective performance measurement in SMEs.
Production planning \& control, 12 (8), pp. 804-813.
Hvolby, H. and Thorstenson, A. 2001. "Indicators for
performance measurement in small and medium-sized
enterprises", paper presented at the Institution of
Mechanical Engineers, Part B: Journal of Engineering
Manufacture, pp. 1143-1146.
Melnyk, S., Stewart, D. and Swink, M. 2004. Metrics and
performance measurement in operations management:
dealing with the metrics maze. Journal of Operations
Management, 22 (3), pp. 209-218.
Neely, A. 1999. The performance measurement revolution:
why now and what next? International Journal of
Operations & Production Management, 19 (2), pp. 205-
228.
Rangone, A. 1996. An analytical hierarchy process
framework for comparing the overall performance of
manufacturing departments. International Journal of
Operations \& Production Management, 16 (8), pp. 104-
119.
Saaty, T. 2008. Decision making with the analytic hierarchy
process. International Journal of Services Sciences, 1
(1), pp. 83--98.
Supply-chain.org. 2013. SCOR | Supply Chain Council.
[online] Available at: http://supply-chain.org/scor
[Accessed: 25 Sep 2013].
Tangen, S. 2004. Performance measurement: from
philosophy to practice. International Journal of
Productivity and Performance Management, 53 (8), pp.
726-737.
Taticchi, P., Tonelli, F. and Cagnazzo, L. 2010. Performance
measurement and management: a literature review and a
research agenda. Measuring Business Excellence, 14 (1),
pp. 4-18.
Tenhunen, J., Rantanen, H. and Ukko, J. 2001. "SME
oriented implementation of performance measurement
system", working paper, Lappeenranta University of
Technology, Lahti, Finland: Department of Indutrial
engineering and management.
Wang, G., Huang, S. and Dismukes, J. 2005.Manufacturing
supply chain design and evaluation. The International
Journal of Advanced Manufacturing Technology, 25 (1-
2), pp. 93-100.
ICORES2014-InternationalConferenceonOperationsResearchandEnterpriseSystems
56
