
Minutiae Persistence among Multiple Samples of the
Same Person’s Fingerprint in a Cooperative User Scenario
Vedrana Krivokuća, Waleed Abdulla and Akshya Swain
Department of Eletrical and Computer Engineering, The University of Auckland, Auckland, New Zealand
Keywords: Biometrics, Fingerprints, Fingerprint Recognition, Partial Fingerprints, Minutiae, Missing Minutiae.
Abstract: A significant challenge in the development of automated fingerprint recognition algorithms is dealing with
missing minutiae. While it is generally assumed that some minutiae will always be missing between
multiple samples of the same fingerprint, this assumption has never been empirically evaluated. An
important factor influencing minutiae persistence in civilian fingerprint recognition applications is the
consistency with which a user places their finger on the fingerprint scanner during fingerprint image
acquisition. This paper investigates the probability of a reference minutia repeating in another sample of the
same person’s fingerprint, when that probability depends on user consistency alone. The investigation
targets cooperative users in a civilian fingerprint recognition application. To simulate this scenario, a
database of 800 fingerprint samples from 100 participants was collected. Analysis of the database showed
that the median probability of a reference minutia repeating in another sample of the same fingerprint is
0.95 with an interquartile range of 0.04. Combining multiple samples of the same fingerprint to filter out
only the most reliable reference minutiae was shown to improve this probability. A complementary study
demonstrated that automatic feature extractors and matchers may lower minutiae repeatability, but that user
consistency is nevertheless the most influential factor.
1 INTRODUCTION
Fingerprint matching is usually based on small ridge
discontinuities called minutiae (Maltoni et al.,
2009a). The most common minutiae types are the
bifurcation and the termination (see Figure 1). The
more minutiae that two fingerprints have in
common, the greater the probability that they
originated from the same finger.
Figure 1: The most common fingerprint minutiae types.
One of the biggest problems in automated
fingerprint matching is that of missing minutiae. A
minutia may be considered “missing” if it is present
in the reference fingerprint but its corresponding
minutia cannot be found in the query fingerprint,
when both fingerprints come from the same finger.
There are four main reasons why a reference minutia
may be missing from the query fingerprint:
1. The part of the fingerprint in which that
particular minutia exists has not been captured in
the query fingerprint; so, the minutia is literally
not present in the query fingerprint.
2. The minutia is physically present in the query
fingerprint, but the quality of this fingerprint is
poorer than that of the reference fingerprint, so
the minutia cannot be noticed.
3. The minutia is present in the query fingerprint
and the fingerprint is of sufficiently good quality
for the minutia to be noticed by a human expert,
but the automated feature extractor fails to detect
it.
4. The minutia is present in the query fingerprint
and it has been detected by the feature extractor,
but the matcher does not consider this minutia to
match its corresponding reference minutia (even
though the two minutiae do match).
The likelihood of minutiae missing due to reasons 2
to 4 can be reduced by improving the robustness of
the feature extractor and matcher, as well as by
incorporating quality control during fingerprint
Bifurcation
Termination
76
Krivoku
´
ca V., Abdulla W. and Swain A..
Minutiae Persistence among Multiple Samples of the Same Person’s Fingerprint in a Cooperative User Scenario.
DOI: 10.5220/0004816500760086
In Proceedings of the 3rd International Conference on Pattern Recognition Applications and Methods (ICPRAM-2014), pages 76-86
ISBN: 978-989-758-018-5
Copyright
c
2014 SCITEPRESS (Science and Technology Publications, Lda.)

capture in civilian fingerprint recognition
applications. The probability of minutiae missing
due to reason 1, however, is more difficult to
control, since it mainly depends on how consistent
the owner of the fingerprint is in presenting that
fingerprint for image capture. The problem of
minutiae missing due to reason 1 falls into the
category of partial fingerprint matching.
Partial fingerprint matching refers to the situation
where we are required to match two fingerprints that
come from the same finger but may not have a large
area of overlap. The area of overlap is usually
defined in terms of the number of minutiae that are
common between both fingerprints. Partial
fingerprint matching has had a considerable amount
of attention in the literature since the early days of
fingerprint recognition. The most popular minutiae-
based methods of matching partial fingerprints rely
on using local minutiae structures; for example
(Hrechak and McHugh, 1990, Chen and Kuo, 1991,
Jea and Govindaraju, 2005). Use of local minutiae
structures avoids the need for fingerprint alignment
using singular points, such as the core and delta,
which may not be present in partial fingerprints.
To improve partial fingerprint matching, several
researchers have proposed the use of additional
fingerprint features to increase the ‘uniqueness’ of
small fingerprint portions; e.g., dots (isolated ridges)
and incipients (thin, immature ridges between the
regular ridges) (Yi and Jain, 2007), the coordinates
and orientations of representative ridge points (Fang
et al., 2007), sweat pores (Kryszczuk et al., 2004,
Zhao et al., 2010), etc. These additional features
introduce supplementary information to make up for
the typically few minutiae that are present in a
partial fingerprint, thereby improving the
performance of partial fingerprint matchers.
Partial fingerprints are most commonly
encountered in forensics, because latent prints left at
crime scenes are usually not planned. In civilian
fingerprint recognition applications, where
fingerprint acquisition is deliberate, there are two
main reasons why a captured fingerprint may be
partial: (i) inconsistency in the placement of the
finger on the fingerprint scanner, and (ii) size of the
scanning surface being smaller than the fingerprint.
In this paper, we investigate reason (i) in terms of
the captured fingerprint minutiae. In particular, we
empirically quantify the probability of a reference
minutia being present in another sample of the same
fingerprint, when the only thing that probability
depends on is the consistency with which a person
places their finger onto a fingerprint scanner. Such
an evaluation is important for determining the
amount of influence that a legitimate user of a
fingerprint recognition system is likely to have on
the final authentication decision.
This investigation targets cooperative users in
civilian fingerprint recognition applications;
therefore, we were unable to use public fingerprint
databases, such as the Fingerprint Verification
Competition (FVC) series (Biometric System
Laboratory, 2013), for testing. This is because most
of those databases were created by asking the
participants to deliberately exaggerate the
inconsistency with which they place their finger on
the provided scanner, so the resulting fingerprint
images are not representative of cooperative users in
a civilian fingerprint recognition application. For
this reason, we collected our own database of 800
fingerprint samples from 100 cooperative users in a
simulated civilian fingerprint recognition scenario.
Although minutiae persistence (repeatability)
among cooperative users would naturally be
expected to be high, an empirical evaluation of this
assumption has not previously been undertaken.
Analysis of our database indicates that cooperative
users in a civilian fingerprint recognition application
may be expected to be consistent enough in the
placement of their fingers onto the fingerprint
scanner to ensure that the median probability of a
reference minutia being present in another sample of
the same fingerprint is 0.95 with an interquartile
range of 0.04. Additional analysis suggests that this
probability may be improved by combining multiple
fingerprints during enrolment to filter out only the
most reliable reference minutiae.
While user consistency is important in ensuring
that the same minutiae are captured during each
scan, minutiae repeatability is also affected by
additional factors, of which errors in automatic
feature extraction and matching are prominent. The
effect of a commercial feature extractor and matcher
on minutiae persistence was thus studied. Results
from this study show that these modules lower
minutiae repeatability, but that user consistency is
nevertheless the most influential factor. This study
serves as an example of how our results on user
consistency may be applied towards honing in on the
most problematic areas in a fingerprint recognition
system, which would be helpful in the development
of the constituent algorithms.
Section 2 of this paper provides details on the
database collection procedure. Section 3 analyses
the database to obtain the probability of a reference
minutia repeating in another sample of the same
fingerprint, when the minutiae persistence depends
only on the consistency with which a user presents
MinutiaePersistenceamongMultipleSamplesoftheSamePerson'sFingerprintinaCooperativeUserScenario
77

their fingerprint to the scanner. The minutiae
persistence is analysed in two scenarios: one where
the reference minutiae are extracted from a single
reference fingerprint and one where multiple
reference fingerprints are combined to select only
the most reliable reference minutiae. Section 4
illustrates the effect of a commercial minutiae
extractor and matcher on minutiae persistence, and
suggests how the results of our investigation on user
consistency can be applied in the development of
fingerprint recognition algorithms. Section 5
concludes this investigation and recommends venues
for future work in this direction.
2 FINGERPRINT DATABASE
COLLECTION
Public fingerprint databases, such as those provided
for the Fingerprint Verification Competitions (FVC)
(Biometric System Laboratory, 2013), have
generally been constructed by asking the participants
to deliberately exaggerate the inconsistency with
which they place their finger on the provided
fingerprint scanner, e.g., (Maio et al., 2002). Figure
2 shows three samples of the same fingerprint from
the FVC2002 DB1_A database: the first image was
acquired when the user placed their finger on the
scanner in a cooperative manner, and the second and
third images are deliberately rotated and translated
samples of the same fingerprint, respectively.
Figure 2: Three samples of the same fingerprint from
FVC2002 DB1_A.
The nature of these databases makes them suitable
for testing fingerprint recognition algorithms
designed for deployment in uncooperative user
scenarios, e.g., forensics, where the latent prints are
usually partial and of poor quality; border security,
where a criminal may attempt to avoid recognition;
etc. However, they are not representative of
fingerprint samples that would be acquired in
cooperative civilian fingerprint authentication
applications. In such applications, it is in the users’
best interests to be recognised, so it is fair to assume
that they would be fairly consistent in presenting
their fingers to the fingerprint scanner.
The aim of this investigation was to quantify the
consistency of cooperative users in a civilian
fingerprint recognition application. This consistency
was measured in terms of the probability of a
reference minutia being present across multiple
samples of the same person’s fingerprint. At first,
the FVC2006 public fingerprint database (Biometric
System Laboratory, 2006), which was collected by
asking the participants to place their fingers on the
scanner naturally, appeared suitable for our
purposes. However, the construction of this
database did not involve a quality check on the
acquired fingerprint images. In our investigation, a
quality check was important for two reasons.
Firstly, since we were interested in evaluating
minutiae repeatability based on user consistency
alone, we had to eliminate the fingerprint quality
factor from the database. This means that
fingerprint images acquired from the same finger
had to be of approximately the same quality.
Secondly, our investigation targets civilian
fingerprint recognition applications, which usually
perform a quality check on the captured fingerprint
images (Maltoni et al., 2009b). This helps to
improve the chances of a correct authentication
decision by ensuring that the acquired fingerprint
images are all of a sufficiently high quality for
subsequent processing. For this reason, using
fingerprint images of very variable quality was
irrelevant to our investigation. Hence, the FVC2006
database was an unsuitable testing platform for our
purposes and it was necessary to collect our own
fingerprint database. Sections 2.1 to 2.3 describe
our database collection procedure in detail.
2.1 Scanner Specifications
The images in our fingerprint database were
acquired using the Futronic FS88 fingerprint scanner
(Futronic, 2013). The FS88 is an optical scanner,
which produces 8-bit grey level fingerprint images
with a resolution of 320x480 pixels, 500dpi.
A crucial property of electronic fingerprint
scanners, which sets them apart, is their underlying
sensor technology. Since optical sensors are a
popular choice in fingerprint scanner design (Jain et
al., 2011) and since these types of scanners generally
exhibit similar user interfaces, the FS88 scanner may
be considered to be “typical”. This means that the
results of our investigation are not limited to this
particular scanner.
2.2 Participant Selection
Our fingerprint database was constructed using
ICPRAM2014-InternationalConferenceonPatternRecognitionApplicationsandMethods
78
fingerprints provided by volunteers. The fact that
participation was voluntary was the first step in
ensuring that the database would represent
cooperative users. The participants consisted of
adults of both genders, from diverse ethnic
backgrounds and of various ages in the range [18,
60] (though the majority were young adults). In
total, 100 participants were used in this study.
2.3 Methodology
The participants were invited to play the part of
cooperative users in a fingerprint-based computer
login application. They were asked to sit down at a
typical computer station with the scanner positioned
on the desk approximately where the computer
mouse would be. Each user was free to move the
scanner around and position it in whichever way was
most comfortable for them (as long as it stayed flat
on the desk). Users were asked to choose a finger
that they would use to authenticate themselves in a
fingerprint-based computer login application. The
only guidance that the users received regarding the
proper placement of their finger on the scanner was
that the line of the first joint from the top of the
finger should roughly lie on the line just below the
glass platen on the fingerprint scanner, such that the
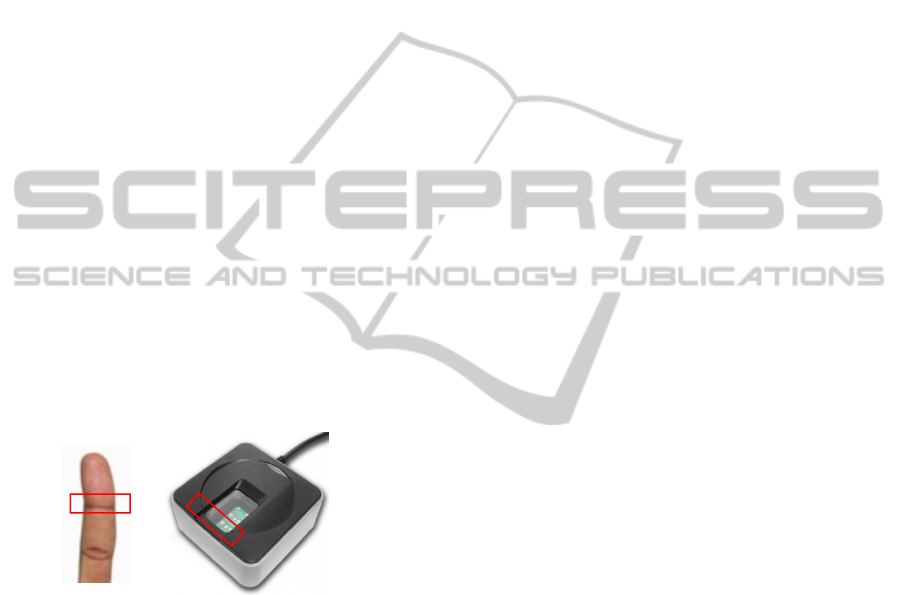
maximum fingerprint area is captured (see Figure 3).
Figure 3: Guide on the proper placement of a finger on the
FS88 scanner: align the lines inside the red rectangles.
The participants were then asked to find a
comfortable position on the scanner, which they feel
they could naturally repeat for future scans. Each
participant’s chosen fingerprint was scanned 8 times.
To ensure that a fingerprint image was of
sufficiently good quality for subsequent processing
and that the quality across multiple samples of the
same person’s fingerprint was approximately
consistent, the quality of the fingerprints was
visually examined by the investigator. Users with
dry skin were asked to rub their fingers on the side
of their noise or onto their forehead to apply some
grease to the fingerprint, and users with very wet or
greasy fingers were asked to dab their finger onto a
piece of clothing. A fingerprint image was deemed
to be of sufficiently good quality when the
difference between the ridges and valleys was clear.
Note that fingerprint databases are often
constructed by acquiring multiple samples of the
same person’s fingerprint over several days. The
purpose of this is to simulate natural variability
between the samples; e.g., on some days a person’s
finger may be drier than on other days. However,
since our investigation required elimination of the
quality factor, simulating this natural variability was
unnecessary. So, we elected to collect each of a
participant’s 8 fingerprint samples on the same day.
To simulate multiple authentication attempts, after
each scan the participant was asked to remove their
finger from the scanner while their previous
fingerprint image was saved by a human operator.
The images were saved manually to deliberately
introduce some delay in between the scans and to
‘distract’ the participant, thereby mimicking
different authentication attempts. Once the scanning
started, the human operator did not guide the user in
the placement of their finger on the scanner.
The participants were observed to be careful in
the way in which they placed their fingers on the
scanner. They also became very aware of what a
good quality fingerprint image should look like after
the initial quality check, and most controlled this
quality on their own for subsequent scans, without
prompting by the operator. This suggests that users
are both capable and willing to be cooperative in a
scenario in which they want to be recognised.
3 ANALYSIS OF MINUTIAE
PERSISTENCE BASED ON
USER CONSISTENCY ALONE
The collected database was analysed to gain insight
into the expected persistence (repeatability) of
reference minutiae in a cooperative civilian
fingerprint recognition application, when that
persistence depends on user consistency alone. This
persistence was quantified in terms of the probability
of a reference minutia being physically present in
another sample of the same fingerprint.
To ensure that we were evaluating the baseline
minutiae repeatability, based on user consistency
alone, it was necessary to use ground truth minutiae
information, free from the errors of automatic
fingerprint feature extractors and matchers. For this
reason, the minutiae from each fingerprint were
extracted manually and correspondences between
the minutiae in all 8 samples of each fingerprint
MinutiaePersistenceamongMultipleSamplesoftheSamePerson'sFingerprintinaCooperativeUserScenario
79
were also established manually. All 8 samples of a
person’s fingerprint were scrutinised simultaneously
to find matching minutiae. Once all the minutiae
were thought to have been identified and matched, a
final, careful check of all 8 samples was made to
ensure that no minutiae were missed out. Note that
minutiae identification and matching in good quality
fingerprint images is fairly simple for an informed
human, as people are naturally good at pattern
recognition. Since a quality check was performed
during image acquisition (see Section 2.3), the
images were of sufficiently good quality to make the
process of identifying minutiae reasonably
straightforward; it just took a lot of patience to
ensure that they were all found! Therefore, we may
conclude that, if any human error crept into this
process, it was insignificant compared to the total
number of minutiae extracted for the entire database.
Reference minutiae repeatability was analysed in
two different scenarios: one in which the reference
minutiae are extracted from a single reference
fingerprint, and one in which multiple reference
fingerprints are combined to filter out the reliable
minutiae. Sections 3.1 and 3.2, respectively, detail
the analysis in each of these scenarios.
3.1 Scenario 1: Single Reference
Fingerprint
In this scenario, the reference minutiae were
extracted from only one reference fingerprint and all
the reference minutiae were considered reliable. For
every person in the database, each of their 8
fingerprint samples had a turn at being the reference,
while their remaining 7 samples were used as the
test fingerprints. The number of test samples in
which each of the reference minutiae appears was
counted, and the probability of a reference minutia
repeating in another sample of the same fingerprint
was then calculated using Equations (1) and (2):
7
,17
(1)
(2)
In Equation (1),
is a fraction representing the
number of test samples out of 7. In Equation (2), i
represents the index of the person whose fingerprints
we are currently analysing; since there are 100
people in our database, 1 100. The subscript
j represents the index of the fingerprint sample that
is currently being used as the reference fingerprint;
since there are 8 fingerprint samples per person,
18. So,
denotes the probability of a
reference minutia repeating in another sample of
person i’s fingerprint, when the reference minutiae
are extracted from person i’s fingerprint sample j.
The total number of reference minutiae in person i’s
fingerprint sample j is denoted by
. The number
of reference minutiae that appear in k test samples is
represented by
.
The probability of a reference minutia repeating
in another sample of the same fingerprint was
calculated for each of a person’s reference
fingerprints in turn, so there were 8 probabilities per
person. This was repeated for all 100 people in the
database, so there were 800 probabilities in total.
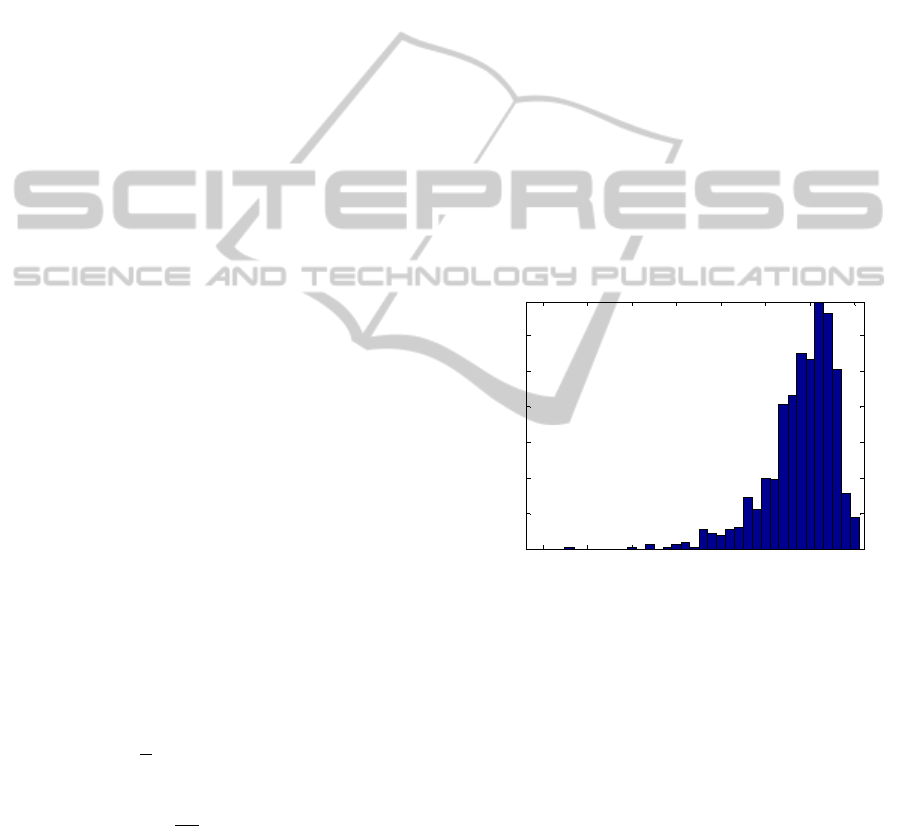
These 800 probabilities were used to plot a
distribution of the probabilities of a reference
minutia repeating in another sample of the same
fingerprint; this distribution is depicted in Figure 4.
Figure 4: Distribution of the probabilities of a reference
minutia repeating in another sample of the same
fingerprint when one reference fingerprint is used.
It is immediately evident that the distribution in
Figure 4 is highly skewed to the left. Calculating the
skewness in MATLAB produced a value of -1.5924,
which confirms this observation. When a
distribution is skewed, the median is a better
indicator of the distribution’s central tendency than
is the mean. The box and whisker plot in Figure 5
provides a visual analysis of the distribution in
Figure 4 in terms of the median, interquartile range
and range of the data.
From Figure 5, the median of 0.95 indicates the
typical probability of a reference minutia repeating
in another sample of the same fingerprint. The
lower quartile tells us that, 75% of the time, we
may expect the probability of a reference minutia
0.65 0.7 0.75 0.8 0.85 0.9 0.95 1
0
0.02
0.04
0.06
0.08
0.1
0.12
Distribution of the Probabilities of a Reference Minutia Repeating
in Another Sample of the Same Fingerprint
(1 Reference Fingerprint Used)
Probability of a Reference Minutia Repeating
Probability of Obtaining a Certain Probability
for a Reference Minutia Repeating
ICPRAM2014-InternationalConferenceonPatternRecognitionApplicationsandMethods
80
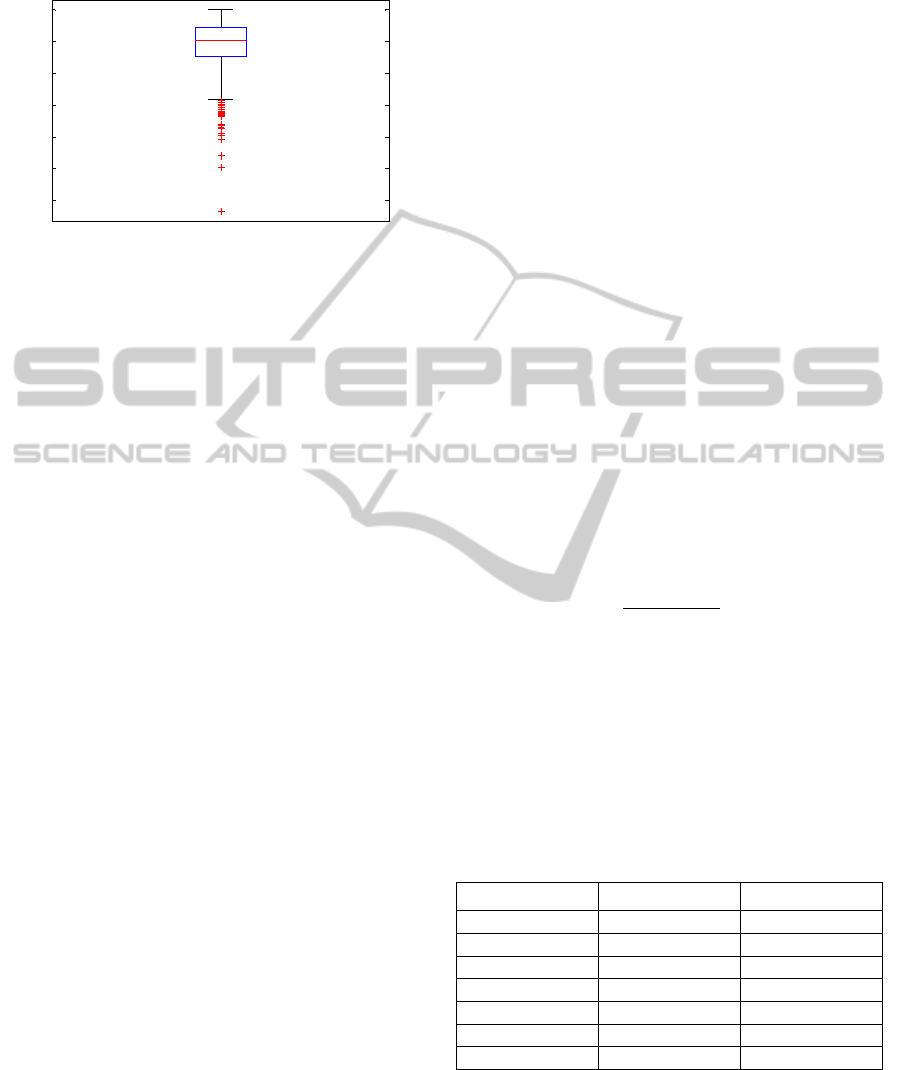
Figure 5: Box and whisker plot of the reference minutiae
repeatability distribution when one reference fingerprint is
used.
repeating in another sample of the same fingerprint
to be 0.93 and above. The upper quartile suggests
that, 25% of the time, the probability of a reference
minutia repeating will be 0.97 and above. So, we
may conclude that the probability of a reference
minutia repeating in another sample of the same
fingerprint when 1 reference fingerprint is used is
typically 0.95 with an interquartile range of 0.04.
This means that cooperative users in a civilian
fingerprint recognition application can be expected
to be consistent enough in placing their finger onto
the fingerprint scanner to ensure that, typically, 95%
of the same minutiae are captured across multiple
samples of the fingerprint, and, 50% of the time, 93-
97% of the same minutiae are captured.
The whiskers of the plot in Figure 5 represent the
range of our distribution, ignoring outliers. (Note
that outliers are those data values that lie more than
1.5 times the height of the box away from either side
of the box, which is a commonly applied rule of
thumb.) From Figure 5, we can see that our data lies
in the range [0.86, 1]. Considering Figure 4, we
may conclude that the probability of a reference
minutia repeating in another sample of the same
fingerprint is likely to lie in the range [0.86, 1] about
96% of the time, since around 96% of the
distribution in Figure 4 lies in this range.
While these results are certainly promising, it
appears logical that using multiple reference
fingerprints to filter out only the most reliable
reference minutiae would increase the probability of
a reference minutia repeating in another sample of
the same fingerprint. We investigate this claim in
Section 3.2.
3.2 Scenario 2: Multiple Reference
Fingerprints
In this scenario, instead of using only a single
reference fingerprint at a time, multiple reference
fingerprints were combined. The idea was to filter
out only the most reliable minutiae to use as the
reference minutiae. If N reference fingerprints are
combined, then the most reliable minutiae are those
minutiae that appear in all N reference fingerprints.
Logically, we would expect that using more
reference fingerprints would improve the chances of
a reference minutia repeating in a test sample of the
same fingerprint. This is because our confidence in
a reference minutia repeating in another sample of
the same fingerprint grows with every sample it
appears in. To verify this expected trend, the
number of reference fingerprints was varied from 1
to 7 for each person. If we let N denote the number
of reference fingerprints used, then the probability of
a reference minutia repeating in another sample of
the same fingerprint was calculated for each N.
Every possible combination of a person’s N
fingerprint samples was used in turn as the reference
sample set. Let
denote the number of N-
reference-fingerprint combinations per person. For
each value of N,
was calculated via Equation (3):
8!
!
8
!
(3)
Let
denote the total number of N-reference-
fingerprint combinations for the entire database of
100 people. For each N,
was computed using
Equation (4):
100
(4)
Table 1 lists the values of
and
as the number of
reference fingerprints, N, varies from 1 to 7.
Table 1: Values of
and
as N varies from 1 to 7.
N
1 8 800
2 28 2,800
3 56 5,600
4 70 7,000
5 56 5,600
6 28 2,800
7 8 800
To ensure fairness in the comparison between the
probabilities at different values of N, the same
number of test fingerprints was used for each N.
Since only one fingerprint remains to be used as the
test sample when N = 7, one test fingerprint was
0.7
0.75
0.8
0.85
0.9
0.95
1
Box and Whisker Plot of the
Reference Minutiae Repeatability Distribution
(1 Reference Fingerprint Used)
(MANUAL Minutiae Extraction and Matching)
Probability of a Reference Minutia Repeating
in Another Sample of the Same Fingerprint
MinutiaePersistenceamongMultipleSamplesoftheSamePerson'sFingerprintinaCooperativeUserScenario
81
used for all values of N. Note that each of a person’s
fingerprint samples had one or more turns
(depending on N) at being the test fingerprint. The
probability of a reference minutia repeating for each
N was then calculated using Equation (5):
(5)
In Equation (5),
denotes the total number of
reference minutiae resulting from person i’s
reference fingerprint combination j, when N
reference fingerprints are used.
denotes the
number of reference minutiae repeating in the test
fingerprint, so
is the probability of a reference
minutia repeating in the test fingerprint. Note that
1 100, 17, and 1
.
For each N, Equation (5) was used to calculate
for every N-reference-fingerprint combination
out of
total combinations, for each person. In the
end,
probabilities were obtained for each value
of N (see Table 1). For every N, its total set of
probabilities was used to construct a distribution of
the probabilities of a reference minutia repeating in
another sample of the same fingerprint when N
reference fingerprints are used. Each distribution
was converted into a box and whisker plot for
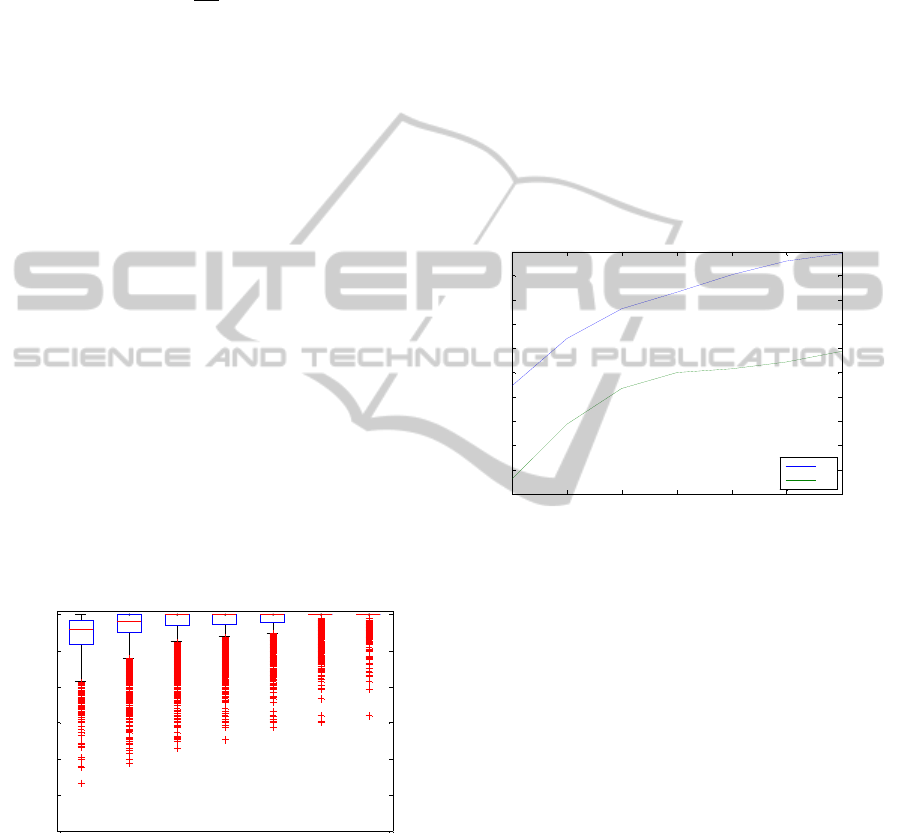
analysis. Figure 6 shows the box and whisker plots
of the distributions corresponding to each value of
N, side by side for easy comparison.
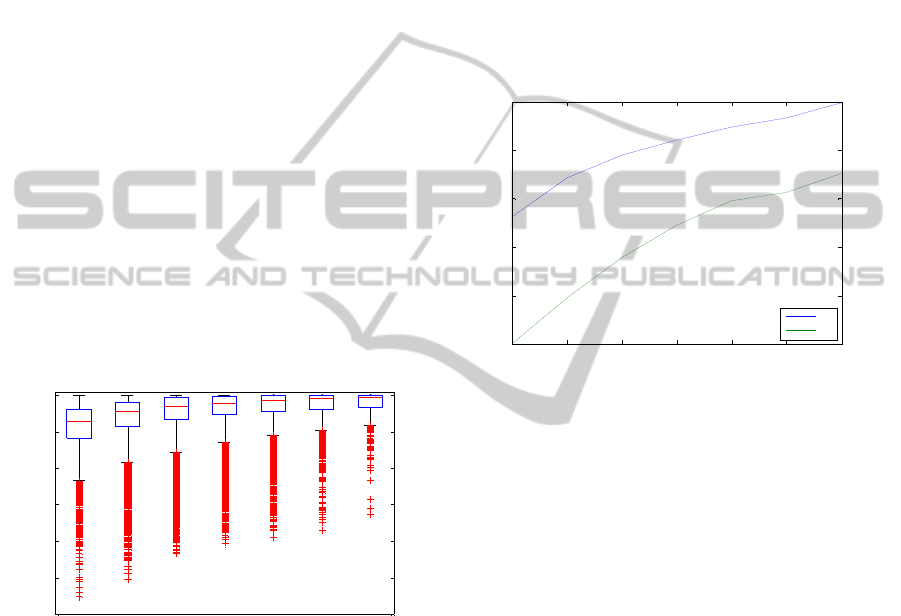
Figure 6: Box and whisker plots comparing the minutiae
repeatability distributions as the number of reference
fingerprints increases.
The first observation to note from Figure 6 is that, as
the number of reference fingerprints increases, the
median of the minutiae repeatability distribution also
increases, reaching a value of 1 when 3 or more
reference fingerprints are used. This suggests that
increasing the number of reference fingerprints
increases the likelihood of a reference minutia
repeating in another sample of the same fingerprint.
The second observation is that the interquartile range
and range both decrease with an increase in the
number of reference fingerprints, reaching a value of
0 when 6 or more reference fingerprints are used.
This suggests that increasing the number of
reference fingerprints gives us greater confidence
that the minutiae repeatability will be equal to the
median probability.
As an additional measure of the significance of
these results, we calculated the 5
th
and 1
st
percentile
for the minutiae repeatability distribution as the
number of reference fingerprints increases. The
results are illustrated in Figure 7.
Figure 7: 5th and 1st percentiles of the minutiae
repeatability distribution as the number of reference
fingerprints increases.
The trends in Figure 7 are expected based on the
analysis of Figure 6. From Figure 7, we can see
that, when only 1 reference fingerprint is used, 95%
of the time we may expect the probability of a
reference minutia repeating in another sample of the
same fingerprint to be 0.83 and above, and 99% of
the time we may expect this probability to be 0.75
and above. Using 7 reference fingerprints increases
these probabilities to 0.94 and 0.86, respectively.
These results are extremely encouraging, because
they suggest that it is possible to improve the
probability of a reference minutia repeating in a test
sample of the same fingerprint simply by using more
reference fingerprints to filter out only the most
reliable reference minutiae. However, we must also
consider the effect that this improvement strategy
has on the total number of reference minutiae
remaining for fingerprint matching purposes. Since
using more reference fingerprints effectively gets rid
of more (unreliable) minutiae, it makes sense to
0.4
0.5
0.6
0.7
0.8
0.9
1
1234567
Number of Reference Fingerprints Used
Box and W hisker Plots Comparing the
Distributions of the Probabilities of a Reference Minutia Repeating
when Different Numbers of Reference Fingerprints are Used
(MANUAL Minutiae Extraction and Matching)
Probability of a Reference Minutia Repeating
in Another Sample of the Same Fingerprint
1 2 3 4 5 6 7
0.74
0.76
0.78
0.8
0.82
0.84
0.86
0.88
0.9
0.92
0.94
Plot Showing the 5th and 1st Percentiles of the Minutiae Repeatability Probability Distribution
as the Number of Reference Fingerprints Increases
(MANUAL Minutiae Extraction and Matching)
Number of Reference Fingerprints Used
Probability above which 95% and 99% of the
Minutiae Repeatability Distribution Lies
5th
1st
ICPRAM2014-InternationalConferenceonPatternRecognitionApplicationsandMethods
82

conclude that this filtering operation will result in
fewer reference minutiae remaining. To show what
happens to the total number of reference minutiae as
the number of reference fingerprints increases, we
took the value of every
, which was used in
Equation (5) to calculate every
for Figure 6.
The number of
values for each N was thus the
same as the number of
values for each N (see
values in Table 1). The
values for each N were
then used to construct the distribution of the total
numbers of reference minutiae when N reference
fingerprints were used. The median of each
distribution was calculated. Figure 8 is a plot
showing the trend in the typical (median) number of
reference minutiae as N increases from 1 to 7.
Figure 8: Typical (median) number of reference minutiae
as the number of reference fingerprints increases.
The trend in Figure 8 is as expected; namely, as the
number of reference fingerprints increases, the
number of reference minutiae decreases. This is
because the idea behind using multiple reference
fingerprints is to filter out only the most reliable
reference minutiae. The most reliable reference
minutiae are those minutiae that are present in all the
reference fingerprints. So, the more reference
fingerprints that are used, the less probable it
becomes that a minutia will be present in all these
fingerprints. Consequently, increasing the number
of reference fingerprints has the effect of removing a
larger number of (unreliable) reference minutiae.
From Figure 8, we can see that, for our database,
the typical number of reference minutiae decreases
from 48 when 1 reference fingerprint is used to 40
when 7 reference fingerprints are used. This means
that the typical number of reference minutiae
resulting from using 7 reference fingerprints was
1
6
less than the typical number of reference
minutiae resulting from using 1 reference
fingerprint. This is not a significant difference,
which may be attributed to the fact that the
participants in our database collection were very
consistent in the placement of their fingers onto the
fingerprint scanner. The more consistent a user is in
placing their finger onto a scanner, the more similar
multiple samples of their same fingerprint will be.
Consequently, most of the minutiae should be the
same across all their samples. Relating this
observation to Figure 8, we may conclude that,
typically, about 40 out of 48 minutiae (over 83%)
will be present in all the samples of the same
fingerprint (for cooperative users in a civilian
fingerprint recognition application). This means that
combining multiple samples to filter out only the
most reliable minutiae should not result in the loss of
many minutiae, as is proven in Figure 8. Note that,
traditionally, 12 matching minutiae have been
considered sufficient evidence for a positive
fingerprint match (e.g., see (Kingston, 1964)). This
means that 40 reference minutiae provide ample
opportunity for reliable fingerprint recognition;
therefore, using 7 reference fingerprints would
ensure a high probability of a reference minutia
repeating in another sample of the same fingerprint,
whilst maintaining satisfactory recognition accuracy.
4 EFFECT OF AUTOMATIC
FEATURE EXTRACTOR AND
MATCHER ON MINUTIAE
PERSISTENCE
The analysis in section 3 shows that, when minutiae
persistence (repeatability) for cooperative users
relies only on the user’s consistency in placing their
finger on the fingerprint scanner, the persistence is
typically well over 90%. Unfortunately, while user
consistency is very important for ensuring that the
same fingerprint features are captured during every
authentication attempt, there is often a discrepancy
between what features are actually present in a
fingerprint and what features the automatic
fingerprint recognition system ‘thinks’ are present.
In other words, minutiae persistence is influenced
not only by the user’s consistency in capturing the
same fingerprint area, but also by the robustness of
the subsequent image processing and pattern
recognition algorithms in the fingerprint recognition
system.
We may logically expect minutiae repeatability
to be quite heavily influenced by the robustness of
1 2 3 4 5 6 7
40
41
42
43
44
45
46
47
48
Typical (Median) Number of Reference Minutiae
as Number of Reference Fingerprints Increases
Number of Reference Fingerprints Used
Typical (Median) Number of Reference Minutiae
MinutiaePersistenceamongMultipleSamplesoftheSamePerson'sFingerprintinaCooperativeUserScenario
83
the automatic feature extractor and matcher. This is
because, even if the same minutiae are captured in
every scan of a fingerprint, if the feature extractor
does not detect a minutia or the matcher cannot find
a match for it in the query fingerprint, then, as far as
the recognition system is concerned, that minutia
‘does not exist’ in the query fingerprint.
The effect of automated feature extractors and
matchers on minutiae persistence is practically
impossible to evaluate universally, because the
results are dependent upon which feature extraction
and matching algorithms are applied. For this
reason, we chose to conduct this study using the
latest version (6.7) of VeriFinger, a well-known and
easily available commercial feature extractor and
corresponding matcher (Neurotechnology, 2013).
The experiments described in Section 3 were
repeated for this study. The difference was that, this
time, the minutiae were extracted automatically and
the correspondences between minutiae across
different samples of the same fingerprint were also
established automatically. Figure 9 illustrates the
minutiae repeatability as the number of reference
fingerprints increases.
Figure 9: Box and whisker plots comparing the minutiae
repeatability distributions as the number of reference
fingerprints increases, when the minutiae are extracted and
matched automatically instead of manually.
Comparing Figure 9 to Figure 6, it is immediately
evident that minutiae repeatability is worse in the
case where the automatic feature extractor and
matcher are used in place of their manual
counterparts. In particular, two important
distinctions may be drawn. Firstly, while the
median in Figure 6 reaches a probability of 1 when 3
reference fingerprints are used, in Figure 9 the
median reaches is highest value of 0.99 when 7
reference fingerprints are used. Secondly, while the
interquartile range drops to 0 when 6 reference
fingerprints are used in Figure 6, the lowest
interquartile range in Figure 9 is 0.03 when 7
reference fingerprints are used. These observations
suggest that the automatic feature extractor and
matcher are not as consistent as a human expert in
identifying the minutiae and their correspondences.
For this reason, more filtering (i.e., a larger number
of reference fingerprints) is required to filter out
those minutiae that are most consistently identified.
For the sake of completeness, Figure 10 shows
the 5
th
and 1
st
percentiles of the minutiae
repeatability distributions used to generate Figure 9.
Figure 10: 5th and 1st percentiles of the minutiae
repeatability distribution for automatically extracted and
matched minutiae as the number of reference fingerprints
increases.
From Figure 10, it is evident that, when 1 reference
fingerprint is used, the probability of a minutia
repeating in another sample of the same fingerprint
is 0.78 and above 95% of the time, and 0.65 and
above 99% of the time. Compare these values to the
probabilities of 0.83 and 0.75, respectively, from
Figure 7. When 7 reference fingerprints are used,
the 5
th
and 1
st
percentiles from Figure 10 are 0.90
and 0.83, respectively. Contrast these probabilities
with 0.94 and 0.86, respectively, from Figure 7.
This analysis confirms the fact that using automatic
minutiae extraction and matching is likely to
decrease the probability of a minutia repeating in
another sample of the same fingerprint. This is
expected, because automated feature extractors and
matchers generally introduce errors of their own; so,
errors from user inconsistency, the feature extractor
and the matcher all combine to adversely affect
minutiae repeatability.
An important reason for conducting this study
was to illustrate how the results of our investigation
on user consistency can be applied in the
development and testing of automated fingerprint
0.4
0.5
0.6
0.7
0.8
0.9
1
1234567
Number of Reference Fingerprints Used
Box and Whisker Plots Comparing the
Distributions of the Probabilities of a Reference Minutia Repeating
when Different Numbers of Reference Fingerprints are Used
(AUTOMATIC Minutiae Extraction and Matching)
Probability of a Reference Minutia Repeating
in Another Sample of the Same Fingerprint
1 2 3 4 5 6 7
0.65
0.7
0.75
0.8
0.85
0.9
Plot Showing the 5th and 1st Percentiles of the Minutiae Repeatability Probability Distribution
as the Number of Reference Fingerprints Increases
(AUTOMATIC Minutiae Extraction and Matching)
Number of Reference Fingerprints Used
Probability above which 95% and 99% of the
Minutiae Repeatability Distribution Lies
5th
1st
ICPRAM2014-InternationalConferenceonPatternRecognitionApplicationsandMethods
84

recognition systems. Let us consider the scenario in
which only 1 reference fingerprint is used during
enrolment. From Figures 5 and 6, we can see that
there is typically (median) a 0.95 probability of a
reference minutia repeating in another sample of the
same fingerprint, when that repeatability depends
only on the user’s consistency in placing their finger
on the scanner. So, we may deduce that the
probability of a reference minutia missing in another
sample of the same fingerprint as a result of user
inconsistency alone is about 0.05. Turning our
attention to Figure 9, we can see that the typical
(median) probability of a reference minutia
repeating in another sample of the same fingerprint
when 1 reference fingerprint is used is around 0.93.
So, we may deduce that the probability of a
reference minutia missing in another sample of the
same fingerprint as a result of user inconsistency
and feature extractor errors and matcher errors is
around 0.07. Since our analysis of Figures 5 and 6
shows that user inconsistency may typically be
expected to account for about 5% of the reason for a
missing minutia, we could reasonably conclude that
the remaining 2% (or probability of 0.02 = 0.07 –
0.05) is due to errors in automated feature extraction
and matching. This tells us that, when this particular
fingerprint minutiae extractor and matcher are used,
minutiae repeatability is most heavily influenced by
user consistency. Analysis of this sort would be
extremely useful in zoning in on the most
problematic modules in a fingerprint recognition
system, which would help the designers of these
systems identify and then focus on the most crucial
area(s) of concern.
5 CONCLUSIONS
This paper investigates the probability of a reference
minutia repeating in another sample of the same
fingerprint, when the only thing that probability
depends on is the consistency with which a user
places their finger onto a fingerprint scanner. The
investigation specifically targets cooperative users in
civilian fingerprint recognition applications. To
simulate this scenario, a database of 800 fingerprint
samples from 100 cooperative users was collected.
Analysis of the database showed that, when the
reference minutiae are extracted from a single
reference fingerprint, the median probability of a
reference minutia repeating in another sample of the
same fingerprint is 0.95 with an interquartile range
of 0.04. When multiple reference fingerprints are
combined to filter out only the most reliable
reference minutiae, the probability of a reference
minutia repeating in another sample of the same
fingerprint is improved. The best result was
obtained using 7 reference fingerprints, in which
case it was found that the probability of a reference
minutia repeating in another sample of the same
fingerprint can be expected to be 0.94 and above
95% of the time, with a median probability of 1 and
an interquartile range and range of 0.
An analysis of what happens to the number of
reference minutiae as the number of reference
fingerprints increases showed a decreasing trend.
This is because using more reference fingerprints
has the effect of removing a larger number of
(unreliable) reference minutiae, so fewer reference
minutiae remain for fingerprint recognition
purposes. Our results indicate that, when users are
consistent in the placement of their finger onto a
fingerprint scanner, this loss of reference minutiae is
not very significant. Specifically, the median
number of reference minutiae dropped from 48 to 40
when 1 and 7 reference fingerprints were used,
respectively. Since 40 reference minutiae are
sufficient for a convincing fingerprint match, this
loss in the number of reference minutiae is fairly
insignificant.
While user consistency is extremely important in
ensuring that the same fingerprint features are
captured during each scan, errors in automatic
feature extraction and matching may also contribute
to minutiae persistence (repeatability). A study on a
commercial fingerprint feature extractor and matcher
confirmed that this is indeed the case, but that user
consistency is nevertheless the most influential
contributor to minutiae repeatability. This study was
used to illustrate how the results of our investigation
on user consistency can be applied towards more
rigorous development and testing of automated
fingerprint recognition systems. In particular,
knowing the likelihood of a minutia missing due to
user inconsistency will be useful for establishing the
most likely cause of a false non-match. This will
help to tease out the most problematic modules in an
automatic fingerprint recognition system.
Future work in this direction should primarily
focus on separately evaluating the influence of other
factors (e.g., fingerprint quality, feature extractor,
matcher) on minutiae persistence in the same
application scenario. The results of that work should
then be used in conjunction with the results of our
investigation to pinpoint the areas of concern in
automatic fingerprint recognition systems designed
to operate in such environments. Minutiae
persistence could also be evaluated in a number of
MinutiaePersistenceamongMultipleSamplesoftheSamePerson'sFingerprintinaCooperativeUserScenario
85

other fingerprint acquisition contexts (e.g.,
uncooperative user scenarios). The results would be
useful for the development of fingerprint recognition
algorithms suited to those conditions.
ACKNOWLEDGEMENTS
The authors wish to express their gratitude to the
volunteers who donated their fingerprints to our
database, without whom this investigation would not
have been possible. We would also like to thank
Vytautas Pranckenas from Neurotechnology’s
technical support team for his assistance in getting
various components of the VeriFinger 6.7 SDK up
and running. Finally, the first author wishes to
acknowledge the efforts of Robert Bowmaker,
Robert Dunn, Thomas Hahn and Maja Krivokuća in
proofreading this paper and offering constructive
criticism on its content.
REFERENCES
Biometric System Laboratory. 2006. FVC 2006
Fingerprint Verification Competition. [Online].
Available: http://bias.csr.unibo.it/fvc2006/
databases.asp. (2 December 2013).
Biometric System Laboratory. 2013. Databases. [Online].
Available:
http://biolab.csr.unibo.it/databasesoftware.asp.
[7 October 2013].
Chen, Z. & Kuo, C. H. 1991. A topology-based matching
algorithm for fingerprint authentication. In
Proceedings of the 25h Annual 1991 IEEE
International Carnahan Conference on Security
Technology. IEEE Xplore.
Fang, G., Srihari, S. N., Srinivasan, H. & Phatak, P. 2007.
Use of ridge points in partial fingerprint matching. In
Proceedings of SPIE: Biometric Technology for
Human Identification IV. SPIE.
Futronic. 2013. FS88 FIPS201/PIV Compliant USB2.0
Fingerprint Scanner. (Online). Available:
http://www.futronic-tech.com/product_fs88.html.
(2 October 2013).
Hrechak, A. K. & Mchugh, J. A. 1990. Automated
fingerprint recognition using structural matching.
Pattern Recognition, 23(8): 893-904.
Jain, A. K., Ross, A. A. & Nandakumar, K. 2011.
Fingerprint Recognition, in Introduction to Biometrics.
New York: Springer Science+Business Media LLC:
51-96.
Jea, T.-Y. & Govindaraju, V. 2005. A minutia-based
partial fingerprint recognition system. Pattern
Recognition, 38(10): 1672-1684.
Kingston, C. R. 1964. Probabilistic Analysis of Partial
Fingerprint Patterns. D.Crim. 6503017, University of
California, Berkeley.
Kryszczuk, K., Morier, P. & Drygajlo, A. 2004. Study of
the Distinctiveness of Level 2 and Level 3 Features in
Fragmentary Fingerprint Comparison, in Biometric
Authentication, edited by Maltoni, D. & Jain, A. K.
Springer Berlin Heidelberg: 124-133.
Maio, D., Maltoni, D., Cappelli, R., Wayman, J. L. & Jain,
A. K. 2002. FVC2002: Second Fingerprint
Verification Competition. In Proceedings of the 16th
International Conference on Pattern Recognition.
IEEE Xplore.
Maltoni, D., Maio, D., Jain, A. K. & Prabhakar, S. 2009a.
Fingerprint Matching, in Handbook of Fingerprint
Recognition. New York: Springer-Verlag: 167–233.
Maltoni, D., Maio, D., Jain, A. K. & Prabhakar, S. 2009b.
Introduction, in Handbook of Fingerprint Recognition.
New York: Springer-Verlag: 1-56.
Neurotechnology. 2013. VeriFinger SDK. (Online).
Available: http://www.neurotechnology.com/
verifinger. html. (25 October 2013).
Yi, C. & Jain, A. K. 2007. Dots and Incipients: Extended
Features for Partial Fingerprint Matching. In
Biometrics Symposium, 2007. IEEE Xplore.
Zhao, Q., Zhang, D., Zhang, L. & Luo, N. 2010. High
resolution partial fingerprint alignment using pore–
valley descriptors. Pattern Recognition, 43(3): 1050-
1061.
ICPRAM2014-InternationalConferenceonPatternRecognitionApplicationsandMethods
86
