
Confidence-based Rank-level Fusion for Audio-visual Person
Identification System
Mohammad Rafiqul Alam
1
, Mohammed Bennamoun
1
, Roberto Togneri
2
and Ferdous Sohel
1
1
School of Computer Science and Software Engineering, The University of Western Australia, Crawley, WA 6009, Australia
2
School of Electrical and Electronics Engineering, The University of Western Australia,
35 Striling Hwy, Crawley, WA 6009 Australia
Keywords:
Rank-Level Fusion, Audio-Visual Person Identification.
Abstract:
A multibiometric identification system establishes the identity of a person based on the biometric data pre-
sented to its sub-systems. Each sub-system compares the features extracted from the input against the tem-
plates of all identities stored in its gallery. In rank-level fusion, ranked lists from different sub-systems are
combined to reach the final decision about an identity. However, the state-of-art rank-level fusion methods
consider that all sub-systems perform equally well in any conditions. In practice, the probe data may be af-
fected by different degradations (e.g., illumination and pose variation on the face image, environmental noise
etc.) and thus affect the overall recognition accuracy. In this paper, robust confidence-based rank-level fusion
methods are proposed by using confidence measures for all participating sub-systems. Experimental results
show that the confidence-based approach of rank-level fusion achieves higher recognition rates than the state-
of-art.
1 INTRODUCTION
In the identification mode, a biometric system com-
pares the features extracted from probe data against
all the templates stored in gallery. The identity corre-
sponding to the highest score (lowest rank) is declared
as the person to whom the input biometric samples be-
long to. These types of systems, long been used for
criminal investigation, are now being used for various
other applications: computer login, physical access
control, time attendance management (Murakami and
Takahashi, 2009). Since the number of users can be
quite large, the identification task can be more chal-
lenging than verification- where a user claims an iden-
tity and the input samples are compared only against
the template(s) corresponding to the claimed identity
(Nandakumar et al., 2009).
One approach of developing accurate identifica-
tion systems is to use multiple biometric sources
(Nandakumar et al., 2009), such as the face image,
speech, fingerprint etc. Multibiometric systems can
improve the recognition accuracy as well as cover a
large number of users. Fusion in multibiometric sys-
tems has been extensively studied in the literature and
a number of fusion approaches have been proposed
(Ross et al., 2006). Rank-level fusion is considered
the only viable option (Abaza and Ross, 2009) for
systems operating in the identification mode, because
this approach does not require estimation of under-
lying distributions and avoids the normalization task
usually encountered in score-level fusion. In (Ho
et al., 1994), rank-level fusion approaches, namely
the highest rank, Borda count and logistic regression
method have been discussed. The highest rank and
Borda count methods do not use any statistical in-
formation in the fusion process, whereas the logis-
tic regression method is an extension of the Borda
count where adaptive weighting is used for different
sub-systems. Other statistical methods are the parti-
tioned observation space (POS) theory (Saranli and
Demirekler, 2001), and Bayesian rank-level fusion
(Nandakumar et al., 2009).
Incorporating a system’s confidence in the par-
ticipating sub-systems has not been well studied for
rank-level fusion. This lack of development has also
been mentioned in (Marasco and Sansone, 2011). In
(Abaza and Ross, 2009), the authors demonstrated the
benefits of using image quality information in rank-
level fusion. However, their approach uses image
quality information which is difficult to achieve for all
biometric traits. Because, incorporating quality infor-
mation requires a priori model for the corruption or
608
Rafiqul Alam M., Bennamoun M., Togneri R. and Sohel F..
Confidence-based Rank-level Fusion for Audio-visual Person Identification System.
DOI: 10.5220/0004819806080615
In Proceedings of the 3rd International Conference on Pattern Recognition Applications and Methods (ICPRAM-2014), pages 608-615
ISBN: 978-989-758-018-5
Copyright
c
2014 SCITEPRESS (Science and Technology Publications, Lda.)
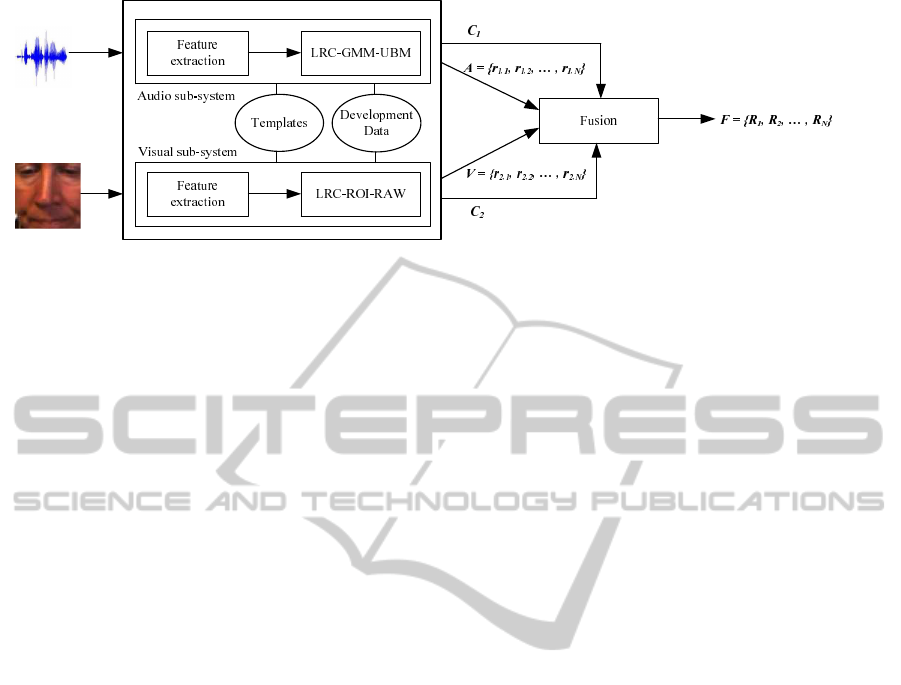
Figure 1: Block diagram of the proposed audio-visual multibiometric system. LRC-GMM-UBM and LRC-ROI-RAW are
used as the audio and visual classifier, respectively. The system outputs C
1
and C
2
values along with the ranked lists A and
V from the audio and visual sub-systems, respectively. Finally, we get the fused ranked list in F, where R
j
εF represents the
final rank of user j.
the noise of the input signal. In practice, the source
of statistical deviation is varied and difficult to model.
Therefore, for a system that uses audio-visual biomet-
rics (Figure 1), measuring the quality of face images
(video) at the signal level is difficult (Chetty and Wag-
ner, 2008).
In this paper, we present a novel confidence mea-
sure for the participating sub-systems of a multibio-
metric system. We also propose confidence-based
highest rank and Borda count fusion rules. Then, we
show that our confidence-based approach can handle
the possible ties that may occur in the highest rank
method as well as achieve better recognition rates
than the state-of-art methods, such as the modified
highest rank (Abaza and Ross, 2009) and predictor-
based Borda count (Marasco et al., 2010) methods.
In Section 2, a brief overview of the recent de-
velopments in the area of fusion in multbiometric
identification is presented. In Section 3, the highest
rank and the Borda count methods are discussed and
a lack in handling ties by the approach presented in
(Abaza and Ross, 2009) is highlighted. Our proposed
confidence-based approach is also discussed in this
section. Section 4 describes the audio-visual system
that we used to evaluate the performance of our pro-
posed approach. Experimental results are presented in
section 5 and Section 6 concludes the paper by sum-
marizing the contributions.
2 FUSION IN MULTIBIOMETRIC
IDENTIFCATION
In recent years, a number contributions have been
made in the area of fusion in multibiometric identi-
fication. We can divide the fusion approaches into
three categories based on the type of information they
use: a) match score fusion, b) rank-level fusion, and c)
hybrid rank-score fusion. The recent methods that use
match score information are based on fuzzy set theory
(Fakhar et al., 2012), require constrained genuine (im-
postor) distribution (Nandakumar et al., 2009) (Mu-
rakami and Takahashi, 2011), or a gradient descent
method to estimate the weights (Basak et al., 2010).
On the other hand, recently proposed hybrid rank-
score fusion approaches use a moment based (Alam
et al., 2013a) or a predictor based (Marasco et al.,
2010) approach. Our focus in this paper is mainly
on rank-level fusion because it offers a much simpler
and effective way of fusing multiple sub-systems of
a multibiometric system. Therefore, we briefly men-
tion a few of the recent rank-level fusion methods in
the following paragraphs.
In (Kumar and Shekhar, 2011) a non-linear ap-
proach of rank-level fusion was proposed for palm-
print recognition. In another approach (Marasco et al.,
2010), a predictor-based Borda count fusion method
was used that assigned higher weight to the ranks pro-
vided by the more accurate matcher. On the other
hand, in (Monwar and Gavrilova, 2009) the ranks of
only those identities were fused which appear in at
least two classifiers (face, ear and signature). In (Nan-
dakumar et al., 2009) a Bayesian approach of rank-
level fusion was proposed for two multibiometric sys-
tems using fingerprint impressions and face images.
However, incorporating quality (of the probe data)
information in rank-level fusion has received little at-
tention in recent years. In (Abaza and Ross, 2009),
a quality-based rank-level fusion approach was pro-
posed for multibiometric systems. They suggested
modifications to the highest rank and the Borda count
fusion methods by using a perturbation factor and
the Nanson function (Fishburn, 1990), respectively.
We analytically show that their suggested modifica-
tion may fail under some reasonable circumstances.
Confidence-basedRank-levelFusionforAudio-visualPerson
IdentificationSystem
609

Moreover, their proposed inclusion of input image
quality requires a priori model for the corruption or
the noise of the input signal. This is difficult to
achieve with the face images (Chetty and Wagner,
2008).
3 RANK-LEVEL FUSION
METHODS
Assume that there are N users enrolled in the gallery
of a multibiometric system which has M sub-systems.
Let r
m, j
be the rank of user j from the sub-system m,
where j = 1 . . . N and m = 1. . . M. The final rank R
j
of user j can be calculated using a number of rank-
level fusion methods, such as the highest rank, Borda
count, and logistic regression (Ho et al., 1994).
3.1 Highest Rank Fusion
In the highest rank method, the combined rank R
j
of user j is calculated by taking the lowest rank (r)
assigned to that user by different sub-systems. The
highest rank fusion rule is as follows:
R
j
=
M
min
m=1
r
m, j
, (1)
which is equivalent to applying the max rule of fusion.
Ho et al. (Ho et al., 1994) proposed that ties be-
tween users be broken randomly. On the other hand,
in (Abaza and Ross, 2009) perturbation factor, ε, was
introduced:
R
j
=
M
min
m=1
r
m, j
+ ε
j
, (2)
where,
ε
j
=
M
∑
m=1
r
m, j
K
. (3)
The perturbation term biases the fused rank by con-
sidering all the ranks associated with user j, by as-
suming a large value for K.
However, the modified highest rank fusion in (2)
can also produce a tie if
M
∑
m=1
r
m, j
is equal for two users.
For example, assume that the ranks for a user ( j = 1)
from the two sub-systems of a multibiometric system
are r
1,1
= 1 and r
2,1
= 2, while for another user ( j =
2), consider r
1,2
= 2 and r
2,2
= 1. Then, (1) gives
R
1
= 1 and R
2
= 1, and (2) gives R
1
= 1.03 and R
2
=
1.03, when K = 100 as in (Abaza and Ross, 2009).
3.2 Borda Count Rank Fusion
In the Borda count method, fused rank is calculated
by taking the sum of the ranks produced by individual
sub-systems for user j. The Borda count fusion rule
is as follows:
R
j
=
M
∑
m=1
r
m, j
. (4)
The Borda count method accounts for the variability
in ranks due to the use of a large number of classi-
fiers. The major disadvantage of this method is that it
assumes all the classifiers are statistically independent
and perform equally well.
In practice, a particular classifier (sub-system)
may perform poorly due to various reasons, such as
the quality of the probe data, quality of the templates
in gallery etc. In (Abaza and Ross, 2009), a method,
also known as the Nanson function (Fishburn, 1990),
was used to eliminate the worst rank for a user:
M
max
m=1
r
m, j
= 0. (5)
This can be extended by eliminating the lowest rank k
times before applying the Borda count on remaining
ranks.
Another quality-based approach was proposed in
the same paper (Abaza and Ross, 2009) with the in-
clusion of input image quality in Borda count method
as follows:
R
j
=
M
∑
m=1
Q
m, j
.r
m, j
, (6)
where, Q
m, j
= min(Q
m
, Q
j
), and Q
m
and Q
j
are the
quality factors of the probe and gallery fingerprint im-
pressions, respectively.
In another approach (Marasco et al., 2010), the fi-
nal rank for each user was calculated as the weighted
sum of individual ranks assigned by M sub-systems.
A higher weight was assigned to the ranks provided
by the more accurate sub-system:
R
j
=
M
∑
m=1
w
m
.r
m, j
, (7)
where, w
m
is the assigned weight for sub-system m.
An additional training phase was used for determining
the weights.
3.3 Proposed Confidence based Rank
Fusion
It is a well known fact that the matching scores pro-
duced by the classifier of an individual sub-system ex-
hibit the following trend: the matching score associ-
ated with the most likely identity will be much higher
ICPRAM2014-InternationalConferenceonPatternRecognitionApplicationsandMethods
610

than the matching scores of for other identities. Simi-
larly, if a poor quality probe is presented to the system
then the matching score associated with all the identi-
ties are relatively closer (i.e., the variance is smaller).
In (Alam et al., 2013a), a demonstration of this fact
was presented. They also showed that the quality of
input probe effects the ranked lists produced by the
classifiers. This information can be consolidated into
the rank-level fusion rules, such as the highest rank
and Borda count fusion rules.
We propose a novel confidence measure for the
sub-systems of a multibiometric system as follows:
C
m
=
|s
1
m
− µ
m
|
µ
m
.max(C
D
m
)
, (8)
where, C
D
m
is the set of confidence measures for sub-
system m calculated as
|s
1
m
−µ
m
|
µ
m
using the development
data (D). Moreover, s
1
m
represents the highest match-
ing score and µ
m
is the mean of the k − 1 subsequent
matching scores. The value of µ
m
can be calculated
as:
µ
m
=
1
k − 1
k
∑
n=2
s
n
m
, (9)
where, 2 ≤ k ≤ N, s
n
m
represents the nth highest score.
A higher value of C
m
refers to a strong classifica-
tion (i.e., clean probe data), and a smaller value of C
m
refers to a weak classification (i.e., degraded probe
data). Therefore, we can modify the highest rank and
the Borda count fusion rules to include the C
m
values.
3.3.1 Confidence-b ased Highest Rank Fusion
The confidence measures obtained using (8) and (9)
can be consolidated into a confidence-based highest
rank fusion rule as follows:
R
j
=
M
min
m=1
r
m, j
+ c
j
(10)
where the term c
j
is the confidence factor which can
be calculated as follows:
c
j
=
M
∑
m=1
C
m
.r
m, j
M
∑
m=1
r
m, j
(11)
We use this novel confidence factor (c
j
) so that
the ranks produced by a more confident classifier get
more emphasis. The denominator in (11) transforms
the confidence factor for a user ( j) into the range
[0, 1]. For example, the confidence measure C
1
for
a sub-system, m = 1, is 0.3 and C
2
for another sub-
system, m = 2, is 0.9. Let r
1,1
= 1, r
2,1
= 2, r
1,2
= 2,
and r
2,2
= 1. By using (10) and (11), we get R
1
= 1 +
(0.3×1)+(0.9×2)
(1+2)
= 1.7 and R
2
= 1 +
(0.3×2)+(0.9×1)
(1+2)
=
1.5. Thus, not only a tie between the final ranks of the
users j = 1 and j = 2 is avoided but also the ranking
of the more confident classifier is emphasized.
3.3.2 Confidence-based Borda Count Fusion
The Borda count method in (4) can be modified to
include the confidence measure:
R
j
=
M
∑
m=1
C
m
.r
m, j
(12)
The proposed confidence-based Borda count fusion
rule is indeed the numerator of (11) and similar to the
quality based Borda count fusion in (Abaza and Ross,
2009). Here, instead of quality measures for the probe
data we propose to use confidence measures for the
classifiers. The main idea is to give more emphasis to
the ranking from a more confident classifier.
4 DATABASE, FEATURES AND
CLASSIFIERS
4.1 AusTalk Database
We used a new audio-visual database, namely the
AusTalk (Burnham et al., 2011), in our experi-
ments. Since the database is still growing, we
used an audio-visual dataset of 248 users that was
recorded at different university campuses across Aus-
tralia. The database contains twelve random utter-
ances (e.g., “0123”, “9420”, “6785”, “1230”, “7856”,
“2094”, “2301”, “4902”, “8567”, “3012”, “5678”,
and “0429”) of different combinations of 4-digit num-
bers from each user. We divided the dataset into three
parts: training (T ), development (D), and evaluation
(E) to contain the first six, seventh and eighth, and the
last four utterances from each user, respectively. Tem-
plates were built using the training data, whereas the
development data were used to generate the weights
w
m
in (7) and the fusion parameter (C
D
m
) in (8).
4.2 Audio Features
We extracted the Mel-Frequency spaced Cepstral Co-
efficients (MFCCs) (Togneri and Pullella, 2011) from
speech signal. First, a Fast Fourier Transform (FFT)
operation was performed on each uniformly spaced
frame in the speech signal to obtain the complex spec-
tral values. A logarithmic smoothing operation using
a Mel scale was performed to convert the complex
spectral values to K filter bank values. These K values
Confidence-basedRank-levelFusionforAudio-visualPerson
IdentificationSystem
611
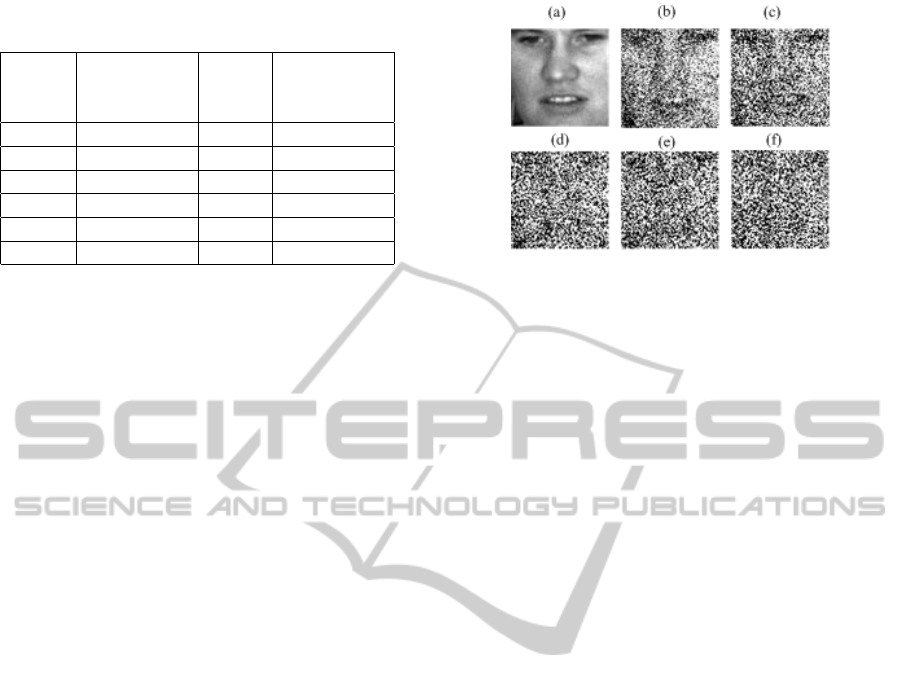
Table 1: Audio and visual sub-system performance under
various noise levels.
Audio Recognition Visual Recognition
noise rate (%) noise rate (%)
(SNR) (σ
2
)
clean 98.79 clean 97.38
30dB 71.63 0.1 96.63
24dB 41.86 0.3 82.66
18dB 15.92 0.5 51.74
12dB 3.69 0.7 32.39
6dB 1.20 0.9 22.04
were then converted to L cepstral co-efficients using
the Discrete Cosine Transformation (DCT). L = 12
MFCCs were extracted per frame which comprised
the feature vector for that frame. Then, Cepstral Mean
Normalization (CMN) was applied to compensate for
the channel variabilities, and delta and acceleration
coefficients were computed to capture the temporal
dynamics in speech. These parameters were then aug-
mented with the 13 dimensional MFCCs, including c
0
which represents the log-power of the frame . Thus,
a 39-dimensional (l = 39) feature vector (MFCC +
delta + acceleration) was created from each frame of
a speech signal. Since an utterance from a speaker
can be of variable duration (t), the size of the feature
vector (l ×t) for an utterance was also not fixed.
4.3 Visual Features
The visual data in AusTalk was captured using a
BumlbleBee 2 stereo vision camera; therefore, we
used the image frames from the video of the left cam-
era. The eyes region were detected on each image
frame by using the method in (Castrill’on-Santana
et al., 2008). Then, a gray-scale d × d (i.e. d is the
width of the eyes region) face window was cropped
out of each valid frame. Down sampled face images
(40 × 40 pixels) were used as features for a Linear
Regression-based Classifier (LRC).
4.4 Classifiers
We used the LRC-GMM-UBM and LRC-ROI-RAW
frameworks as the classifiers of the audio and visual
sub-systems, respectively. The main concept of these
classifiers is that the samples from a specific user lie
on a linear subspace and therefore the task of person
identification is considered a linear regression prob-
lem (Naseem et al., 2010).
In the LRC-GMM-UBM, a Universal Background
Model (UBM) was trained using all (l × t) features
from the training utterances over all speaker. Then
Figure 2: Impact of AWGN on face image at different vari-
ance levels: (a) σ
2
= 0, (b) σ
2
= 0.1, (c) σ
2
= 0.3 (d)
σ
2
= 0.5 (e) σ
2
= 0.7 (f) σ
2
= 0.9.
an utterance of a speaker was used to adapt Gaus-
sian Mixture Models (GMMs) from the UBM, also
known as the GMM-UBM. Finally, the means from
the GMM-UBM were concatenated to form a super-
vector of length (m × l), where m (=128 in our ex-
periments) is the number of GMM mixtures. Then,
speaker-specific templates were created stacking the
q (= l × m) dimensional feature vectors from the
training utterances. Similarly, in the LRC-ROI-RAW
framework, user-specific templates were created by
stacking the feature vectors obtained from downsam-
pled raw face images.
In the test phase, a feature vector was first ex-
tracted from the probe; then, a response vector was
predicted based on the principal that the test feature
vector should be represented as a linear combination
of the template of the correct user. Finally, the eu-
clidean distance between the test feature vector and a
predicted response vector was used as matching score.
The template getting the smallest matching score was
declared as the winner. Detailed descriptions of these
classifiers can be found in (Alam et al., 2013b).
5 EXPERIMENTS, RESULTS AND
ANALYSIS
5.1 Experimental Setup
We carried a number of experiments to evaluate the
performance of the proposed confidence-based rank-
level fusion methods:
• Firstly, we studied the variability of the proposed
confidence measure in (8) with respect to false and
correct recognition scenarios.
• Then, we evaluated the performance of the pro-
posed confidence-based rank-level fusion under
different noise conditions.
ICPRAM2014-InternationalConferenceonPatternRecognitionApplicationsandMethods
612
• Finally, we compared the performance of our
proposed method with the modified highest rank
(Abaza and Ross, 2009) and predictor-based
Borda count (Marasco et al., 2010).
Since the AusTalk data was recorded under con-
trolled room environment, we used the Additive
White Gaussian Noise (AWGN) for data degradation.
In face recognition, AWGN is also referred to as the
detector noise (Naseem et al., 2012) and is always
an important case-study in the context of robustness
(Nakamura, 2005). In FIgure 2, the impact of adding
AWGN to face images is shown. On the other hand,
AWGN has been frequently used in the literature of
speech recognition systems for robustness tests. In
Table 1, the performance of individual sub-system is
shown for different noise conditions.
The weights w
m
in (7) were computed using the
development set (D) compared against the training set
(T ). The ratio between correct identification and the
total number of probes (Marasco et al., 2010) as deter-
mined by the sub-system classifiers (i.e., LRC-GMM-
UBM and LRC-ROI-RAW) were used as weights.
In our predictor-based experiments, the audio sub-
system weight w
1
= 0.98 and the visual sub-system
weight w
2
= 0.97. We use cumulative match char-
acteristics (CMC) curves to compare the recognition
performance of different methods.
5.2 Results and Analysis
We used the development (D) data to calculate
max(C
D
m
) and the evaluation (E) data to evaluate the
proposed confidence measure. We found that C
D
audio
=
0.33 and C
D
f ace
= 0.88. Out of 248 ∗ 4 = 992 audio-
visual tests under clean conditions and by setting k =
5 in (9), the LRC-ROI-RAW classifier failed to cor-
rectly identify on 25 occasions and the LRC-GMM-
UBM classifier failed on 13 occasions. The confi-
dence measures obtained from 200 correct recogni-
tion instances are displayed for clarity of presenta-
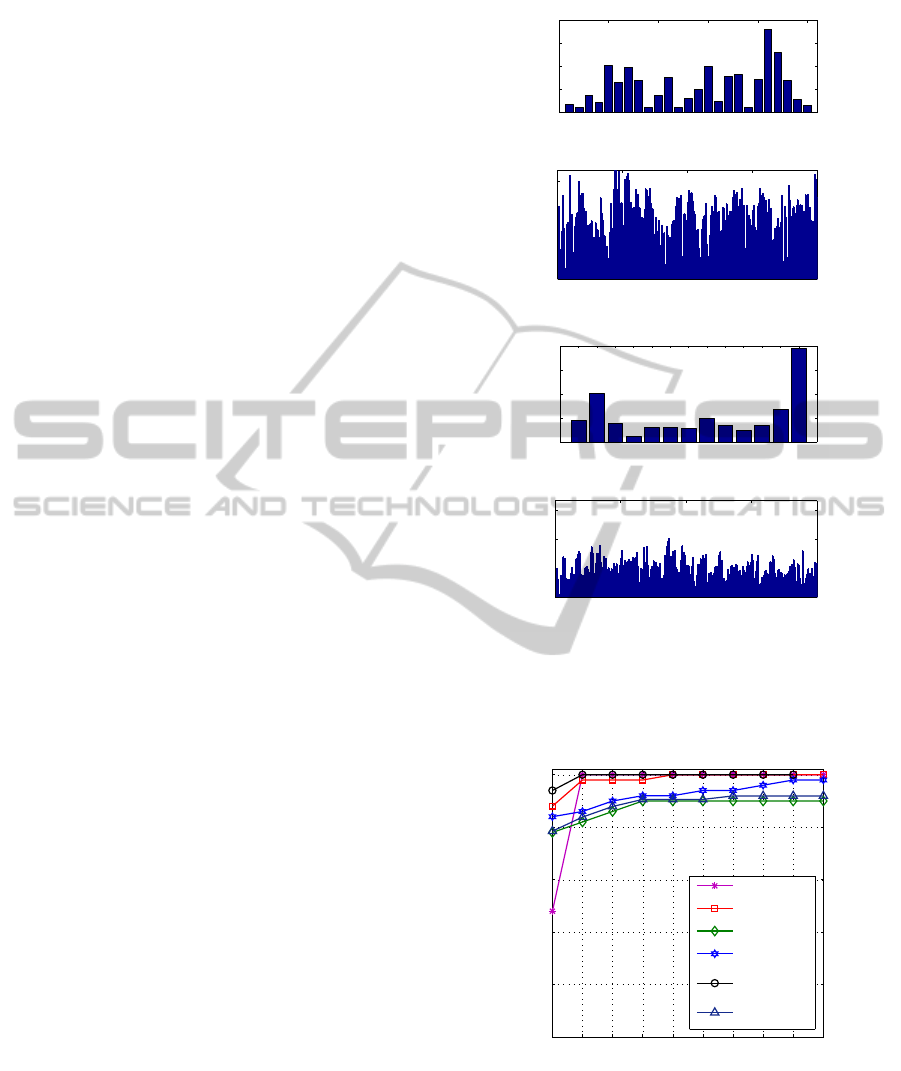
tion. In Figure 3, evaluation of the proposed con-
fidence measure in (8) is presented. It can be seen
that the confidence measure is high whenever a sub-
system makes a correct decision and the confidence
measure is low when it makes a false recognition.
In Figure 4, the CMC of different rank-level fu-
sion methods is presented under clean conditions. It
can be seen that our proposed confidence-based high-
est rank method (10) achieved higher rank 1 recog-
nition rate compared to the highest rank fusion in
its original form (1), and the modified form (2) in
(Abaza and Ross, 2009). Similarly, the proposed
confidence-based Borda count (12) performed consis-
tently better than the Borda count in its original form
0 5 10 15 20 25
0
0.1
0.2
0.3
0.4
False Recognition
C
1
(a)
0 50 100 150 200
0
0.3
0.6
0.9
1
Correct Recognition
C
1
(b)
1 2 3 4 5 6 7 8 9 10 11 12 13
0
0.05
0.1
0.15
0.2
False Recognition
C
2
(c)
0 50 100 150 200
0
0.3
0.6
0.9
1
Correct Recognition
C
2
(d)
Figure 3: Evaluation of the confidence measures for the au-
dio (C
1
) and visual (C
2
) sub-systems using the development
data. The horizontal axis shows the number of (correct /
false) recognition instances and the vertical axis shows the
corresponding confidence measures.
1 2 3 4 5 6 7 8 9 10
0.95
0.96
0.97
0.98
0.99
1
Rank
Recognition Rate
highest rank (1)
modified
highest rank (2)
Borda count (4)
confidence based
Borda count (12)
confidence based
highest rank (10)
predictor−based
Borda count (7)
Figure 4: CMC curve for different methods when probes
(speech and face image) are clean.
(4) and the predictor-based Borda count (Marasco
et al., 2010). This is because, the use of confidence
measures makes sure that the ranks from more confi-
dent classifier get more emphasis.
Then, we tested the system considering mild noise
Confidence-basedRank-levelFusionforAudio-visualPerson
IdentificationSystem
613
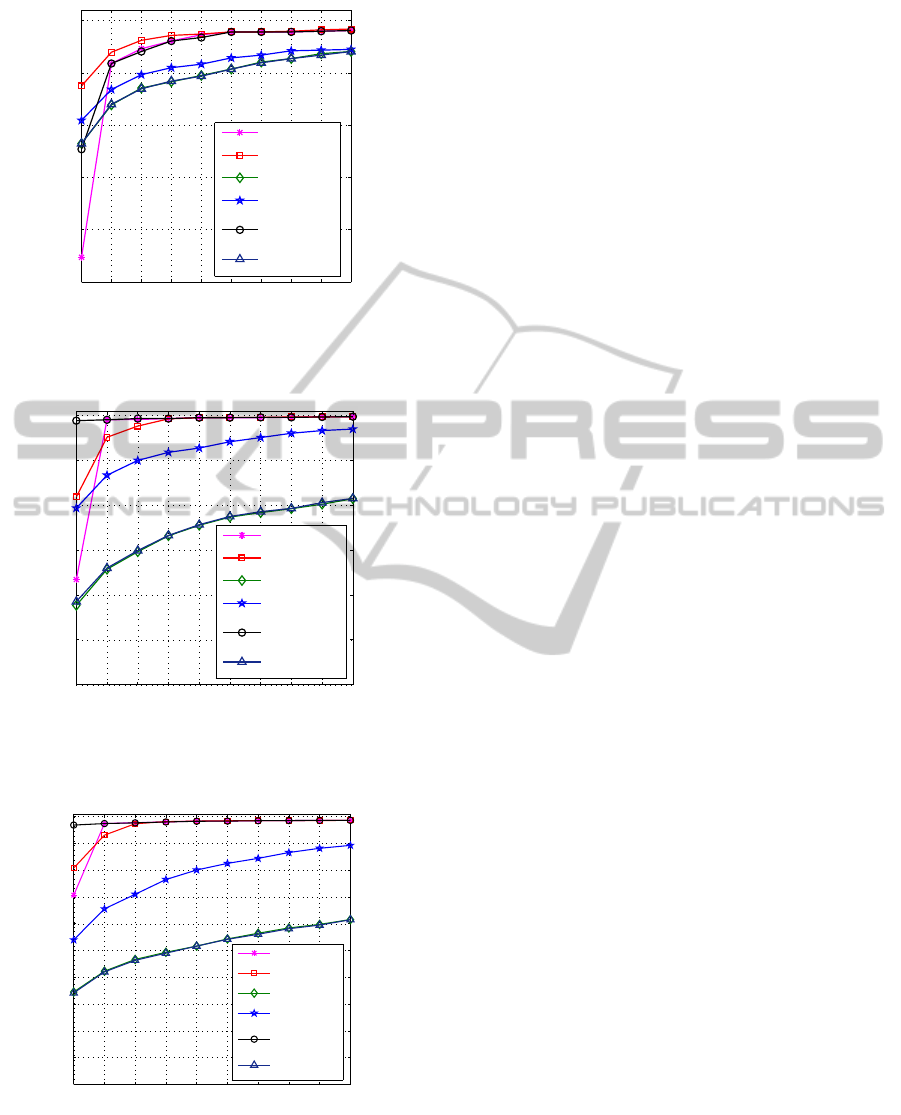
1 2 3 4 5 6 7 8 9 10
0.75
0.8
0.85
0.9
0.95
1
Rank
Recognition Rate
highest rank (1)
modified
highest rank (2)
Borda count (4)
confidence based
Borda count (12)
confidence based
highest rank (10)
predictor−based
Borda count (7)
Figure 5: CMC curve for different methods with AWGN at
SNR=30dB on the speech and σ
2
= 0.3 on the face image
presented as probes.
1 2 3 4 5 6 7 8 9 10
0.4
0.5
0.6
0.7
0.8
0.9
1
Rank
Recognition Rate
highest rank (1)
modified
highest rank (2)
Borda count (4)
confidence based
Borda count (12)
confidence based
highest rank (10)
predictor−based
Borda count (7)
Figure 6: CMC curve for different methods with clean
speech data and AWGN at σ
2
= 0.9 on the face image pre-
sented as probes.
1 2 3 4 5 6 7 8 9 10
0
0.1
0.2
0.3
0.4
0.5
0.6
0.7
0.8
0.9
1
Rank
Recognition Rate
highest rank (1)
modofied
highest rank (2)
Borda count (4)
confidence based
Borda count (12)
confidence based
highest rank (10)
predictor−based
Borda count (7)
Figure 7: CMC curve for different methods with AWGN at
SNR = 12dB on speech data and clean face image presented
as probes.
(i.e., SNR = 30dB on speech and σ
2
= 0.3 on face
image). Surprisingly, the rank-1 recognition of the
modified highest rank fusion method (2) in (Abaza
and Ross, 2009) was higher than the confidence-
based highest rank method. Otherwise, both meth-
ods achieved comparable (rank-2 to rank-10) recog-
nition rates. On the other hand, the benefit of using
confidence-based Borda count was consistent over all
rank (rank-1 to rank-10) considered.
The true benefits of using confidence-based rank-
level fusion was observed when one of the traits was
severely degraded. For example, Figure 6 shows the
CMC for clean speech and AWGN of σ
2
= 0.9 on face
image. In contrast, Figure 7 shows the CMC for clean
face image and AWGN of SNR = 12dB on speech
data. On both occasions, the rank-1 recognition rate
obtained using the confidence-based highest rank fu-
sion was significantly better (≥ 15 %) than the orig-
inal highest rank (1) and the modified highest rank
(2) in (Abaza and Ross, 2009). On the other hand, the
performance improvement by using confidence-based
Borda count method was ≥ 20% for all rank levels
(rank-1 to rank-10). Therefore, the confidence-based
rank-level fusion clearly improves the recognition ac-
curacy of a multiobiometric system. Another inter-
esting observation is that the predictor-based Borda
count method (Marasco et al., 2010) does not improve
recognition performance if there is noise on probe
data because the predictor-based method uses fixed
weights for the participating sub-systems.
6 CONCLUSIONS
In this paper, we proposed a novel confidence-based
rank-level fusion approach. Although the confidence
measures for the classifiers of the sub-systems were
calculated from the top k matching scores, one can use
confidence measures calculated from other sources
and use with our proposed rank-level fusion meth-
ods. Huge gain (≥20%) in recognition accuracy was
achieved for the Borda count method when one of
the sub-system suffered a high level of noise. On
the other hand, the performance improvement in rank
1 recognition accuracy of the highest rank fusion
was also large (≥15%). Moreover, the proposed
confidence-based highest rank approach can handle
ties better than the existing approach that uses a per-
turbation factor.
ACKNOWLEDGEMENTS
This research is partially supported by Aus-
tralian Research Council grants DP110103336 and
DE120102960.
ICPRAM2014-InternationalConferenceonPatternRecognitionApplicationsandMethods
614

REFERENCES
Abaza, A. and Ross, A. (2009). Quality based rank-level
fusion in multibiometric systems. In Biometrics: The-
ory, Applications, and Systems, 2009. BTAS’09. IEEE
3rd International Conference on, pages 1–6. IEEE.
Alam, M. R., Bennamoun, M., Togneri, R., and Sohel, F.
(2013a). An efficient reliability estimation technique
for audio-visual person identification. In Industrial
Electronics and Applications (ICIEA), 2013 8th IEEE
Conference on, pages 1631–1635. IEEE.
Alam, M. R., Togneri, R., Sohel, F., Bennamoun, M., and
Naseem, I. (2013b). Linear regression-based classifier
for audio visual person identification. In Communica-
tions, Signal Processing, and their Applications (ICC-
SPA), 2013 1st International Conference on, pages 1–
5. IEEE.
Basak, J., Kate, K., Tyagi, V., and Ratha, N. (2010). A
gradient descent approach for multi-modal biometric
identification. In Pattern Recognition (ICPR), 2010
20th International Conference on, pages 1322–1325.
IEEE.
Burnham, D., Estival, D., Fazio, S., Viethen, J., Cox, F.,
Dale, R., Cassidy, S., Epps, J., Togneri, R., Wag-
ner, M., et al. (2011). Building an audio-visual
corpus of australian english: large corpus collection
with an economical portable and replicable black box.
In Twelfth Annual Conference of the International
Speech Communication Association.
Castrill’on-Santana, M., D’eniz-Su’arez, O., Ant’on-
Canal’is, L., and Lorenzo-Navarro, J. (2008). Face
and facial feature detection evaluation performance
evaluation of public domain haar detectors for face
and facial feature detection.
Chetty, G. and Wagner, M. (2008). Robust face-voice based
speaker identity verification using multilevel fusion.
Image and Vision Computing, 26(9):1249–1260.
Fakhar, K., El Aroussi, M., Saidi, M. N., and Aboutajdine,
D. (2012). Score fusion in multibiometric identifica-
tion based on fuzzy set theory. In Image and Signal
Processing, pages 261–268. Springer.
Fishburn, P. (1990). A note on a note on nanson’s rule.
Public Choice, 64(1):101–102.
Ho, T. K., Hull, J. J., and Srihari, S. N. (1994). Deci-
sion combination in multiple classifier systems. Pat-
tern Analysis and Machine Intelligence, IEEE Trans-
actions on, 16(1):66–75.
Kumar, A. and Shekhar, S. (2011). Personal identifica-
tion using multibiometrics rank-level fusion. Systems,
Man, and Cybernetics, Part C: Applications and Re-
views, IEEE Transactions on, 41(5):743–752.
Marasco, E., Ross, A., and Sansone, C. (2010). Predicting
identification errors in a multibiometric system based
on ranks and scores. In Biometrics: Theory Applica-
tions and Systems (BTAS), 2010 Fourth IEEE Interna-
tional Conference on, pages 1–6. IEEE.
Marasco, E. and Sansone, C. (2011). An experimental
comparison of different methods for combining bio-
metric identification systems. In Image Analysis and
Processing–ICIAP 2011, pages 255–264. Springer.
Monwar, M. M. and Gavrilova, M. L. (2009). Multimodal
biometric system using rank-level fusion approach.
Systems, Man, and Cybernetics, Part B: Cybernetics,
IEEE Transactions on, 39(4):867–878.
Murakami, T. and Takahashi, K. (2009). Accuracy improve-
ment with high convenience in biometric identifica-
tion using multihypothesis sequential probability ra-
tio test. In Information Forensics and Security, 2009.
WIFS 2009. First IEEE International Workshop on,
pages 66–70. IEEE.
Murakami, T. and Takahashi, K. (2011). Fast and accurate
biometric identification using score level indexing and
fusion. In Biometrics (IJCB), 2011 International Joint
Conference on, pages 1–8. IEEE.
Nakamura, J. (2005). Image sensors and signal processing
for digital still cameras. CRC Press.
Nandakumar, K., Jain, A. K., and Ross, A. (2009). Fusion
in multibiometric identification systems: What about
the missing data? In Advances in Biometrics, pages
743–752. Springer.
Naseem, I., Togneri, R., and Bennamoun, M. (2010). Lin-
ear regression for face recognition. Pattern Analy-
sis and Machine Intelligence, IEEE Transactions on,
32(11):2106–2112.
Naseem, I., Togneri, R., and Bennamoun, M. (2012). Ro-
bust regression for face recognition. Pattern Recogni-
tion, 45(1):104–118.
Ross, A., Nandakumar, K., and Jain, A. (2006). Handbook
of multibiometrics, volume 6. Springer.
Saranli, A. and Demirekler, M. (2001). A statistical unified
framework for rank-based multiple classifier decision
combination. Pattern Recognition, 34(4):865–884.
Togneri, R. and Pullella, D. (2011). An overview of speaker
identification: Accuracy and robustness issues. Cir-
cuits and Systems Magazine, IEEE, 11(2):23–61.
Confidence-basedRank-levelFusionforAudio-visualPerson
IdentificationSystem
615
