
Benchmarking Binarisation Techniques for 2D Fiducial Marker Tracking
Yves Rangoni and Eric Ras
Public Research Centre Henri Tudor, 29 Avenue J. F. Kennedy, L-1855 Luxembourg-Kirchberg, Luxembourg
Keywords:
Binarisation, Tangible User Interface, Object Tracking, 2D Marker Recognition, Computer Vision Frame-
work, Benchmark.
Abstract:
This paper proposes a comparative study of different binarisation techniques for 2D fiducial marker track-
ing. The application domain is the recognition of objects for Tangible User Interface (TUI) using a tabletop
solution. In this case, the common technique is to use markers, attached to the objects, which can be identi-
fied using camera-based pattern recognition techniques. Among the different operations that lead to a good
recognition of these markers, the step of binarisation of greyscale image is the most critical one. We propose
to investigate how this important step can be improved not only in terms of quality but also in term of com-
putational efficiency. State-of-the-art thresholding techniques are benchmarked on this challenging task. A
real-world tabletop TUI is used to perform an objective and goal oriented evaluation through the ReacTIVi-
sion framework. A computational efficient implementation of one of the best window-based thresholders is
proposed in order to satisfy the real-time processing of a video stream. The experimental results reveal that
an improvement of up to 10 points of the fiducial tracking recognition rate can be reached when selecting the
right thresholder over the embedded method while being more robust and still remaining time-efficient.
1 INTRODUCTION
Binarisation is a process that converts an image
from colour or greyscale space to a black-and-white
representation called a binary image. Many opti-
cal recognition solutions need this technique as a
pre-processing to improve the chances of successful
recognition.
It is a challenging task that occurs quite early in
a recognition stream (Lee et al., 1990), so that, fail-
ing at this step has generally irreversible effects on
the next steps. Sometimes, in the worst case, binari-
sation becomes essential when the following steps of
the recognition can only work on binary images. In
other cases, binarisation is in fact similar to segmen-
tation, and is also a crucial task to tackle.
Among the different application domains, binari-
sation has ever been a challenging problem, for exam-
ple in optical music recognition (Ashley et al., 2007),
or document image analysis (Trier and Taxt, 1995),
(Sezgin and Sankur, 2004). It is still a relevant re-
search area in image video and computer vision appli-
cations (Saini et al., 2012) and widely applied in fields
like medical, remote sensing and image retrieval.
In this paper, the application is the tracking of 2D
marker fiducials on a tabletop Tangible User Inter-
face (TUI). They are designed to allow users to in-
teract with digital information through the physical
environment respectively physical objects called tan-
gibles. There are many situations where using physi-
cal objects is still more intuitive than classical com-
puter devices, especially for situations where tasks
are solved collaboratively, i.e., multiple access point
can be provided to a team of users by a multitude of
physical objects. The aim of a TUI is then to go be-
yond the WIMP “Windows, Icons, Menus & Point-
ers” paradigm (van Dam, 1997), which is currently
the classical way for interacting with computers. The
state of the art proposes several frameworks and sys-
tems for interacting through the physical environment
while maintaining a coupling with a digital model
(Ishii, 2008), (Dunser et al., 2010), (Ullmer and Ishii,
2001).
To be able to deploy such an interactive user in-
terface, a specific hardware and software framework
must be designed. One of the most common ways for
tracking the physical objects is to use computer vi-
sion methods on specific fiducial markers attached to
the physical objects.
The issue raised in this paper is then quite close
to the 2D-matrix QR barcodes detection (Chen et al.,
2012), with the extra constraints of real-time process-
ing and accurate position and rotation angle detection.
For a fast and robust tracking, especially on table-
616
Rangoni Y. and Ras E..
Benchmarking Binarisation Techniques for 2D Fiducial Marker Tracking.
DOI: 10.5220/0004820706160623
In Proceedings of the 3rd International Conference on Pattern Recognition Applications and Methods (ICPRAM-2014), pages 616-623
ISBN: 978-989-758-018-5
Copyright
c
2014 SCITEPRESS (Science and Technology Publications, Lda.)
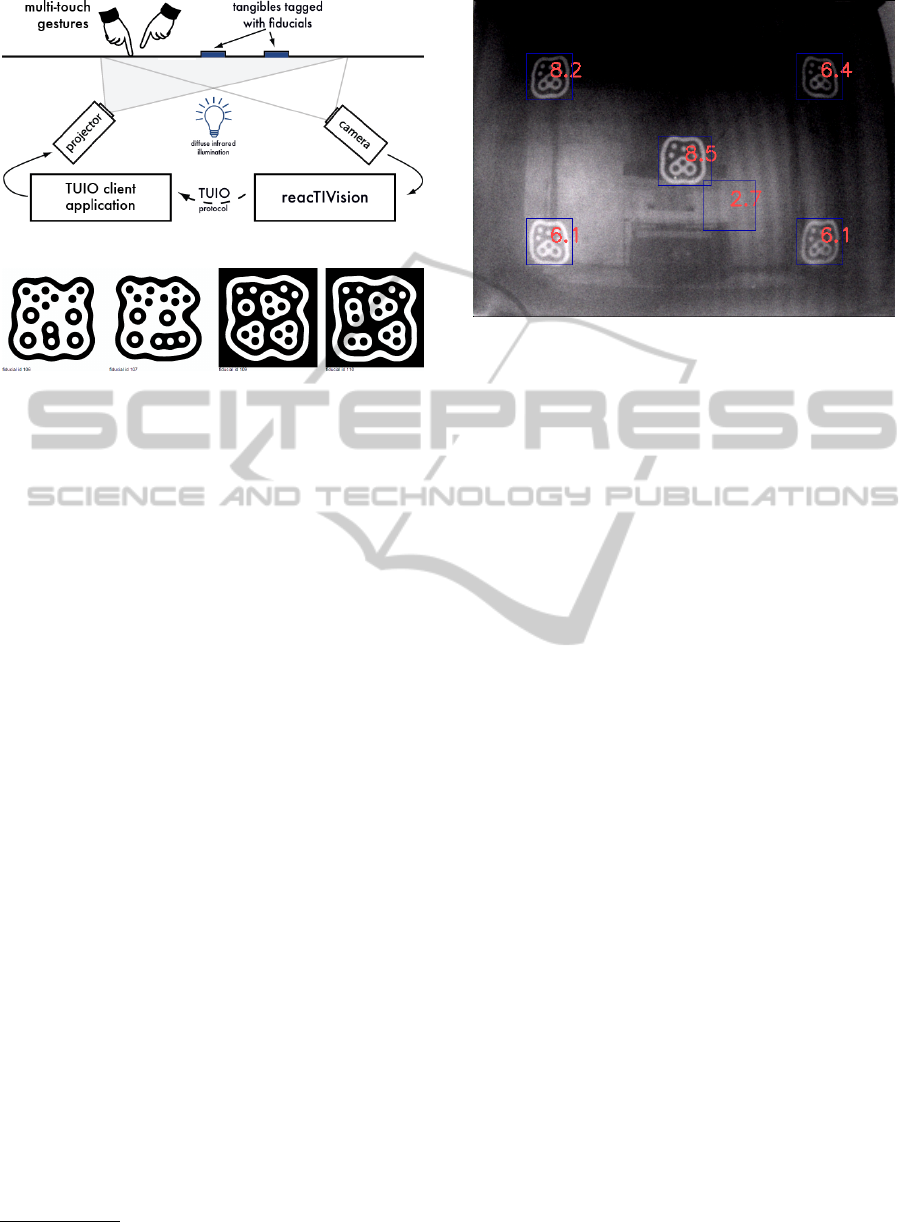
Figure 1: ReacTIVision framework diagram
0
.
Figure 2: Some samples of fiducial markers from ReacTIVi-
sion
0
.
top TUI, a good technical solution consists in a
method called “diffuse illumination” as proposed in
(Kaltenbrunner et al., 2006). It considers to evenly
distributing light in the space underneath the table
top. This diffuse light shines through a frosted acrylic
glass pane on the table top (Fig. 1).
Special patterns are usually printed on the bottom
of the objects (Fig. 2). When an object is on the table,
the marker and the glass pane are facing each other,
and the marker can be recognised by the tracking sys-
tem by transparency.
The 2D markers reflect the infra-red light back
through the glass surface to the inner bottom of the
table where a camera records the image (Fig. 3)
The frosted acrylic glass is translucent, which
means on the one hand transparent enough to allow
the camera seeing the black and white symbols, and
on the other hand opaque enough to display some vi-
sual feedback on the surface from a video projector.
The camera has an infra-red pass through filter and
a wide angle lens. It captures almost the entire surface
while blocking out visible light. The segmentation
marker/non-marker is then much easier to process, for
example image from the video projector, which is a
noise for marker tracking, is not captured by the mod-
ified camera.
This kind of set-up has already been developed by
us (Maquil and Ras, 2012). It will be described in
Section 4, and is used for experimentation in this pa-
per.
It exists several optical marker tracking systems
such as ARToolKit (Kato and Billinghurst, 1999) or
D-touch system of (Costanza and Robinson, 2003),
0
http://reactivision.sourceforge.net
Figure 3: Example of an image of five markers acquired
by an IR camera. (Note: This image has been enhanced
in terms of contrast and luminosity to improve readability
when printed or accessed electronically. The original raw
image has a very tight tonal range (numbers in red)).
but some studies (X. Zhang, 2002) show that they per-
form slowly when the image’s size increase.
The contribution of this paper is to enhance the
recognition method proposed by (Bencina et al.,
2005) by means of tuning the binarisation method,
which will give the best input for the “topological re-
gion adjacency based fiducial recognition” introduced
by the previous cited authors.
The paper is organised as follows: First, a con-
cise survey to marker recognition is introduced. Sec-
ond, the different benchmarked binarisation methods
are described. Then, after describing the experimental
set-up, results of the binarisation benchmarking will
be discussed in Section 5. Finally, just before con-
cluding, a section on fast and concrete implementa-
tion is exposed.
2 MARKER RECOGNITION
This section explains how the recognition system
works. It is stated that the method presented here is
the best trade-off of the available state-of-the-practice
technologies. The binarisation efficiency will be eval-
uated through the results of this recognition method,
i.e. a good binarisation is a binarisation that decreases
the error rate. We emphasize that the evaluation is
goal-oriented and context dependent, but we can at
least propose a fair and quantifiable metric, contrary
to subjective or global approaches (Leedham et al.,
2002) which have been discarded on purpose.
The topological region adjacency-based fiducial
recognition of (Bencina et al., 2005) constructs a re-
gion adjacency graph from a binary image through a
BenchmarkingBinarisationTechniquesfor2DFiducialMarkerTracking
617
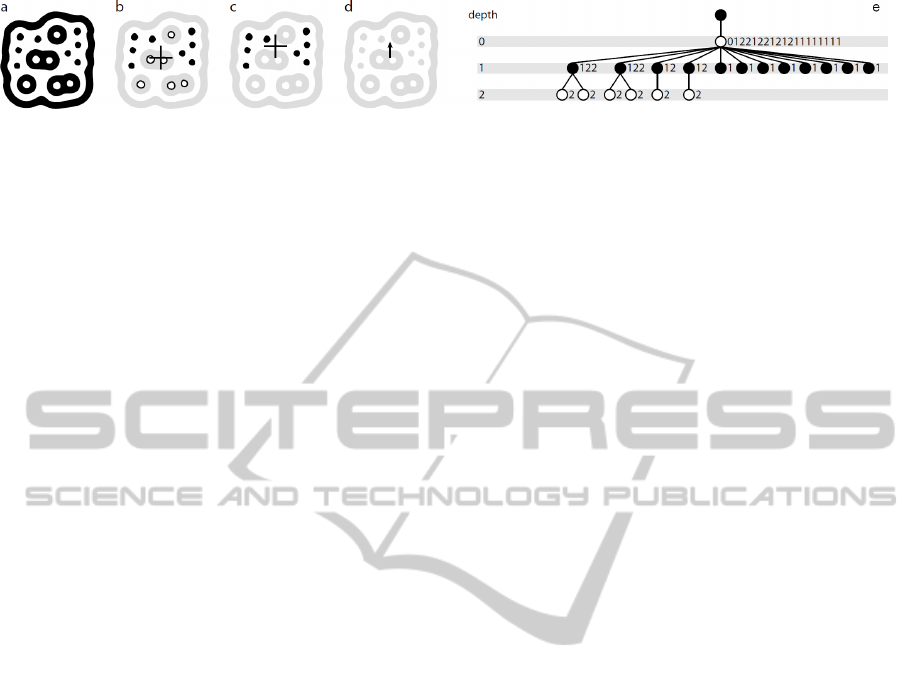
Figure 4: (a) ReacTIVision fiducial, (b) black and white leafs and their average centroid, (c) black leafs and their average
centroid, (d) vector used to deduce fiducial’s orientation, (e) corresponding left heavy depth sequence (Bencina et al., 2005).
process of segmentation. It basically describes the hi-
erarchy of the image as a tree of transitions between
white and black blobs and vice-versa. In this un-
ordered rooted tree, the image regions can be seen
as Russian dolls. The data structure that stores the
tree is highly efficient; all the basic operations are in
O(log(n)) time complexity and O(n) space complex-
ity (Cormen et al., 2001).
The symbols use also a predefined topology of
black and white regions (Fig. 4a). The fiducial tree
generation makes use of the number of nodes, max-
imum depth, and number of black and white leaves
(Fig. 4b) to create a set of unique identifiers. The
effective drawing of a marker is performed by a ge-
netic algorithm which takes also into account the
space between regions and the location of the cen-
troids (Fig. 4c). The orientation is deduced from the
two centroids (Fig. 4d).
The recognition then consists in finding sub-
graphs in the region adjacency graph that have ex-
actly the same “encoding” than those of the gener-
ated markers. In the ReacTIVision framework, the
method of (Asai et al., 2003), the left heavy depth se-
quence (Fig. 4e), has been used to perform the sub-
graph scanning.
It can be easily understood that the method works
and is efficient if and only if the input image is to-
tally clean. In practice, only one pixel which breaks a
region will produce a completely different adjacency
graph than the one expected. Any salt-and-pepper
noise is likely to add leafs to the graph and, as a conse-
quence, destroy the expected chain codes, making the
sub-graph identification impossible or creating false-
positive detection.
In (Bencina et al., 2005), the authors agreed
with the fact that the binarisation step is important.
They proposed a tile-based variation of the Bernsen’s
method (Bernsen, 1986). They also pointed that this
choice was mainly decided due to some speed con-
sideration. Still, they evoked the test of some other
alternatives, but there is neither additional informa-
tion about them nor further discussion on the pivotal
role of the thresholder in the global tracking system.
In practice, when dealing with diffuse illumina-
tion, the experts are faced to many day-to-day prob-
lems on illumination, camera behaviour/limitations,
marker printing, hardware tuning, calibration, etc. In
return, they often get poor tracking results, which are
simply unacceptable for the end-users. As a result, we
decided to invest a complete work on optimising the
binarisation step.
3 BINARISATION METHODS
Since several decades, many binarisation methods
have been developed. In (Sezgin and Sankur, 2004),
the authors proposed a taxonomy in six categories, de-
pending of the exploitation of: histogram shape infor-
mation, measurement space clustering, histogram en-
tropy information, image attribute information, spa-
tial information, and local characteristics.
Choosing the right binarisation is never straight-
forward (Chen et al., 2012), and there are no rules or
guidelines to support the decision. The only solution
is to benchmark them all. On top of that, the most
advanced techniques require some empirical param-
eters to be set. Their fine tuning is crucial to expect
a good behaviour and this task can be as difficult as
the recognition itself, in the sense that it looks like the
Sayre’s paradox.
Binarisation and segmentation can been seen as a
similar problem and finding a good method invariably
encounters two problems (Zhang et al., 2003):
• Inability to effectively compare the different
methods or even different parameterizations of
any given method.
• Inability to determine whether one binarisation
method or parameterization is best for all images
or a class of images (e.g. natural images, medical
images, etc.)
Even a fair benchmarking of the algorithms is not
possible, unless specifying clearly the application, the
constraints, the goals, and how to find the best param-
eters for each algorithm.
In the context of 2D marker tracking, we can as-
sume that the task to perform is a segmentation of
non-destructive testing (NDT) images as called by
(Sezgin and Sankur, 2004).
The methods we benchmarked are:
ICPRAM2014-InternationalConferenceonPatternRecognitionApplicationsandMethods
618
• Histogram-based: Sezan (1985), Tsai (1985),
Ramesh et al. (1995)
• Measurement-space or clustering-based: Ridler
and Calvard (1978), Otsu (1979), Lloyd (1985),
Kittler and Illingworth (1986), Yanni and Horne
(1994), Jawahar et al. (1997)
• Entropy-based: Dunn et al. (1984), Kapur et
al. (1985), Abutaleb (1989), Li and Lee (1993),
Shanbhag (1994), Yen et al. (1995), and Brink
and Pendock (1996)
• Local thresholding, window based: White and
Rohrer (1983), Bernsen (1986), Niblack (1986),
Mardia and Hainsworth (1988), Yanowitz and
Bruckstein (1989), Sauvola and Pietaksinen
(2000), and Gatos et al. (2004)
• Original ReacTIVision’s thresholders: simple,
simple adaptive, overlapped adaptive, tiled
Bernsen.
Full references for these well-known algorithms can
be found in (Sezgin and Sankur, 2004). For the Reac-
TIVision methods, the simple thresholder is a global
and fixed value for binarising any image. The simple
adaptive considers the image subdivided in grid, for
each cell of the grid, the mean grey value is taken as
the threshold for binarisation. The overlapped adap-
tive works like the simple adaptive, except that the
mean value is computer in a wider cell than the one
where the binarisation is applied. The tiled Bernsen is
based on (Bernsen, 1986), it works on separately on
each cell of the image, computes the mean intensity
in larger surrounding cell, and areas of low dynamic
range are set to black (Bencina et al., 2005).
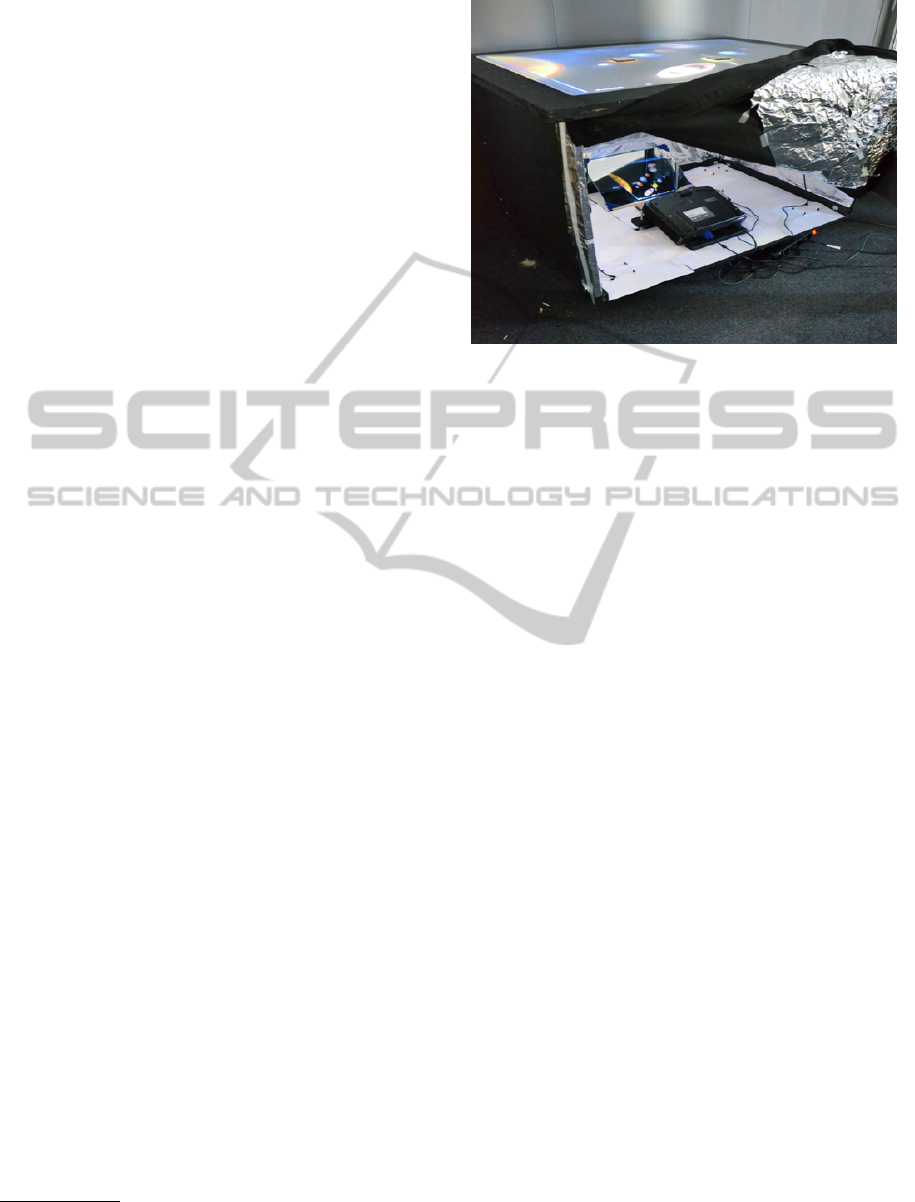
4 CONTROLLED EXPERIMENT
As presented in Section 1, a tabletop TUI set-up
(Maquil and Ras, 2012) is used for experimentation
(Fig. 5). The following sections elaborate the environ-
mental setting of the controlled experiment, describe
how the sample dataset was created in to compare the
different binarisation methods as well as the data col-
lection method.
4.1 Environmental Setting
In our experiment, we use a wide-angle-IR-modified
version of the PlayStation Eye camera
1
. It captures
640×480 pixel frames, up to 75 fps, and analyses in
our case a rectangular surface of 70×110 cm. This
webcam embeds a quite good sensor chip allowing
1
http://peauproductions.com/store/index.php?main_page=product_
info&cPath=1_110&products_id=568
Figure 5: Tabletop TUI used for experimentation. It is a
hollow frame of wood. White paper in the bottom reflects
the IR light coming from the upper borders. The camera is
positioned on the floor, between the projector and the mir-
ror, recording by transparency the markers placed on the
top.
for more effective low-light operation. Another nice
feature is its capability of outputting uncompressed
video, so that there is no compression artefacts com-
pared to some other webcams.
Because of the camera’s fish-eye effect and its
relatively low resolution compared to the surface to
watch, we avoid putting the 2D markers at the extreme
corners of the table. We decided of a “dead zone” of
10% (i.e. a border of around 5 cm on the surface).
The 2D markers we used are printed on white
paper with a laser printer. They all come from the
miniset amoeba symbol database, composed of ex-
actly twelve markers (6 with a white background, and
6 others on a black background). Each of them is
printed on a 7 ×7 cm surface and a second set is
printed on 5×5 cm piece of paper. The first set is
quite easy to recognise because the pixel density is
enough to see each black or white dots of a fiducial.
The second set is quite close to the limits of the sam-
pling capabilities of the camera. Only one or two pix-
els can cover each dot of a fiducial, the poor binarisa-
tion methods are then penalised.
The factor of the controlled experiment was the
different binarisation methods to be tested. The
dependent variable marker recognition score is ex-
plained later.
4.2 Preparing The Sample Frames
To evaluate fairly each binarisation method and in a
real case of application, a protocol has been set up.
A frame of markers consists in a greyscale snap-
BenchmarkingBinarisationTechniquesfor2DFiducialMarkerTracking
619

shot from the camera while the twelve markers are
on the table.The markers are located randomly on the
table, with also a random orientation. Each frame is
stored to feed a database for experimentation. Posi-
tion and orientation are always randomised before ac-
quiring a frame. To create a representative database,
several snapshots have been taken during 5 days, at
different hours of the day (4 in total). So that the illu-
mination of the frames is never the same. A series of
five frames was captured for each configuration and
for each set of fiducials. Four configurations with two
sets, for each day, during five days, create a database
of 200 samples of frames. Hence, the database is then
composed of 2 400 markers to recognise. We took at-
tention to voluntary “stress” the hardware by printing
small makers and positioning them on places where
the digital camera experiences the strongest difficul-
ties (e.g. mainly at the borders of the table)
4.3 Data Collection
Each binarisation method is applied on the 200 frames
(Fig. 6). For the methods requiring parameters like
the window-based ones, the best ones are chosen by
exhaustive search.
Dependent variable: The metric to evaluate the
quality of a binarisation algorithm takes into account
the recognition results of the left heavy depth se-
quence. In addition, if a 2D marker M is recognised,
the precision of the detection of its position P
rec
(M)
as well as its rotation angle R
rec
(M). A marker is
said perfectly recognised (a score S equals to 1) if it
appears on the table and if its position and orientation
are perfect (P
opt
(M), R
opt
(M)). Otherwise, if present,
the initial score of 1 is decreased by the relative dis-
tance between the perfect position and the recorded
one and also decreased by the distance of the rotation
angle between the optimal one and the recognised
one (Eqn. 1).
S(M) = 1 −
1
2
(kP
rec
(M) − P
opt
(M)k+
kR
rec
(M) − R
opt
(M)k) (1)
Most of the time, when ReacTIVision finds a marker,
there is no reason to have a huge error in the loca-
tion or orientation computation, so that the score is
anyway always extremely close to 1. In some cases,
it allows making a difference between two binarisa-
tions able to identify all the fiducials; the one with
better precision in location and location is slightly
privileged. In extremely rare cases, some binarisa-
tions might produce false markers: A phantom marker
can appears in the tracking system while there was no
marker on the tabletop. In that case, the scoring func-
Figure 6: Snapshot of the binarised image with the tiled
Bernsen thresholder of ReacTIVision.
tion allows to quickly degrade the score of this phan-
tom marker.
4.4 Implementation
From one part, the binarisation methods come from
the Gamera framework (Droettboom et al., 2003), it
includes: Abutaleb, Bernsen, Brink, Gatos, Niblack,
Otsu, Sauvola, White, and Tsai. Ridler’s method is
coming from the Mahotas library (Coelho, 2013). The
ReacTIVision methods are used as-they-stand. The
others ones have been written in Python.
Note that it has been discovered, during prelimi-
nary experimentation, there was probably a mistake
in the Sauvola’s implementation of Gamera (line 394
in binarization.hpp, rev. 1389), which was not
compliant with the original equation (Eqn. 2). It has
been decided to correct it before running this method.
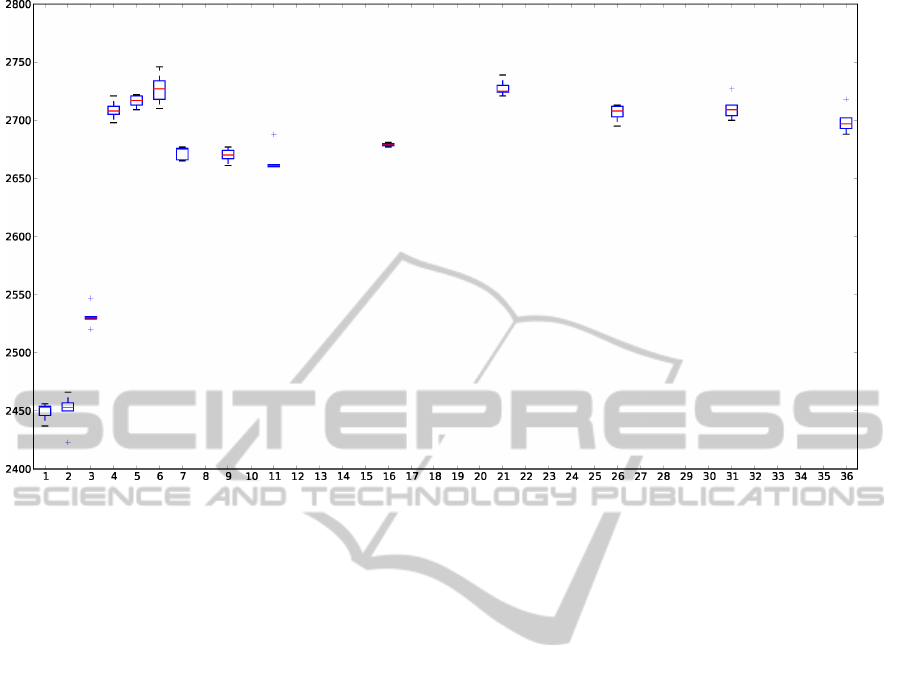
5 RESULTS
The results of the experimentation are summarised in
the Figure 7. It can be directly seen that, globally, the
window-based methods perform the best. The results
comply with our expectations with regard to the rank-
ing: The window-based methods seem to perform
best (e.g. Gatos) These kinds of methods proved to
perform well in other situation. On the contrary, basic
methods like REAC simple were doomed to failure
because of their inefficiency to deal with non-uniform
illumination. Anyway, none of the methods behaves
perfectly. It was quite foreseeable that the embedded
methods of ReacTIVision, in italic in the figure, get
quite poor results (on average
¯
S(REAC) = 0.61), al-
though the tiled Bernsen is still well ranked (with a
ICPRAM2014-InternationalConferenceonPatternRecognitionApplicationsandMethods
620
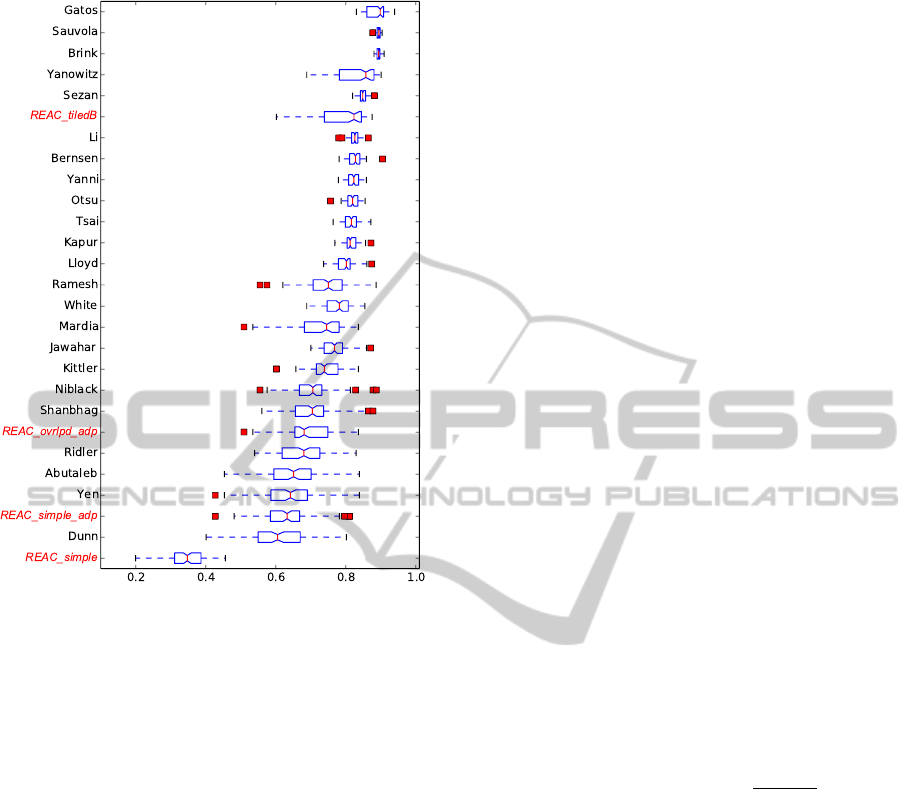
Figure 7: Marker recognition scores for each binarisation
method. The higher, the better. The box-and-whisker plots
are ordered according to the mean score obtained.
mean score of 0.79). As discussed previously, they
were not designed to output the best quality, but to be
time-efficient.
In this regard, the experimentations also showed
that quality and time have a positive correlation. It is
difficult to select a method, considering that the best
ones require setting empirical parameters which can
be a hard task. For a day-to-day use, a consistent
method is probably preferable, like the Sauvola’s bi-
narisation (
¯
S(Sauvola) = 0.89, σ
S(Sauvola)
= 0.006).
Most of the outliers comes from markers posi-
tioned close to a border of the table. As it can be seen,
the results do not pass 0.9, mainly due to the hard-
ware configuration limitation, with the camera record-
ing frames with a density just over 10 dpi. Note that
even better results can be achieved if the hardware is
not “stressed” like it has been done for the purpose of
this specific experimentation.
6 TIME CONSIDERATION
Processing a VGA video stream at 75 images per sec-
ond is in theory almost equivalent to process a 23
Megapixel image. In practice, working on sequences
of “small” images is always slower and cannot take
benefits from recent multi-core computers. In our
case, the video stream must be processed in order, and
without any delay to avoid latency while moving ob-
jects on the table. As a consequence, many parallel
computing techniques cannot be applied or would be
unprofitable.
Although the global trend is changing, the compu-
tation efficiency of an algorithm is never really taken
into account. Several hundreds of publications can be
easily found on binarisation, or closely related seg-
mentation problems, but almost none of them are re-
ally considering the time spent on a CPU to achieve
the task. The authors logically boost quality of the
results than address the issue of time complexity.
The average complexity of global binarisation
techniques is O(n), where n is the total number of pix-
els in an image, local techniques and window-based
are closed to O(n
2
) when the size of the window be-
comes wide (often necessary to reach a good quality).
The most efficient methods based on IA technique,
hierarchical pyramids, recursive programming, are
roughly in the O(n
3
) class of complexity.
As it would be not feasible to write perfect code
for each binarisation method that exists in the liter-
ature, we propose, as an example, to focus on only
one of them. The best trade-of according to the re-
sults of the experiments, with also a fairly consistency
across the entire test set, is the Sauvola’s binarisation
(Sauvola and Pietik
¨
ainen, 2000). This window-based
method is easy to code, its formulae is given by Equa-
tion 2.
T
W,K
(i, j) = m
W
(i, j) ×
1 + K
σ
W
(i, j)
128
− 1
(2)
To prevent a slowdown of the processing when us-
ing large values for the sliding window W , the in-
tegral image-based solution of (Shafait et al., 2008)
has been chosen. It has been implemented directly in-
side the C++ source code of ReacTIVision as a new
FrameThresholder.
Sauvola’s method outputs then a better binarisa-
tion as shown previously, with little extra computation
compared to the default thresholder of ReacTIVision.
It can still proceed at 75fps (Fig. 8) without any con-
straint on the size of the window for thresholding.
Although W could quite easily be deduced from
the fiducial’s size, we decided to automatically com-
pute both empirical parameters W and K, whereas K
is the sensitivity weight on the adjusted variance σ.
We propose a similar optimisation method to (Ran-
goni et al., 2009). The cost function is our case the
number of well recognised markers placed in a known
BenchmarkingBinarisationTechniquesfor2DFiducialMarkerTracking
621
.
Figure 8: Elapsed time to process optimised Sauvola binarisation while increasing the sliding window size. The x axis is half
of the window size W , e.g. x = 10 means that the window is a square whose side’s length is 10× 2 +1 = 21 pixels. The y axis
is the computation time in µs for processing one frame. It can be observed that there is no huge gap in the computation time
between a small window (around 2.4ms for a 3× 3 square) and a large window (around 2.7ms for a 145 ×145 square).
configuration at the beginning of the experiment. We
assumed that during a work session on the tangible
table, the global illumination is unlikely to suddenly
change.
7 CONCLUSIONS
In this paper, several state-of-the-art binarisation tech-
niques have been benchmarked in the scope of 2D
marker tracking. The evaluation was quantitative and
goal-directed through the use of an existing marker
tracking software, ReacTIVision. The protocol for
evaluation was strict and controlled, and made use
of a real tabletop tangible user interface built by the
authors, so that the outcomes presented are represen-
tative of real-case applications. Similarly to other
computer vision tasks, the results rank window-based
methods first. Among several possible techniques,
we focused on the best trade-off, the Sauvola’s bi-
narisation, and showed how it can be integrated di-
rectly in the ReacTIVision framework to perform effi-
ciently and quickly. Thanks to an improvement of al-
most 10 points this methods allows to better recognise
and track the most difficult fiducials while remaining
more robust and time-efficient with the current set-up.
For future work, apart improving the hardware itself,
working directly in the greyscale space is one of the
next steps that can be conducted, another one would
consist in using the history of the frames already pro-
cessed to improve the recognition of the actual one.
ACKNOWLEDGEMENTS
The present project is supported by the National Re-
search Fund, Luxembourg and cofunded under the
Marie Curie Actions of the European Commission
(FP7-COFUND)
REFERENCES
Asai, T., Arimura, H., Uno, T., and Nakano, S. I. (2003).
Discovering frequent substructures in large unordered
trees. In 6th International Conference on Discovery
Science, volume 2843, pages 47–61.
Ashley, J., Laurent, B., Greg, P., and Fujinaga, E. I. (2007).
A comparative survey of image binarisation algo-
rithms for optical recognition on degraded musical
sources. In 8th International Conference on Music
Information Retrieval, pages 509–512.
Bencina, R., Kaltenbrunner, M., and Jord
`
a, S. (2005). Im-
proved topological fiducial tracking in the reacTIVi-
sion system. In Proceedings of the IEEE Computer
ICPRAM2014-InternationalConferenceonPatternRecognitionApplicationsandMethods
622

Society Conference on Computer Vision and Pattern
Recognition, pages 99–103.
Bernsen, J. (1986). Dynamic thresholding of gray-level
images. In 8th International Conference on Pattern
Recognition, pages 1251–1255.
Chen, Q., Du, Y., Lin, R., and Tian, Y. (2012). Fast QR code
image process and detection. In Wang, Y. and Zhang,
X., editors, Internet of Things, volume 312 of Commu-
nications in Computer and Information Science, pages
305–312. Springer Berlin Heidelberg.
Coelho, L. P. (2013). Mahotas: Open source software for
scriptable computer vision. Journal of Open Research
Software, 1.
Cormen, T. H., Stein, C., Rivest, R. L., and Leiserson, C. E.
(2001). Introduction to Algorithms. McGraw-Hill
Higher Education, 2nd edition.
Costanza, E. and Robinson, J. A. (2003). A region ad-
jacency tree approach to the detection and design of
fiducials. In Vision, Video and Graphics, pages 63–
70.
Droettboom, M., MacMillan, K., and Fujinaga, I. (2003).
The Gamera framework for building custom recogni-
tion systems. In Symposium on Document Image Un-
derstanding Technologies, pages 275–286.
Dunser, A., Looser, J., Grasset, R., Seichter, H., and
Billinghurst, M. (2010). Evaluation of tangible user
interfaces for desktop AR. In International Sympo-
sium on Ubiquitous Virtual Reality, pages 36–39.
Ishii, H. (2008). The tangible user interface and its evolu-
tion. In Communications of the ACM, pages 32–36.
Kaltenbrunner, M., Jord
`
a, S., Geiger, G., and Alonso, A.
(2006). The reacTable: A collaborative musical in-
strument. In Workshop on Tangible Interaction in Col-
laborative Environments, pages 406–411.
Kato, H. and Billinghurst, M. (1999). Marker tracking and
HMD calibration for a video-based augmented reality
conferencing system. In 2nd IEEE and ACM Interna-
tional Workshop on Augmented Reality (IWAR), page
8594.
Lee, S. U., Chung, S. Y., and Park, R. H. (1990). A com-
parative performance study of several global thresh-
olding techniques for segmentation. Computer Vision,
Graphics, and Image Processing, 52(2):171–190.
Leedham, G., Varma, S., Patankar, A., and Govindarayu, V.
(2002). Separating text and background in degraded
document images A comparison of global threshhold-
ing techniques for multi-stage threshholding. In 8th
International Workshop on Frontiers in Handwriting
Recognition, pages 244–249.
Maquil, V. and Ras, E. (2012). Collaborative problem solv-
ing with objects: Physical aspects of a tangible table-
top in technology-based assessment. In From Re-
search to Practice in the Design of Cooperative Sys-
tems: Results and Open Challenges, pages 153–166.
Rangoni, Y., van Beusekom, J., and Breuel, T. M. (2009).
Language independent thresholding optimization us-
ing a Gaussian mixture modelling of the character
shapes. In Proceedings of the International Workshop
on Multilingual OCR, pages 1–5. ACM.
Saini, R., Dutta, M., and Kumar, R. (2012). A compara-
tive study of several image segmentation techniques.
Journal of Information and Operations Management,
3(1):21–24.
Sauvola, J. and Pietik
¨
ainen, M. (2000). Adaptive docu-
ment image binarization. In Pattern Recognition, vol-
ume 33, pages 225–236.
Sezgin, M. and Sankur, B. (2004). Survey over image
thresholding techniques and quantitative performance
evaluation. Journal of Electronic Imaging, 13(1):146–
168.
Shafait, F., Keysers, D., and Breuel, T. M. (2008). Efficient
implementation of local adaptive thresholding tech-
niques using integral images. In Document Recogni-
tion and Retrieval, volume 6815.
Trier, O. T. D. and Taxt, T. (1995). Evaluation of binariza-
tion methods for document images. IEEE Transac-
tions On Pattern Analysis And Machine Intelligence,
17:312–315.
Ullmer, B. and Ishii, H. (2001). Emerging frameworks for
tangible user interfaces. In Human-Computer Interac-
tion in the New Millennium, pages 915–931. John M.
Carroll, ed. Addison-Wesley.
van Dam, A. (1997). Post-WIMP user interfaces. Commu-
nications of the ACM, 40(2):63–67.
X. Zhang, S. Fronz, N. N. (2002). Visual marker detection
and decoding in AR systems: A comparative study.
In International Symposium on Mixed and Augmented
Reality, pages 97–106.
Zhang, H., Fritts, J. E., and Goldman, S. A. (2003). An
entropy based objective evaluation method for image
segmentation. Storage and Retrieval Methods and Ap-
plications for Multimedia, pages 38–49.
BenchmarkingBinarisationTechniquesfor2DFiducialMarkerTracking
623
