
Non Technical Loses Detection
Experts Labels vs. Inspection Labels in the Learning Stage
Fernanda Rodr
´
ıguez, Federico Lecumberry and Alicia Fern
´
andez
Instituto de Ingenir
´
ıa El
´
ectrica, Facultad de Ingenier
´
ıa, Universidad de la Rep
´
ublica,
J. Herrera y Reissig 565, 11300, Montevideo, Uruguay
Keywords:
Electricity Fraud, Support Vector Machine, Optimum Path Forest, Unbalance Class Problem, Combining
Classifier, UTE.
Abstract:
Non-technical losses detection is a complex task, with high economic impact. The diversity and big number
of consumption records, makes it very important to find an efficient automatic method for detection the largest
number of frauds with the least amount of experts’ hours involved in preprocessing and inspections. This
article analyzes the performance of a strategy based on learning from expert labeling: suspect/no-suspect,
with one using inspection labels: fraud/no-fraud. Results show that the proposed framework, suitable for
imbalance problems, improves performance in terms of the F
measure
with inspection labels, avoiding hours of
experts labeling.
1 INTRODUCTION
Improving non-technical loss detection is a huge chal-
lenge for electric companies. In Uruguay the na-
tional electric power utility (henceforth UTE) faces
the problem by manually monitoring a group of cus-
tomers. A group of experts inspect at the monthly
consumption curve of each customer and indicates
those with some kind of suspicious behavior. This
set of customers, initially classified as suspects are
then analyzed taking into account other factors (such
as fraud history, electrical energy meter type, etc.).
Finally a subset of customers is selected to be in-
spected by an UTE’s employee, who confirms (or not)
the irregularity. The procedure is illustrated in Fig-
ure 1. The procedure described before, has major
drawbacks, mainly, the number of customers that can
be manually controlled is small compared with the to-
tal amount of customer (around 500.000 only in Mon-
tevideo).
Several studies with a Pattern Recognition ap-
proach have addressed the detection of non-technical
losses, both supervised or unsupervised. Leon et al.
review the main research works found in the area
between 1990 and 2008 (Leon et al., 2011). Here
we present a brief review that builds on this work
and wide it with new contributions published between
2008 and 2013. Several of these approaches con-
sider unsupervised classification using different tech-
niques such as fuzzy clustering (dos Angelos et al.,
2011), neural networks (Markoc et al., 2011; Sforna,
2000), among others. Monedero et al. use regression
based on the correlation between time and monthly
consumption, looking for significant drops in con-
sumption (Monedero et al., 2010). Then they make
a second stage where suspicious customers are elim-
inated if the consumption of these depend on the
economy of the moment or the year’s season. Only
major customers were inspected and 38% were de-
tected as fraudulent. Similar results (40%) were ob-
tained in (Filho et al., 2004) using a tree classifier
and customers who had been inspected in the past
year. In (Depuru et al., 2011) and (Yap et al., 2007)
SVM is used. In the latter, Modified Genetic Al-
gorithm is employed to find the best parameters of
SVM. In (Yap et al., 2012), is compared the methods
Back-Propagation Neural Network (BPNN), Online-
sequential Extreme Learning Machine (OS-ELM) and
SVM. Biscarri et al. (Biscarri et al., 2008) seek for
outliers, Leon et al. (Leon et al., 2011) use General-
ized Rule Induction and Di Martino et al. (Di Mar-
tino et al., 2012) combine CS-SVM classifiers, One
class SVM, and C4.5 OPF using various features de-
rived from the consumption. Different kinds of fea-
tures are used among this works, for examples, con-
sumption (Biscarri et al., 2008; Yap et al., 2007),
contracted power and consumed ratio (Galvn et al.,
1998), Wavelet transformation of the monthly con-
624
Rodríguez F., Lecumberry F. and Fernández A..
Non Technical Loses Detection - Experts Labels vs. Inspection Labels in the Learning Stage.
DOI: 10.5220/0004823506240628
In Proceedings of the 3rd International Conference on Pattern Recognition Applications and Methods (ICPRAM-2014), pages 624-628
ISBN: 978-989-758-018-5
Copyright
c
2014 SCITEPRESS (Science and Technology Publications, Lda.)

Figure 1: Manual fraud detection scheme.
sumption (Jiang et al., 2002), amount of inspections
made to each client in one period and average power
of the area where the customer resides (dos Angelos
et al., 2011), among others.
On the other hand, Romero proposes (Romero,
2012) a method to estimate and reduce non-technical
losses, such as advanced metering infrastructure,
fraud deterrence prepayment systems, system remote
connection and disconnection, etc. Lo et al. based on
real-time measurements, design (Lo et al., 2012) an
algorithm for distributed state estimation in order to
detect irregularities in consumption.
To improve the efficiency of fraud detection and
resource utilization, in (Di Martino et al., 2013) was
implemented a tool that automatically detects suspi-
cious behavior analyzing customers historical con-
sumption curve. This approach has the drawback of
requiring a base previously tagged by the experts, in
order to use it in the training stage.
In this paper we set out to analyze the behavior
of the proposed framework to fraud classification and
compare it by using labels based on the inspection re-
sults instead of labels defined by experts. This new
approach does not require that the company person-
nel conduct a manual study of the customers’ con-
sumption curve, since it use labels resulting from in-
spections in the past. We investigate performance im-
provement originated by training with individual al-
gorithms and their combinations with labels of fraud
and no fraud (based on inspections) and the impor-
tance of choosing the appropriate performance mea-
sure to solve the problem.
The paper is organized as follows. Section 2 de-
scribes general aspects of the class imbalance prob-
lems, Section 3 describes the strategies to be com-
pare, Section 4 presents the obtained results and, fi-
nally Section 5 concludes the work.
2 THE CLASS IMBALANCE
PROBLEM AND THE CHOICE
OF PERFORMANCE MEASURE
When working on fraud detection problems, we can
not assume that the number of people who commit
Table 1: Confusion matrix.
Labeled as
Positive Negative
Positive TP (True Positive) FN (False Negative)
Negative FP (False Positive) TN (True Negative)
fraud are near the same than those who do not, usu-
ally they are a minority class. This situation is known
as class imbalance problem, and it is particularly im-
portant in real world applications where it is costly to
misclassify examples from the minority class. In this
cases, standard classifiers tend to be overwhelmed by
the majority class and ignore the minority class, hence
obtaining suboptimal classification performance. In
order to confront this type of problem, different strate-
gies can be used on different levels: (i) changing class
distribution by resampling; (ii) manipulating classi-
fiers; (iii) and on the ensemble of them, as proposed
in (Di Martino et al., 2013).
Another problem which arises when working with
imbalanced classes is that the most widely used met-
rics for measuring the performance of learning sys-
tems, such as Accuracy and ErrorRate, are not ap-
propriate because they do not take into account mis-
classification costs, since they are strongly biased to
favor the majority class (Garcia et al., 2012). Then
others measures have to be considered:
• Recall is the percentage of correctly classified
positive instances, in this case, the fraud samples.
Recall =
T P
T P + FN
• Precision is defined as the proportion of labeled
as positive instances that are actually positive.
Precision =
T P
T P + FP
Where T P, FN and FP are defined in Table 1.
• The combination of this two measurements, the
F
measure
, represents the geometric mean between
them, weighted by the parameter β,
F
measure
=
(1 + β
2
)Recall × Precision
β
2
Recall + Precision
(1)
Depending on the value of β we can prioritize
Recall or Precision. For example, if we have few
resources to perform inspections, it can be useful to
prioritize Precision, so the set of samples labeled as
positive has high density of true positive.
When working with inspection labels the imbal-
ance problem is worst, in terms of unbalance, than
dealing with experts labels. In the experts labels
method, the ratio of suspect to no suspect is near 10%,
while in the one based on inspection labels, the ratio
is near 0.4%.
NonTechnicalLosesDetection-ExpertsLabelsvs.InspectionLabelsintheLearningStage
625
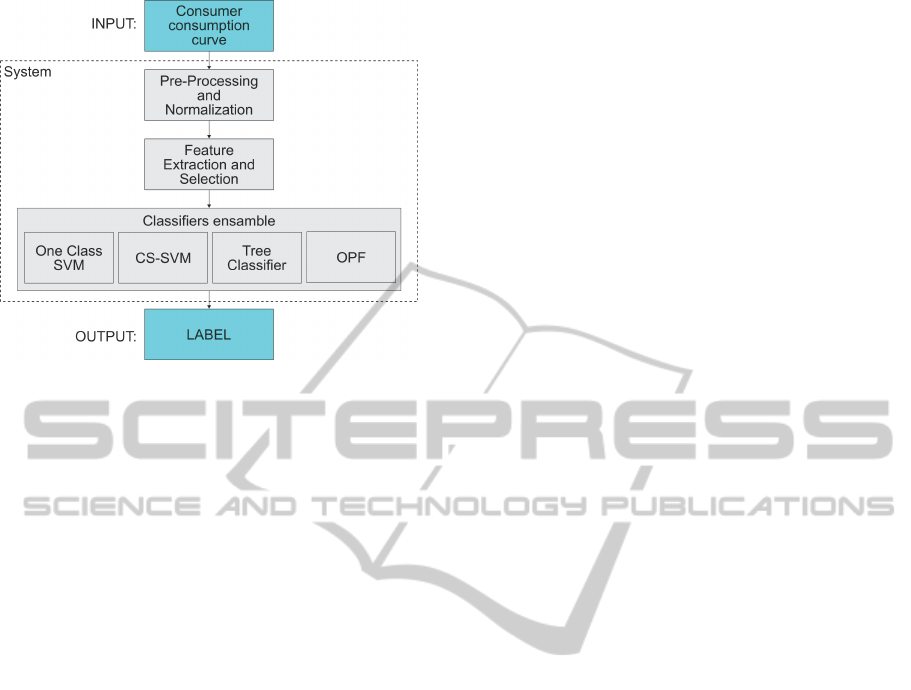
Figure 2: Block Diagram of the automatic fraud detection
system.
3 FRAMEWORK
The system presented consists basically on three mod-
ules: Pre-Processing and Normalization, Feature Ex-
traction and Selection, and Classification. Figure 2
shows the system configuration. The system input
corresponds to the last three years of the monthly con-
sumption curve of each costumer.
The first module, Pre-Processing and Normaliza-
tion, modifies the input data so that they all have nor-
malized mean and implements some filters to avoid
peaks from billing errors. A feature set was pro-
posed taking into account UTE’s technician exper-
tize in fraud detection by manual inspection and re-
cent papers on non technical loss detection (Alcete-
garay and Kosut, 2008), (Muniz et al., 2009), (Nagi
and Mohamad, 2010). Di Martino et al. use a list of
the features extracted from the monthly consumption
records (Di Martino et al., 2013). In this work, we
use the framework illustrated in Figure 2 and a sub-
set of the same set of features used in (Di Martino
et al., 2013) but doing a selection of them taking into
account the label type (based on inspection or exper-
tise’s criterion).
It is well known that finding a small set of relevant
features can improve the final classification perfor-
mance; this is why we implemented a feature selec-
tion stage. We used two types of evaluation methods:
filter and wrapper. Filters methods looks for subsets
of features with low correlation between them and
high correlation with the labels, while wrapper meth-
ods evaluate the performance of a given classifier for
the given subset of features. In the wrapper methods,
we used as performance measure the F
measure
, also,
the evaluations were performed using 10 fold cross
validation over the training set.
As searching method, we used Bestfirt, for which
we found in this application a good balance between
performance and computational costs.
Different feature subsets were selected from the
original set proposed in (Di Martino et al., 2013) for
both approaches. For example, for the experts’ labels
approach, the features include:
• Consumption ratio for the twelve months and the
average consumption.
• Difference between fourth Wavelet coefficient
from the last and previous years.
• Euclidean distance of each customer to the mean
customer, where the mean customer is calculated
by taking the mean for each month between all the
customers.
• Module of the first Fourier coefficient of the total
consumption.
While for inspection label approach, the features in-
clude:
• Difference between the first two Fourier coeffi-
cients from the last and previous years.
• Variance of the consumption curve.
Some features are selected in both approaches, such
as:
• Consumption ratio for the last three and six
months and the average consumption.
• Difference between fifth Wavelet coefficient from
the last and previous years.
• Slope of the straight line that fits the consumption
curve.
The performance analysis considers, SVM al-
gorithm, one-class classifier (O-SVM) and cost-
sensitive learning (C-SVM), Optimum Path Forest
(OPF) (Ramos et al., 2010), a decision tree proposed
by Roos Quinlan, C4.5 and Iterative Combination
proposed in (Di Martino et al., 2012). The latter
method performs an optimal combination of the be-
fore mentioned classifiers. The choice of combina-
tion’s weights is done exhaustively in order to maxi-
mize the F
measure
.
4 EXPERIMENTS AND RESULTS
In this work we used a data set of 456 industrial pro-
files obtained from the UTE’s database. Each profile
is represented by the customers monthly consumption
in the last 36 months and has two labels, one dictated
manually by technicians previous the inspection and
ICPRAM2014-InternationalConferenceonPatternRecognitionApplicationsandMethods
626

Table 2: Fraud detection with experts label training.
Description Recall Precision F
measure
(%) (%) (%)[β = 1]
OPF 39 27 32
Tree (C4.5) 38 23 29
O-SVM 51 22 30
CS-SVM 35 20 26
Iterative
Combination 77 22 35
another based on the inspection results. Training was
done considering both labels separately and perfor-
mance evaluation was done given the inspection la-
bels, using a 10-fold cross validation scheme.
Tables 2 and 3 shows the results obtained when
experts and inspection labels are used to train the
different classifiers respectively. The Iterative Com-
bination technique with expert label training obtains
the best result for fraud detection clearly overpassing
the other methods, however the number false positive
(FP) is relatively high, since
FP
T P
=
1
Precision
− 1 ≈ 4.
On the other hand, if we use the inspection labels the
Iterative Combination also obtains the best results for
fraud detection, but reducing in a half the number of
FP (
FP
T P
≈ 2).
If we compare both approaches, we see that learn-
ing from the inspection labels could get better results
(in the F
measure
sense) than learning from the labels
set by experts. The former has the additional advan-
tage of not requiring that the experts made the manual
labeled of the training base.
The results for the method performed manually by
experts, i.e. validating the expert labels with inspec-
tion labels, are Recall = 38%, Precision = 51% and
F
measure
= 44%.
Comparing the F
masure
obtained manually by the
experts (44%) and automatically by the Iterative
Combination (46%) both are similar. However, the
former consider other features as the history’s fraud
detection, contracted power, number of estimated
readings, etc. and not only the monthly consumption,
as the automatic one.
5 CONCLUSIONS AND FUTURE
WORK
In this work we compare the performance of a
strategy based on learning from expert labeling:
suspect/no-suspect, with one using inspection labels:
fraud/no-fraud. In the F
measure
sense with all the tested
Table 3: Fraud detection with inspection label training.
Description Recall Precision F
measure
(%) (%) (%)[β = 1]
OPF 36 34 35
Tree (C4.5) 33 37 35
O-SVM 71 31 44
CS-SVM 74 33 46
Iterative
Combination 77 33 46
classifiers the classification with inspection label ob-
tains better results than using experts labels. Among
them the Iterative Combination obtains the best result
and also better than the manual method.
In future work we propose to include new cate-
gorical attributes as the history’s fraud detection, con-
tracted power, number of estimated readings, etc. We
also want to explore a semi-supervised approach that
allows to learn from data with and without previous
inspection labels.
ACKNOWLEDGEMENTS
This work was supported by the program Sector Pro-
ductivo CSIC UTE. Authors would like to thank
UTE, especially Juan Pablo Kosut and Fernando San-
tomauro, for providing datasets and share fraud detec-
tion expertise.
REFERENCES
Alcetegaray, D. and Kosut, J. (2008). One class svm para
la detecci
´
on de fraudes en el uso de energ
´
ıa el
´
ectrica.
Trabajo Final Curso de Reconocimiento de Patrones,
Dictado por el IIE- Facultad de Ingenier
´
ıa- UdelaR.
Biscarri, F., Monedero, I., Leon, C., Guerrero, J. I., Bis-
carri, J., and Millan, R. (2008). A data mining method
based on the variability of the customer consumption
- A special application on electric utility companies,
volume AIDSS, pages 370–374. Inst. for Syst. and
Technol. of Inf. Control and Commun.
Depuru, S. S. S. R., Wang, L., and Devabhaktuni, V. (2011).
Support vector machine based data classification for
detection of electricity theft.
Di Martino, J., Decia, F., Molinelli, J., and Fern
´
andez, A.
(2012). Improving electric fraud detection using class
imbalance strategies. 1st International Conference In
Pattern Recognition Aplications and Methods, pages
135–141, volumen 2.
Di Martino, M., Decia, F., Molinelli, J., and Fernndez, A.
(2013). A novel framework for nontechnical losses
detection in electricity companies. In Latorre Car-
mona, P., Snchez, J. S., and Fred, A. L., editors, Pat-
tern Recognition - Applications and Methods, volume
NonTechnicalLosesDetection-ExpertsLabelsvs.InspectionLabelsintheLearningStage
627

204 of Advances in Intelligent Systems and Comput-
ing, pages 109–120. Springer Berlin Heidelberg.
dos Angelos, E., Saavedra, O., Corts, O., and De Souza,
A. (2011). Detection and identification of abnormal-
ities in customer consumptions in power distribution
systems.
Filho, J. R., Gontijo, E. M., Delaiba, A. C., Mazina, E.,
Cabral, J. E., and Pinto, J. O. P. (2004). Fraud identi-
fication in electricity company customers using deci-
sion tree.
Galvn, J., Elices, E., Noz, A. M., Czernichow, T., and Sanz-
Bobi, M. (1998). System for detection of abnormali-
ties and fraud in customer consumption.
Garcia, V., Sanchez, J., and Mollineda, R. (2012). On the
suitability if numerical performance evaluation mea-
sures for class imbalance problems. 1st International
Conference In Pattern Recognition Aplications and
Methods, pages 310–313, volumen 2.
Jiang, R., Tagaris, H., and Laschusz, A. (2002). Wavelets
based feature extraction and multiple classifiers for
electricity fraud detection.
Leon, C., Biscarri, F. X. E. L., Monedero, I. X. F. I., Guer-
rero, J. I., Biscarri, J. X. F. S., and Millan, R. X. E. O.
(2011). Variability and trend-based generalized rule
induction model to ntl detection in power companies.
Lo, Y.-L., Huang, S.-C., and Lu, C.-N. (2012). Non-
technical loss detection using smart distribution net-
work measurement data. In Innovative Smart Grid
Technologies - Asia (ISGT Asia), 2012 IEEE, pages
1–5.
Markoc, Z., Hlupic, N., and Basch, D. (2011). Detection of
suspicious patterns of energy consumption using neu-
ral network trained by generated samples.
Monedero, I., Biscarri, F., Len, C., Guerrero, J., Biscarri,
J., and Milln, R. (2010). Using regression analysis
to identify patterns of non-technical losses on power
utilities. In Setchi, R., Jordanov, I., Howlett, R., and
Jain, L., editors, Knowledge-Based and Intelligent In-
formation and Engineering Systems, volume 6276 of
Lecture Notes in Computer Science, pages 410–419.
Springer Berlin Heidelberg.
Muniz, C., Vellasco, M., Tanscheit, R., and Figueiredo, K.
(2009). Ifsa-eusflat 2009 a neuro-fuzzy system for
fraud detection in electricity distribution.
Nagi, J. and Mohamad, M. (2010). Nontechnical loss de-
tection for metered customers in power utility using
support vector machines. IEEE TRANSACTIONS ON
POWER DELIVERY, VOL. 25, NO. 2.
Ramos, C., de Sousa, A. N., Papa, J., and Falcao, A.
(2010). A new approach for nontechnical losses de-
tection based on optimum-path forest. IEEE TRANS-
ACTIONS ON POWER SYSTEMS.
Romero, J. (2012). Improving the efficiency of power dis-
tribution system through technical and non-technical
losses reduction.
Sforna, M. (2000). Data mining in power company cus-
tomer database.
Yap, K. S., Hussien, Z., and Mohamad, A. (2007). Abnor-
malities and fraud electric meter detection using hy-
brid support vector machine and genetic algorithm.
Yap, K. S., Tiong, S. K., Nagi, J., Koh, J. S. P., and Nagi, F.
(2012). Comparison of supervised learning techniques
for non-technical loss detection in power utility.
ICPRAM2014-InternationalConferenceonPatternRecognitionApplicationsandMethods
628
