
A Method of Pixel Unmixing by Classes based on the Possibilistic
Similarity
B. Alsahwa
1,2
, S. Almouahed
1
, D. Guériot
1,2
and B. Solaiman
1,2
1
Image & Information Processing Dept., Telecom Bretagne, Institut Mines-Télécom, Brest, France
2
Lab-STICC UMR CNRS 3192 - Laboratoire en sciences et technologies de l'information, de la communication et de la
connaissance (Institut Mines-Télécom-Télécom Bretagne-UEB), Brest, France
Keywords: Possibility Distribution, Possibilistic Similarity, Contextual Information, Pixel Unmixing, Classification.
Abstract: In this paper, an approach for pixel unmixing based on possibilistic similarity is proposed. This approach
uses possibility distributions to express both the expert’s semantic knowledge (a priori knowledge) and the
contextual information. Dubois-Prade’s probability-possibility transformation is used to construct these
possibility distributions starting from statistical information (learning areas delimitated by an expert for each
thematic class in the analyzed scene) which serve, first, for the estimation of the probability density
functions using the kernel density estimation. The pixel unmixing is then performed based on the
possibilistic similarity between a local possibility distribution estimated around the considered pixel and the
obtained possibility distributions representing the predefined thematic classes. The obtained similarity
values are used in order to obtain the abundances of different classes in the considered pixel. Accuracy
analysis of pixels unmixing demonstrates that the proposed approach represents an efficient estimator of
their abundances of the predefined thematic classes and, in turn, higher classification accuracy is achieved.
Synthetic images are used in order to evaluate the performances of the proposed approach.
1 INTRODUCTION
An important difficulty related to image
classification task stems from the existence of
“mixed” pixels (Tso and Mather, 2009). These
mixed pixels contain a mixture of more than one
class of different thematic classes contained in the
analyzed scene. They arise mainly due to spatial and
spectral resolving power limitations of the used
sensor. In the case of spatial resolving power
limitation, the mixed pixels extents cover more than
one class in the observed scene. The pixel response
is then a mixture of the covered underlying thematic
classes (e.g. remote sensing platforms flying at a
high altitude) or thematic classes are combined into
a homogeneous mixture (e.g. sand grains on a
beach), which can occur regardless of the spatial
resolution of the sensor. For the other case (spectral
resolving power limitation), the spectrum of each
mixed pixel is composed of a collection of
constituent spectra or “endmembers” (Van der Meer,
1997). It is important to notice that these two types
of resolution have an inextricable relationship to one
another (Tso and Mather, 2009). Indeed, high
spectral variability of local areas of the analyzed
scene becomes apparent as the spatial resolution
becomes finer. Therefore, using advanced sensors
with higher spatial resolving power may not
necessarily enable improved classifications when the
pixel-based images classification systems are used.
Hence, a method of pixel unmixing by classes
becomes very important in many applications of
image analyses where subpixel detail is valuable and
more accurate classification results are needed.
In an unmixing approach, given a mixed pixel,
the goal is to find the constituent thematic classes
and the set of corresponding fractions or
“abundances” that indicate the proportion of each
thematic class present in the pixel. Several
approaches to subpixel analysis have been
employed. Among them, three are widely used.
These are fuzzy maximum likelihood approaches
(Wang, 1990), fuzzy c-means approaches (Foody
and Cox, 1994), and linear mixture models, or
spectral mixture analysis (Plaza et al., 2010).
However, in all these approaches, the subpixel
analysis is usually conducted using multispectral
image or hyperspectral image. In this paper, the
220
Alsahwa B., Almouahed S., Guériot D. and Solaiman B..
A Method of Pixel Unmixing by Classes based on the Possibilistic Similarity.
DOI: 10.5220/0004826202200226
In Proceedings of the 3rd International Conference on Pattern Recognition Applications and Methods (ICPRAM-2014), pages 220-226
ISBN: 978-989-758-018-5
Copyright
c
2014 SCITEPRESS (Science and Technology Publications, Lda.)

subpixel analysis is conducted using one gray level
image. This approach is proposed under the closed
world assumption. For the analyzed image I, let
Ω={C
1
, C
2
, ..., C
M
} an exclusive and exhaustive set
of M predefined classes. Generally, Each pixel P
from this image I, can be represented by a vector X
= (x
1
, x
2
…, x
N
)
T
of “N” measurements. Each
measurement x
n
, n=1,…,N, is the output of the given
sensor resulting of one physical parameter related to
the imaged scene. In the proposed approach, X is
limited to one measurement N=1 (e.g. gray level or
pixel brightness) i.e. only one output of the given
sensor. Prior knowledge is also assumed to be given
as an initial set of learning areas extracted from the
considered image and characterizing the M
considered classes from the expert point of view.
The class representation is done by means of
possibility distribution in order to deal with the
ambiguity as well as the uncertainty in the expert
description (Rabah, 2011). This possibilistic
representation constitutes an efficient and a flexible
tool corresponding to the way the experts express
their own semantic knowledge. For this purpose, the
probability-possibility transformations are adopted.
The Kernel Density Estimation (KDE) approach
(Epanechnikov, 1969) is first used to estimate the M
probability density functions from the learning set.
Then they are transformed into M possibility
distributions using Dubois-Prade transformations
(Dubois and Prade, 1983).
Each pixel P
0
from the image I can be considered
as being of a “homogeneous sub-region”. In this
case, a local possibility distribution
P0
(x) can be
estimated which express the possibility degree to
observe the pixel P
0
in the considered sub-region.
These possibility distributions (The M possibility
distributions as well as the local ones) using the
possibilistic similarity concept will lead to identify
thematic class components present in the mixed
pixels which, in his turn, would improve the
classification results.
This paper is organized as follows. In the next
section, the basic concepts of possibility theory are
introduced. The notion of similarity measures is the
subject of the third section. In the fourth section, the
proposed approach will be detailed. Section 5
presents the experimental results obtained when the
proposed approach is applied using synthetic
images.
2 POSSIBILITY THEORY
Possibility theory is devoted to handle epistemic
uncertainty, i.e. uncertainty in the context where the
available knowledge is only expressed in an
ambiguous form. This theory was first introduced by
Zadeh in 1978 as an extension of fuzzy sets and
fuzzy logic theory to express the intrinsic fuzziness
of natural languages as well as uncertain information
(Zadeh, 1978). It is well established that
probabilistic reasoning, based on the use of a
probability measure, constitutes the optimal
approach dealing with uncertainty. In the case where
the available knowledge is ambiguous and encoded
as a membership function into a fuzzy set defined
over the decision set, the possibility theory
transforms each membership value into a
possibilistic interval of possibility and necessity
measures (Dubois and Prade, 1980). The use of
these two dual measures in possibility theory makes
the main difference from the probability theory.
Besides, possibility theory is not additive in terms of
beliefs combination and makes sense on ordinal
structures (Dubois and Prade, 1992). The basic
concepts of a possibility distribution, the dual
possibilistic measures (i.e. possibility and necessity
measures), and the probability-possibility
transformation are briefly presented in the following
subsections.
2.1 Possibility Distribution
Let us consider an exclusive and exhaustive universe
of discourse Ω = {C
1
, C
2
,..., C
M
} formed by M
elements C
m
, m = 1, ..., M (e.g., thematic classes,
hypothesis, elementary decisions, etc).
Exclusiveness means that one and only one element
may occur at time, whereas exhaustiveness refers to
the fact that the occurring element certainly belongs
to Ω. A key feature of possibility theory is the
concept of possibility distribution, denoted by ,
assigning to each element C
m
a value from a
bounded set [0,1] (or a set of graded values). This
value (C
m
) encodes our state of knowledge or
belief, about the real world and represents the
possibility degree for C
m
to be the unique occurring
element.
2.2 Possibility and Necessity Measures
Based on the possibility distribution concept, two
dual set measures, the possibility Π and the necessity
Ν measures are derived. For every subset (or event)
A, these two measures are defined as follows:
m
C
m
() maxπ(C )
A
A
(1)
AMethodofPixelUnmixingbyClassesbasedonthePossibilisticSimilarity
221

m
C
m
N( ) 1 ( ) min 1 π(C )
C
A
AA
(2)
where, A
c
denotes the complement of the event
A.
2.3 Possibility Distributions Estimation
based on Pr- Transformation
Many methods are proposed in the literature in order
to estimate the possibility distributions from a
limited prior knowledge in order to represent the
existing thematic classes. These methods can by
divided into two categories: the first category
reproduces fuzzy set theory concepts by using the
standard and predefined membership functions and
then applying Zadeh’s postulate for which
possibility values numerically duplicate the
membership ones, but have a different semantic
significance (Medasani et al., 1998). In fact, Zadeh’s
postulate transforms membership degrees (to a fuzzy
set describing an ambiguous concept) into
possibility degrees (describing the uncertainty
concept). This estimation category is well adapted to
the case where the available expert’s knowledge is
expressed using an ambiguous description over the
set of thematic classes that can be modeled by the
standard membership forms. The second category is
based on the use of statistical data like methods of
probability-possibility transformations, histogram
based methods [4], and learning based methods
(FCM, nearest neighbour techniques, neural
networks, etc) (Medasani et al., 1998).
As we consider that the available expert’s
knowledge is expressed through the definition of
learning areas representing different thematic
classes, i.e. statistical data, we will focus on the
second category. Several Pr- transformations are
proposed in the literature. Dubois et al. (Dubois and
Prade, 1983) suggested that any Pr- transformation
of a probability distribution function Pr, into a
possibility distribution , should be guided by the
two following principles:
The probability-possibility consistency
principle. This principle is expressed by
Zadeh (Zadeh, 1978) as: “what is probable
is possible”. Dubois and Prade formulated
this principle by indicating that the induced
possibility measure Π should encode upper
probabilities:
() Pr(), AAA
(3)
The preference preservation principle
ensuring that any Pr- transformation
should satisfy the relation:
Pr( ) Pr ( ) ( ) ( ), , AB ABAB
(4)
Verifying these two principles, a Pr-
transformation turning a probability distribution Pr
(defined by probability values Pr(
{C
m
}), C
m
, m
= 1, 2,..., M) into a possibility distribution (defined
by (C
m
), C
m
, m = 1, 2, ..., M) has been
suggested by Dubois et al. (Dubois and Prade,
1983). This transformation, called symmetric Pr-
transformation, is defined by:
M
mm j m
j=1
π(C )= ( C )= min Pr( C ), Pr( C )
(5)
In our study, this transformation is considered in
order to transform the probability distributions into
possibility distributions.
3 SIMILARITY MEASURES
In order to quantify the similarity between two
objects or two pieces of information (e.g. possibility
distributions) a similarity function is used. This
function has no single definition and depends on the
way these pieces of information are represented (e.g.
similarity function is proportional to the inverse of
distance metrics between the examined pieces of
information).
Considering the expert’s predefined set of M
thematic classes contained in the analyzed image,
={C
1
, C
2
..., C
M
}, a set of M possibility
distributions can be defined as follows:
C
m
C
m
π : 0,1
(P) π ((P))
D
xx
where D refers to the definition domain of the
observed feature x(P) (e.g. gray level). For each
class C
m
,
C
m
(x(P)) associates each pixel PI,
observed through a feature x(P)D, with a
possibility degree of belonging to the class C
m
, m =
1, ..., M.
Considering two classes C
m
and C
n
from the set
, different possibilistic similarity or distance
functions “Sim” can be defined between their two
possibility distributions π
Cm
and π
Cn
. The behaviour
of these functions can be studied in order to obtain a
better discrimination between classes C
m
and C
n
. To
do this, calculating a similarity matrix Sim(π
Cm
, π
Cn
)
informs us about such inter-classes behaviour and
ICPRAM2014-InternationalConferenceonPatternRecognitionApplicationsandMethods
222
will help in choosing the right measure in the given
context:
CC CC
mm mn
CC CC
nm nn
π ,ππ,π
π ,ππ,π
Sim Sim
Sim=
Sim Sim
(6)
Evaluation of similarity between classes was studied
in our previous work (Alsahwa et al, 2013). Many
existing possibilistic similarity and distance
functions, which are the most frequently
encountered in the literature, are used for this
purpose.
The similarity measure Sim
∞
derived from the
L
∞
-norm called Maximum distance (equation 8), a
particular case of the Minkowski Lp-norm (equation
7), was the most suitable among the selected
functions to describe the similarity between the two
classes.
p
p
ii
i=1
pC C C C
mn m n
L π ,π = π x-π x
D
(7)
iiCC C C
mn m n
i=1
maxL π ,π = π x-π x
D
(8)
p
CC
mn
p
p
L
π ,π 1
Sim
D
(9)
4 THE PROPOSED PIXEL
UNMIXING APPROACH
As previously detailed, samples initial sets are used
to estimate the probability density functions of every
thematic class. These functions are transformed into
possibility distributions through the application of
the Pr- Dubois-Prade’s transformation. A local
possibility distribution (P
0
) is constructed around
each pixel of the analyzed image I.
The similarity measure Sim
∞
is used to quantify
the similarity between this local possibility
distribution and each of the M estimated possibility
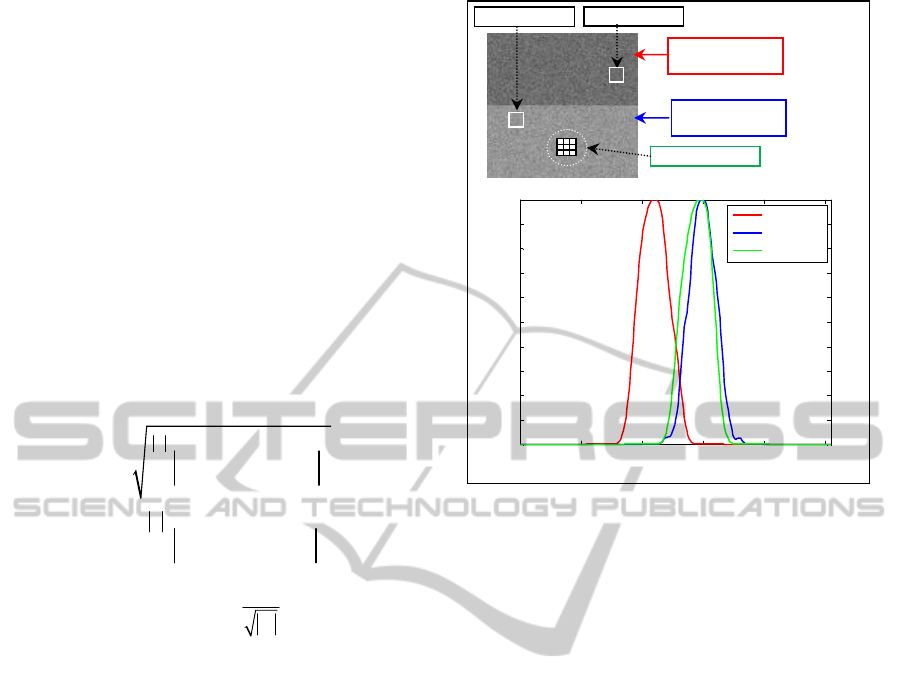
distributions. Figure 1 shows the estimated
possibility distributions in the case of synthetic
image composed of two classes generated by a
Gaussian distribution.
All the measured similarity values between
possibility distributions of classes C
1
, C
2
and the local
possibility distribution for every pixel in the image I
are
transformed into percentages as the following:
i0 m0
M
iCp Cp
m1
aSimπ ,π /Simπ ,π
(10)
Figure 1: Synthetic image, possibility distributions of
classes C
1
, C
2
and the local possibility distribution in a
subzone around the pixel of interest P
0
.
where a
i
(P
0
) is supposed to be the “abundance” of
the i
th
predefined thematic class in the considered
pixel P
0
. ∑Sim
∞
serves as a normalizing factor.
It is worthwhile to notice that high overlapping
case (high discrimination complexity) between the
predefined thematic classes is treated in the
proposed approach. In the case of low overlapping
(low discrimination complexity), the “abundance” of
a predefined thematic class in the considered pixel
P
0
is roughly inversely proportional to the distance
between the pixel vector and the mean of that class
(Wang, 1990).
The simplest and most widely used approach, the
linear mixture model (Adams et al., 1986), is used in
the proposed unmixing approach. This model is
based on the assumption that a linear combination
exists between the pixel brightness and the M
predefined thematic class. The spectral reflectance
of a pixel is the sum of the spectral reflectances from
the predefined thematic classes weighted by their
relative “abundances”:
M
ii
i1
BaB
(11)
where B is brightness value of the considered pixel
P
0
, B
i
is brightness value of the i
th
predefined
thematic class (i.e. mean of all brightness values of
the pure pixels contained in the i
th
class), and a
i
is it’s
0 50 100 150 200 250
0
0.1
0.2
0.3
0.4
0.5
0.6
0.7
0.8
0.9
1
gray level
possibility
Poss.dist.(C
1
)
Poss.dist.(C
2
)
(P
0
)
Subzone around P
0
C
1
:
G
(m
1
,σ
1
)
C
2
:
G
(m
2
,σ
2
)
C
1
Learning zone
C
2
Learning zone
AMethodofPixelUnmixingbyClassesbasedonthePossibilisticSimilarity
223
abundance in the considered pixel P
0
. There are two
constraints on the abundances that should be
satisfied: the abundances must all be non-negative to
be meaningful in a physical sense (a
i
≥ 0) (Keshava,
2003), and must sum to one (∑a
i
=1).
A classification step is conducted at the end of
the proposed approach. This step consist in the
process of assigning a class to the considered pixel
P
0
by determining the nearest class via the similarity
function Sim
∞
used to measure the similarity
between this pixel’s local possibility distribution and
possibility distributions of each of the M classes.
5 EXPERIMENTAL RESULTS
In many applications, collecting mixed pixels and
determining their exact abundances of the
predefined thematic classes is very difficult.
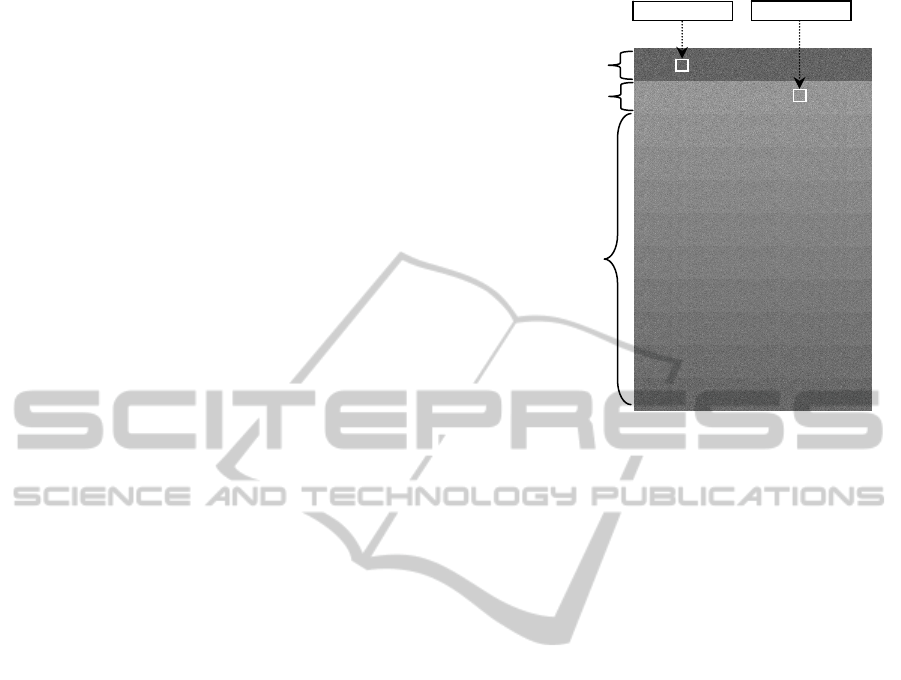
Therefore, a 550×250 pixel synthetic image, given in
figure 3, is generated. This image is composed of
eleven sectors. The first and second sector is
assumed to contain two “pure” thematic classes
generated by two Gaussian distributions G(m1=100,
σ1=15) and G(m2=150, σ2=15). Pixels of sectors
from three to eleven are generated as a linear
mixture of the first and second sector pixels. The
abundances of class C1 and class C2 in these mixed
pixels is varying incrementally by 10%. For
instance, the abundance of class C1 in the third
sector is 10% (resp. abundance of class C2 is 90%)
and in the forth sector 20% (resp. abundance of class
C2 is 80%), etc. 7×7 pixel learning zones positioned
by the expert (as being representative areas of the
considered thematic classes) are also illustrated on
the generated image.
5.1 Estimation of Classes’ Abundances
in the Mixed Pixels
Using the learning zones, the initial estimation of the
class probability density functions are established
based on the KDE (Kernel Density Estimation)
approach. The application of the Pr- Dubois-
Prade’s transformation allows obtaining the
possibility distributions for each class in the
analyzed image.
A 3x3 pixel window centered on each pixel is
considered as the local spatial possibilistic context
and then local probability density functions are
established based on the KDE approach. The
application of the Pr- Dubois-Prade’s
transformation allows obtaining the local possibility
distributions.
Figure 2: Synthetic image composed of two classes and
their learning zones.
Abundances of the predefined thematic classes
in each sector, from three to eleven, can be estimated
from the possibilistic similarity values. In each of
these sectors, the proposed approach, using the
possibilistic similarity measure Sim
∞
, is applied on
all its pixels and their possibilistic similarity values
of each thematic class are calculated. The mean and
standard deviation of these possibilistic similarity
values for each class is given in the Table 1.
A close analysis of the obtained results shows
that the abundances of the predefined thematic
classes in the mixed pixels can be estimated from the
possibilistic similarity values. This estimation
conforms well to the values used in synthetic image
generation. For instance, it can be estimated that the
fifth sector contains about 28% of class C
1
and 72%
of class C
2
while the used values in synthetic image
generation are 30% of class C
1
and 70% of class C
2
.
The small values of standard deviation are another
indication that this estimation is quite consistent
with the values used in synthetic image generation.
5.2 Evaluation of the Improvement in
Overall Classification Accuracy
The above synthetic image (figure 2) is classified
using the proposed approach and the conventional
Bayesian approach, respectively. The classification
recognition rate is then calculated in order to
compare the classification results of the two
approaches (Table 2).
Analysis of the obtained results shows an overall
Sector 1 (class C
1
)
Sectors 3-11
(Linear mixture
of C
1
and C
2
)
Sector 2 (class C
2
)
C
1
Learning zone
C
2
Learning zone
ICPRAM2014-InternationalConferenceonPatternRecognitionApplicationsandMethods
224
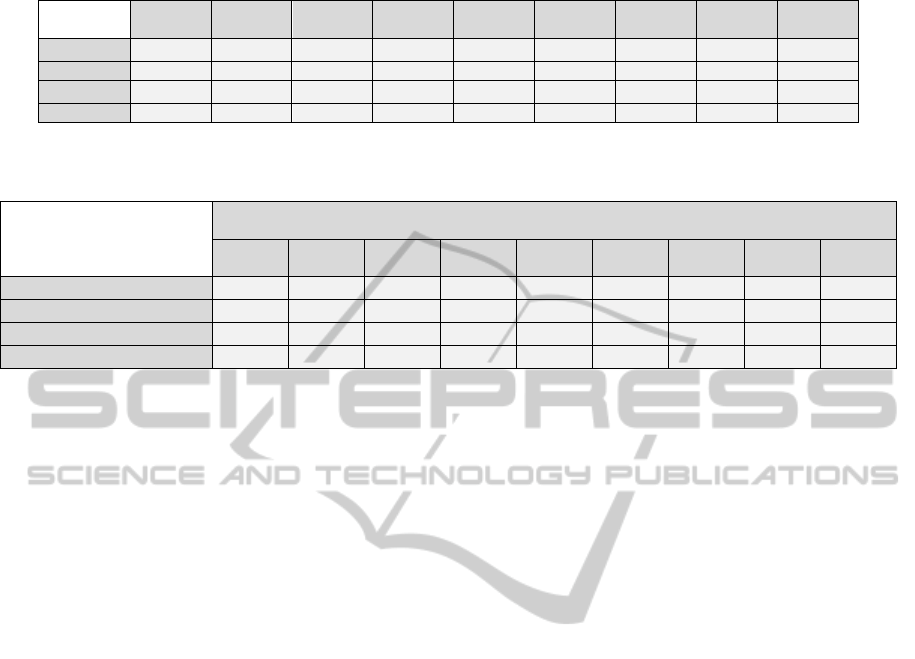
Table 1: Abundances of the predefined thematic classes in each sector.
C
1
(10%)
C
2
(90%)
C
1
(20%)
C
2
(80%)
C
1
(30%)
C
2
(70%)
C
1
(40%)
C
2
(60%)
C
1
(50%)
C
2
(50%)
C
1
(60%)
C
2
(40%)
C
1
(70%)
C
2
(30%)
C
1
(80%)
C
2
(20%)
C
1
(90%)
C
2
(10%)
Mean (C
1
)
0.14 0.20 0.28 0.39 0,50 0.61 0.72 0.79 0.87
Std (C
1
) 0.07 0.08 0.09 0.10 0,10 0.09 0.08 0.08 0.06
Mean (C
2
)
0.86 0.80 0.72 0.61 0,50 0.39 0.28 0.21 0.13
Std (C
2
) 0.06 0.07 0.09 0.10 0,10 0.10 0.09 0.07 0.06
Table 2: Classification recognition rate of the predefined thematic classes in each sector calculating first by the proposed
approach and second by the Bayesian approach
Recognition rate %
C
1
(10%)
C
2
(90%)
C
1
(20%)
C
2
(80%)
C
1
(30%)
C
2
(70%)
C
1
(40%)
C
2
(60%)
C
1
(50%)
C
2
(50%)
C
1
(60%)
C
2
(40%)
C
1
(70%)
C
2
(30%)
C
1
(80%)
C
2
(20%)
C
1
(90%)
C
2
(10%)
Proposed approach (C1)
0 1 1 11 49 93 99 100 100
Proposed approach (C2)
100 99 99 89 51 7 1 0 0
Bayesian approach (C1)
2 4 12 27 51 28 88 95 99
Bayesian approach (C2)
98 96 88 73 49 72 12 5 1
improvement in classification accuracy using the
proposed approach. This improvement has been
achieved 17% in some cases (e.g. C
1
(40%) and
C
2
(60%)). In addition to this improvement in
classification accuracy, the estimation of the classes’
abundances in the mixed pixels (section 5.1) enable
the assessing of the classification accuracy which, in
his turn, may integrate in the interpretation of the
analyzed scene. For instance, the classification of the
third sector is 100% class C
1
with a small deviation
of the assignment to its pixels (about 14% of class
C
2
) while the classification result of the forth sector
is also about 100% class C
1
but with a bigger
deviation of the assignment to its pixels (about 20%
of class C
2
). It is important to note that this
assessment of accuracy cannot be done using the
conventional pixel-based images classification
systems
6 CONCLUSIONS
In this study, a pixel unmixing approach was
developed based on the possibility theory. At the
first time, the spatial context is exploited to construct
a local possibility distribution around each
considered pixel. Secondly, the notion of
possibilistic similarity is used in order to assess the
similarity between the locale possibility distribution
and each of the class possibility distributions. The
first results on a synthetic image (compared to the
results obtained using a Bayesian approach) seem
promising. Information about pixel’s content of the
predefined thematic classes becomes available and
more classification accuracy is achieved. Hence, this
may lead to better interpretation of the analyzed
scene. A future research work will be to validate
these early results on various types of images with
more than two classes.
REFERENCES
Tso, B., and Mather, P. M., 2009. classification methods
for remotely sensed data. taylor & francis group.
Van der Meer, F., 1997. Mineral mapping and Landsat
Thematic Mapper image classification using spectral
unmixing, Geocarto International, vol. 12, pp.27-40.
Wang, F., 1990. Fuzzy supervised classification of remote
sensing images, IEEE Transactions on Geoscience
and Remote Sensing, vol. 28, pp.194-201.
Foody, G. M., and D. P. Cox, 1994. Sub-pixel land cover
composition estimation using a linear mixture model
and fuzzy membership functions, International
Journal of Remote Sensing, vol 15, pp. 619-631.
Plaza, A., Martin, G. Plaza, J., Zortea, M., and Sanchez,
S., 2010. Recent developments in spectral unmixing
and endmember extraction”, Optical Remote Sensing,
vol 3, PP.235-267, 2010.
Rabah, Z. B., 2011. Demixage spectral d’images
hyperspectrales et fusion possibiliste des
connaissances : application a l’erosion hydrique. thèse,
telecom Bretagne, France.
Epanechnikov, V. A., 1969. Non-parametric estimation of
a multivariate probability density. Theory of
Probability and its Applications. Vol. 14, pp 153-158.
Dubois, D., Prade, H., 1983. Unfair Coins and Necessity
Measures: towards a possibilistic Interpretation of
Histograms. Fuzzy Sets and Syst. Vol.10, pp. 15-20.
Zadeh, L. A., 1978. Fuzzy Sets as a Basis for a Theory of
possibility. Fuzzy Sets Syst, vol. 1, pp.3-28.
Dubois, D., Prade, H., 1980.Fuzzy Sets and Systems:
Theory and Applications. Academic Press, New York.
AMethodofPixelUnmixingbyClassesbasedonthePossibilisticSimilarity
225

Dubois, D., Prade, H., 1992. When upper probabilities are
possibility measures. Fuzzy Sets and Systems, vol. 49,
pp. 65-74.
Medasani, S., Kim, J., and Krishnapuram, R., 1998. An
overview of membership function generation
technique for pattern recognition, International
Journal of Approximate Reasoning, vol. 19, pp. 391-
417.
Alsahwa, B., Almouahed, S., Gueriot, D., and Solaiman,
B., 2013. Possibilistic similarity based Image
classification. ICPRAM2013, 15-18 February,
Barcelone, Spain.
Adams, J. B., Smith, M. O., and Johnson, P. E., 1986.
Spectral mixture modeling: A new analysis of rock
and soil types at the Viking Lander 1 site. Journal of
Geophysical Research, vol. 91, pp.8098-8112.
Keshava, N., 2003. A survey of spectral unmixing
algorithms, Lincoln laboratory journal, vol. 14,
Number 1.
ICPRAM2014-InternationalConferenceonPatternRecognitionApplicationsandMethods
226
