
Fuzzy Set Theoretical Analysis of Human Membership Values on the
Color Triangle
Mapping from the Color Triangle (Antecedent) via the Color Triangle
(Consequent) to the Tone Triangle
Shun Kato
1
, Itsuki Shinomiya
2
, Fumihiko Mori
2
and Naotoshi Sugano
2
1
Graduate School of Electoronics and Information Engineering,Tamagawa University, Machida, Tokyo, Japan
2
Department of Intelligent Information Systems, Tamagawa University, Tokyo, Japan
Keywords: Fuzzy Set Theory, Three Additive Primary Colors, Membership Function, RGB System, Color Triangle,
Vague Color, Membership Value, Center of Gravity, Tone Triangle.
Abstract: The present study considers a fuzzy color system in which three membership functions are constructed on a
color triangle. This system can process a fuzzy input to a color triangle system and output the center of
gravity of three weights associated with respective grades. Three fuzzy sets (red, green, and blue) are
applied to the color triangle relationship. By treating the attributes of redness, greenness, and blueness on
the color triangle, a target color can be easily obtained as the center of gravity of the output fuzzy set. In the
present paper, 0% triangle is consisted of the lines of 0% redness, 0% greenness, and 0% blueness of the
attributes. The colors on 0% triangle map into the right corner of tone triangle (on C or near C). As compare
the inference results for fuzzy inputs with those for crisp inputs, move to W (white region). The input-output
relationship is shown by redness and chromaticness. The inference outputs for crisp inputs and for fuzzy
inputs are obviously different. Those for crisp inputs show vertically linear.
1 INTRODUCTION
Using the additive method of color mixing as
reported in previous study (Sugano, 2007), the
relationship between fuzzy sets on the color triangle
and fuzzy conical membership functions is
examined. A color triangle (planar region) represents
the hue and saturation of various colors (Tilley,
1999). The six fundamental colors and white can be
represented on a color triangle (see Fig. 1a). Vague
colors on the color triangle and the chromaticity
diagram are also clarified.
A recent study (Sugano, 2011) reported a
technique that used a fuzzy set theoretical method
and an additive color mixing method to obtain
expressions for the tone triangle in the red-green-
blue (RGB) system. The relationship between two or
three fuzzy sets on the tone triangle (antecedent) in
Fig. 1b and the conical fuzzy inputs was examined.
The six fundamental colors and white can be
represented on the color triangle (consequent) in Fig.
1a.
In the unpublished study, we reexamine a
technique for obtaining expressions of the color
triangle in the RGB system. The output of this
system can be represented on a tone triangle, which
clarifies colors that were vague on the color triangle.
In the proposed system, the average color value is
determined as the center of gravity of the attribute
information for vague colors.
The motivation of this study is to better
understand human-computer interaction with human
subjectivity. The specific objective of this paper is to
determine how fuzzy inputs (as the human
membership values) are mapped from the color
triangle (antecedent) via the color triangle
(consequent) to the tone triangle. The applications
for which this fuzzy set theoretical approach is
useful include vague color information processing
and color identification.
2 METHODS
2.1 Color Triangle and Additive Color
Mixture
Additive color mixing occurs when two or three
239
Kato S., Shinomiya I., Mori F. and Sugano N..
Fuzzy Set Theoretical Analysis of Human Membership Values on the Color Triangle - Mapping from the Color Triangle (Antecedent) via the Color
Triangle (Consequent) to the Tone Triangle.
DOI: 10.5220/0004826502390246
In Proceedings of the 3rd International Conference on Pattern Recognition Applications and Methods (ICPRAM-2014), pages 239-246
ISBN: 978-989-758-018-5
Copyright
c
2014 SCITEPRESS (Science and Technology Publications, Lda.)

beams of differently colored light combine.
(a)
W
R
Y
G
Cy
B
M
(b)
dull
C
light
W
gray
S
dark
Figure 1: (a) Color triangle. A point in the plane of the
triangle system represents the hue and saturation of a
color. Cy is cyan. (b) Tone triangle. A point in the plane of
the triangle system represents the lightness and saturation
of a color. C is the maximal color of each hue. S is black.
It has been found that mixing just three additive
primary colors (red, green, and blue) can produce
the majority of colors. In general, a color vector can
be described by a scalar and a direction. These
quantities are referred to as the tristimulus values, R
for the red component, G for the green component,
and B for the blue component, and are given as
follows:
BGRC
(1)
This is referred to as the RGB color model (Fig. 2)
and allows colors to be represented by a planar
diagram. The RGB color model can be used to
identify colors as the red, green, and blue
components (
R, G, B) corresponding to the three
axes of color space, as shown in Fig. 2. The
coordinates (
r, g, b) on the color triangle can specify
one of a range of colors. These coordinates
correspond to the relative amounts of
R, G, and B
that make up the color. For example, the coordinates
specifying the center of the color triangle represent
the case in which the three primary colors are mixed
in equal proportion and thus indicate the color white.
Such representations are referred to as chromaticity
diagrams. A chromaticity diagram represents hue
and saturation, but not lightness (Tilley, 1999). On
the color triangle (the dotted area in Fig. 2) (Valberg,
2005), the percentages of redness, greenness, and
blueness, where the total of the three attributes is
equivalent to 100%, specify a color. In order to
indicate only the direction of a color vector, i.e., the
chromaticity, the redness
r, greenness g, and
blueness
b are obtained as follows:
BGR
R
r
(2)
BGR
G
g
(3)
BGR
B
b
(4)
1
bgr
(5)
In other words, the direction is shown as the ratio of
the tristimulus values
R, G, and B. The total of these
ratios is equal to 1, as shown in Eq. (5).
In Fig. 2, at red
R, the components are (R, G, B)
= (1, 0, 0) and the coordinates are (
r, g, b) = (1, 0, 0).
At red, green, and blue, the components are (R, G,
B
) = (r, g, b); however, at yellow, for instance, the
components are (R, G, B) = (1, 1, 0) but the
coordinates are (
r, g, b) = (0.5, 0.5, 0). Colors on the
three squares WMRY, WYGCy, and WCyBM in
Fig. 3
a (color space) correspond to those on the
three diamonds WMRY, WYGCy, and WCyBM in
Fig. 1
a (color triangle). Thus, all of the colors on the
upper three squares in a color space can be displayed
in a color triangle.
2.2 Color Triangle and Tone Triangle
Designs
Next we consider the color triangle and the tone
triangle in RGB color space (Fig. 3). In the color
space, the color triangle is fixed, as shown in Fig.
3
a; for instance, when the hue of a color is red R, the
tone triangle is fixed, as shown in Fig. 3b.
In Fig. 1
a, Cy is cyan, midway between blue and
green (No. 6: cyan Cy in Fig. 4a). In Fig. 1b, C is the
maximal color (each hue at the maximum
chromaticness) (Sivik, 1997) (No. 66: red
R in Fig.
ICPRAM2014-InternationalConferenceonPatternRecognitionApplicationsandMethods
240

4b) as a hue.
The color triangle in Fig. 3a is an equilateral
triangle, whereas if the hue is red
R, the tone triangle
is a right triangle. When the hue of a color is orange,
i.e., midway between yellow and red, the tone
triangle is nearly an isosceles triangle. By shaping
another triangle into an equilateral triangle, it is
possible to normalize the equilateral coordinates in
the fuzzy system.
The present study considers a system of the three
primary colors (red, green, and blue: RGB),
presented on a color triangle.
When the hue of a
color (e.g., red, green, or blue) is fixed on the color
triangle in Fig. 1
a, the color exists on the tone
triangle in Fig. 1
b. The colors C, W, and S in Fig. 1b
are the maximal color (Sivik, 1997), white, and
black, respectively, and dark (or deep), light (or
pale), and dull are modifiers.
The color triangle and tone triangle in Fig. 4
correspond to the schematic diagrams shown in Fig.
1.
The colors
B, Cy, G, Y, R, M, and W in Figs. 1a,
2, and 3
a are No. 1: blue, No. 6: cyan, No. 11: green,
No. 51: yellow, No. 66: red, No. 46: magenta, and
No. 104: white in Fig. 4
a. White (No. 104) is
surrounded by six neighboring colors, as shown in
the detail inset, and these seven colors (Nos. 101–
107) are surrounded by No. 34, No. 35, and No. 42.
The details of the extension of the fundamental type
from 66 colors (excluding white) to 496 colors
(including white) are examined in Appendix
(figure).
The color names or modifiers in Fig. 1
b are No.
1: black, No. 6: gray, No. 11: white, No. 46: dark (or
deep), No. 51: light (or pale), and No. 66: the
maximal color (Sivik, 1997) (e.g., vivid red) in Fig.
4
b.
S
R
M
Cy
W
B
Y
R
B
Y
(1, 0, 0)
(
0
,
1
,
0
)
(0, 0, 1)
(r, g, b)
= (0.5, 0.5, 0)
(R, G, B)
= (1, 1, 0)
G
(
0, 0, 0
)
G
Figure 2: Color triangle and additive color mixture. The
origin S is black.
(a)
S
G
R
M
Cy
W
B
Y
(b)
S
G
R
M
Cy
W
B
Y
Figure 3: (a) Color triangle and (b) tone triangle, in the
same color space. S is black. Cy is cyan.
2.3 Fuzzy Rules
Figure 5 illustrates a fuzzy input set, fuzzy input on
the color triangle (antecedent), a crisp output set,
fuzzy output on the color triangle (consequent), and
crisp output on the graphic plane. The fuzzy rules
are as follows (see Fig. 5):
kk
k
OisVthenAisUifR :
(6)
where
k is the rule number (k = 1, 2, 3)
corresponding to the components of
R, G, and B, A
k
is a fuzzy set of inputs,
O
k
is a crisp set of outputs, U
= (r
i
, g
i
, b
i
) is the input parameter (variable), and V =
(r
o
, g
o
, b
o
) is the output parameter. Here, U and V are
fixed to these RGB parameters. A fuzzy set
A
k
of
inputs shows a triangular pyramid-like shape with a
plateau at the corner points
R
i
, G
i
, and B
i
, and a crisp
set
O
k
of outputs of rule R
k
is shown at corner points
R
o
, G
o
, or B
o
(a fuzzy set O
k
’, indicated by vertical
arrows in Fig. 5b) on the color triangle, and the
output is
O
k
if the input is A
k
.
The fuzzy inference method is as follows. Let the
inputs be
r
i
= r
i
’, g
i
= g
i
’, and b
i
= b
i
’.
1) In the input of rule
R
k
, grade α
k
= A
k
(U’), where k
= 1, 2, 3.
2) The output of rule
R
k
, a crisp output set, is shown
as a vertical post.
3)
O
k
’ = α
k
O
k
, where O
k
’ is a fuzzy set (vertical
arrow), and
O
k
is a crisp set (vertical post) in Fig.
5b.
FuzzySetTheoreticalAnalysisofHumanMembershipValuesontheColorTriangle-MappingfromtheColorTriangle
(Antecedent)viatheColorTriangle(Consequent)totheToneTriangle
241

11
21
10 30
9
19
29
38
8
7
18
28
37
45
44
51
36
6
17
27
5
4
3
2
16
26
35
43
50
56
15
25
34
42
14
24
33
41
48
54
59
13
23
32
40
47
53
58
49
55
60
63
62
65
1
12
22
39
31
46
52
57
61
64
66
20
35
34
42
107
105
102
101
104
103
106
45
30
38
10
21
2
12
.
56
55
54
53
52
60
59
58
57
63
62
61
65
64
50
49
48
47
37
24
23
32
31
14
.
20
19
29 9
39
13
40
22
3
8
7
5
43
42
36
35
34
27
26
18
17
16
44
28
41
33
25
15
1
46
66
6
51
11
4
Figure 4: (a) Sixty-six crisp color inputs and white, with
six neighboring colors (detail) on the color triangle. (b)
Sixty-six crisp color inputs on the tone triangle.
The complete inference is the results O’ of rules
R
1
, R
2
, and R
3
:
'
3
'
2
'
1332211
'
OOOOOOO
(7)
The output parameter,
V’ = (r
o
’, g
o
’, b
o
’), is
equivalent to the coordinates of the center of gravity
of the output fuzzy set of
O’. In addition, in Fig. 5c,
V’ = (r
o
’, uk’) corresponds to the coordinates of the
graphical system, where uk’ (on the vertical axis) is
calculated from
g
o
’ and b
o
’, and uk’ shows the value
(as the distance from B) on the line B-G.
A fuzzy input set
A
1
of red can be characterized
by the following membership function:
s
rsrukr
iii
1
;),(
1
(8)
s
rukr
ii
1
;1),(
1
(9)
where s is the slope of projection, and s ranges from
0.02 to 0.03.
The membership functions of green and blue are
described by similar equations.
R
i
G
i
B
i
α
k
V’
R
o
G
o
B
o
α
k
b
i
’
g
i
’
r
i
’
b
o
’
g
o
’
r
o
’
b
o
b
i
U’
A
k
O
k
V’
R
o
B
o
Redness
uk’
r
o
g
i
r
i
Unknown
Blueness
Redness
1
0
1
0
uk
r
o
’
a
b
c
Redness
O
k
’
G
o
r
o
g
o
Greenness
S
R
C’
W
B
R
B
C
(1, 0, 0)
(
0
,
1
,
0
)
(0, 0, 1)
(r, g, b)
(R, G, B)
G
(0, 0, 0)
G
C
’
B
S
Chromaticness
l
o
’
c
o
Li
g
htness
l
c
o
’
ef
W
d
S
R
C’
W
B
R
B
C
(1, 0, 0)
(
0
,
1
,
0
)
(0, 0, 1)
G
(0, 0, 0)
G
C
I
n
Figure 5: Fuzzy system using the membership function of
fuzzy sets
A
j
(red) with (a) conical fuzzy input I
n
on the
color triangle (antecedent), (
b) output crisp sets O
k
, three
weights (vertical arrows) on the color triangle
(consequent), and (
c) a color coordinate on the graphic
plane, (
d) color vectors and a color triangle, (e) a
compound vector with a tone triangle in the color space,
and (
f) a tone coordinate on the graphic plane.
2.4 Extraction of Tone Triangles
Three weights as grades, α
1
, α
2
, and α
3
(vertical
arrows) in Fig. 5b, are scalar values in the RGB
components. A color vector C
→
(a compound vector
with these values) can be drawn in the color spaces
in Fig. 5d (and 5e). The intersection of color vector
C
→
and color triangle (dotted area) in 5d, is equal to
V’ in 5b. In 5e, the tone triangle (dotted area)
includes the color vector C
→
. This triangle CWS is
normalized to equilateral coordinates. In this case,
the maximal color C (Fig. 1b) is B (blue) in 5f. The
coordinate C’ (α
1
, α
2
, α
3
) of vector C
→
in 5d is equal
to C’ (c
o
’, l
o
’) in 5f.
2.5 Fuzzy Sets
The membership values µ
k
(r
i
’, g
i
’, b
i
’) of the fuzzy
input set A
k
on the color triangle; µ
k
(r
i
’, g
i
’, b
i
’) is
equal to µ
k
(r
i
’, uk’). The membership function µ
k
is
based on the values (RGB components) of the seven
colors (R, Y, G, C, B, M, and W).
a
b
ICPRAM2014-InternationalConferenceonPatternRecognitionApplicationsandMethods
242

In Fig. 6, the shape of the fuzzy set is shown by
including W
i
(white). The top of the plateau is shown
to have a diamond-like shape.
The intersection of a fuzzy input set A
k
with a
fuzzy input I
n
is A
k
∩ I
n
. Grade α
k
’
= height (A
k
∩ I
n
).
If the input is crisp, α
k
’ becomes α
k
. R
o
is the new
red output. Proj(O
k
) is the projection of an output
crisp set at the corner point R
o
(see Fig. 5b).
The system considered in the present study can
translate the input data U of a vague color to output
data V of a simple color on the color triangle
(consequent). The fuzzy input is transformed using
the center U’ = (r
i
’, g
i
’, b
i
’).
Table 1: Number of subjects in the experiment. Semantic
differential method is used. 66 is fundamental type.
Type No. of subjects Male Female Age
66 86 47 39 10-70
100
75
50
25
0
0
50
100
0.0
0.5
1.0
Gra d e
Unknown (%)
Redness (%)
Figure 6: Membership function μ
1
(r
i
, uk) of fuzzy set A
1
(red) on the color triangle. The basal triangle corresponds
to Fig. 1
a.
3 EXPERIMENTAL METHODS
For the experiment, 86 (in Table 1) undergraduate
students, graduate students, and participants in a
university festival volunteered to participate as
subjects for this study. The subjects sat in a chair
and were requested to watch a display continuously.
Using the ensemble average of the fuzzy sets
obtained from the experiment result then, the
normalized membership values of subjects are
computed (Sugano and Chiba, 2007).
The experiments were performed in an isolated
area in order to restrict visual cues with regard to the
display.
In this study, using a graphical user interface
(GUI) for the questionnaire, 86 subjects compared
the differences between a target color (e.g. red) and
neighboring colors of 65 colors (Fig. 4a) using
semantic differential (SD) method for color words.
4 RESULTS AND DISCUSSION
Figures 7-12 show the ensemble average of the
experimental results for six colors (red, green, blue,
cyan, yellow, magenta) on the coordinates (r
i
’, uk’)
in fundamental type (66 colors) using SD method.
Figure 13
illustrates a relationship between the
redness value r
i
and the unknown value uk. Filled
circles indicate the centers of gravity for fuzzy
inputs. A center (average) of fuzzy input is shown as
a trend. Open circles indicate crisp inputs of colors
(as target colors). Target color means the center of
cone as vagueness in Figs. 5a. The differences
between target colors (open circles) and the outputs
(filled circles) are not so large.
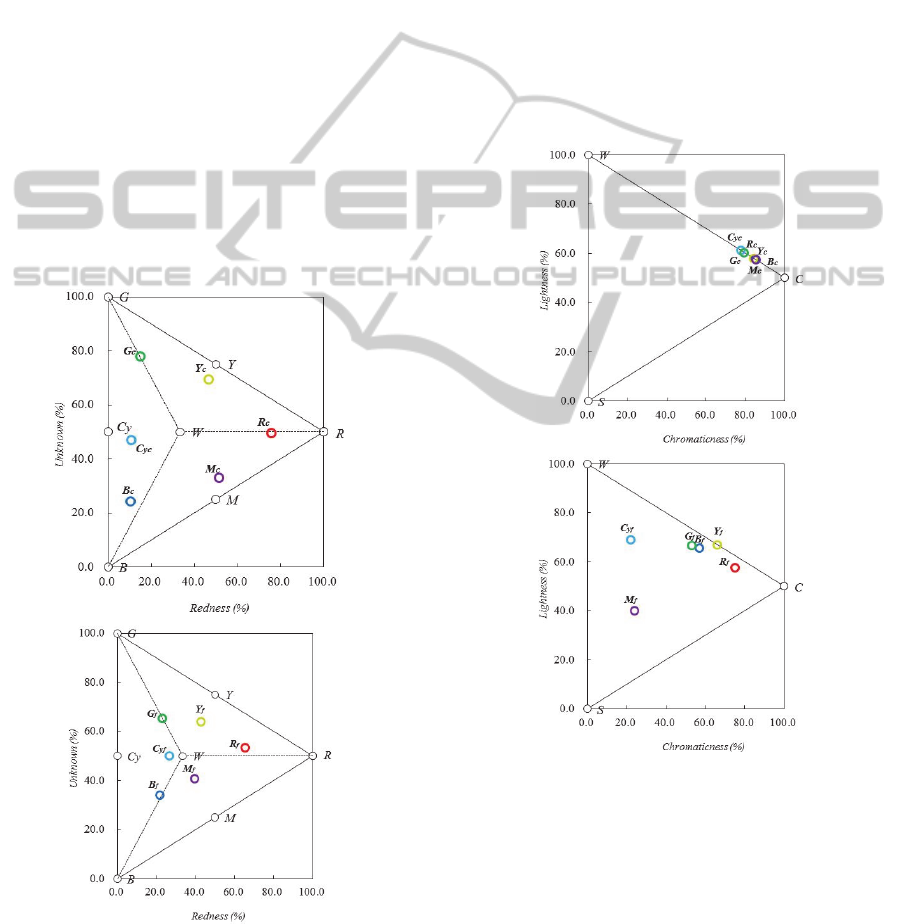
Figure 14 illustrates a relationship between the
redness value r
o
and the unknown value uk. In a,
filled circles indicate
the inference outputs for crisp
inputs as the centers of gravity of fuzzy inputs. Open
circles also indicate crisp inputs of colors
(as target
colors).
In b, filled circles indicate the inference
outputs for fuzzy inputs of colors, open circles also
indicate crisp inputs of colors
(as target colors). The
outputs (filled circles) for fuzzy inputs are grouped
at the center of the color triangle. The open and
filled circles are clearly different in this case. The
differences between target colors (open circles) and
the outputs (filled circles) are so large. The
differences in a are smaller than those in b. The
experimental results for GUI are also shown in
Sugano and collaborators (2009).
Figure 7: Membership values of red-relevant colors as
fuzzy input.
M
i
Y
i
R
i
W
i
FuzzySetTheoreticalAnalysisofHumanMembershipValuesontheColorTriangle-MappingfromtheColorTriangle
(Antecedent)viatheColorTriangle(Consequent)totheToneTriangle
243
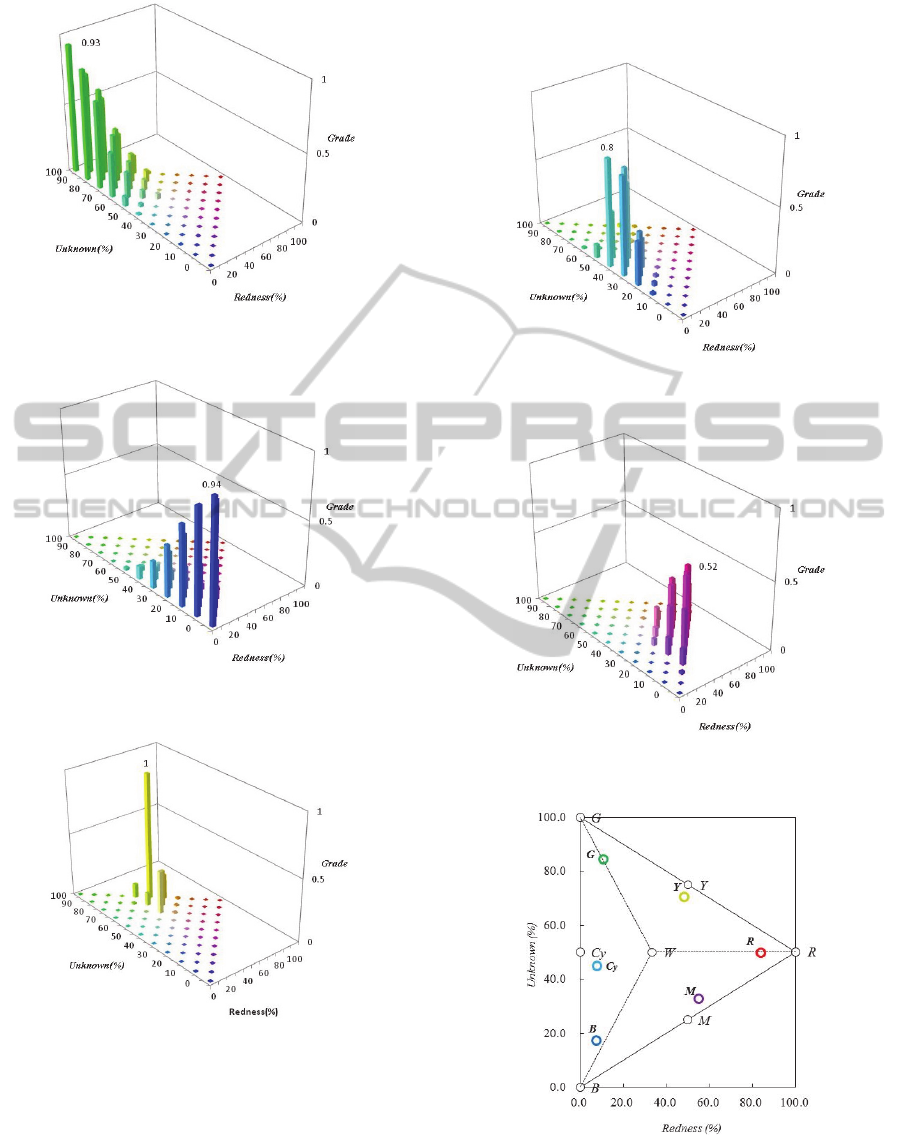
Figure 8: Membership values of green-relevant colors as
fuzzy input.
Figure 9: Membership values of blue-relevant colors as
fuzzy input.
Figure 10: Membership values of yellow-relevant colors
as fuzzy input.
Vague color inputs to the fuzzy system, the
system outputs crisp color in the RGB, and also
outputs crisp color on the graphical plane (Fig. 14).
These inference results for fuzzy 496 colors (Sugano
et al., 2009) and fuzzy 66 colors (Sugano and
Shinomiya, 2010) are similar. These inference
results for partition method (Sugano and Chiba,
2007)
and semantic differential method are also
similar.
Figure 11: Membership values of cyan-relevant colors as
fuzzy input.
Figure 12: Membership values of magenta-relevant colors
as fuzzy input.
Figure 13: Centers of gravity of fuzzy inputs (filled
circles).
W is white (open circle).
Figure 15a illustrates the relationship between
the lightness l
o
and the chromaticness c
o
obtained
ICPRAM2014-InternationalConferenceonPatternRecognitionApplicationsandMethods
244
from data (c
o
’, l
o
’). The points (open circles) indicate
the outputs for crisp inputs of colors. The inference
outputs for crisp inputs are grouped at the upper side
of the tone triangle. This effect is caused by the
fuzzy inference output.
Figure 15b also illustrates the relationship
between the lightness l
o
and the chromaticness c
o
obtained from data (c
o
’, l
o
’). The points (filled
circles) indicate the outputs for fuzzy color input.
The inference outputs for fuzzy inputs are also
grouped at the upper side of the tone triangle. The
inference outputs for crisp inputs in Fig. 15a are
different from those for fuzzy inputs in Fig. 15b.
For example, the output is far from the corner C
of the triangle (Fig. 15b). That is, vagueness
increases. However, the input-output (three
attributes-chromaticness) relationship cannot be seen
in Fig. 15.
If the height of the human membership values
(the indicated possibility) in Figs. 7-12 has grade
less than 1.0, the points in Fig. 15 move to the inside
of the tone triangles.
Figure 14: Inference outputs for (
a) crisp inputs and (b)
fuzzy inputs, on the graphic plane (Fig. 5
c). Suffix f shows
fuzzy inference output.
W (open circles) as a landmark
exists in the coordinate (33.3%, 50.0%).
That is, the points that are far away from corner
C in Fig. 15 are also far away from the upper side of
a tone triangle. As a result, vagueness increases but
the possibility decreases. This can be explained in
terms of Fig. 5f. As shown, the arrow (as a
compound vector) is inside the tone triangle and
does not reach to the upper side, but if the vagueness
decreases to the minimum and the possibility
increases to the maximum, then the arrow will reach
to the corner B at the maximum chromaticness.
Alternately, if vagueness increases to the maximum,
then the arrow reaches to the corner W. On the other
hand, if the possibility decreases to the minimum,
then the arrow disappears into the corner S. However,
the complete
relationship between vagueness and
possibility is not considered in this study.
Figure 15: Inference outputs for (a) crisp inputs and (b)
fuzzy inputs. Suffix
f shows fuzzy inference output.
5 CONCLUSIONS
The present paper examined how vagueness is
presented on the color triangle using semantic
differential methods and performed fuzzy set
theoretical analysis. The subjects are asked the
difference between fundamental color (as a target
a
b
a
b
FuzzySetTheoreticalAnalysisofHumanMembershipValuesontheColorTriangle-MappingfromtheColorTriangle
(Antecedent)viatheColorTriangle(Consequent)totheToneTriangle
245

color) and neighboring colors (as a sample color)
using semantic differential method. Each data and
the ensemble average of those data are fuzzy sets.
The results of experiments show a similar trend to
that for the tone triangle (Sugano et al., 2008). Using
the fuzzy inference for RGB data (as a fuzzy set), it
is found that these results move to white direction as
a center of color triangle. On the tone triangle, the
inference results of the cyan-relevant colors show
large vagueness and these of the magenta-relevant
colors show low possibility.
ACKNOWLEDGEMENTS
The authors wish to thank present and former
members of our laboratory, whose work and ideas
have contributed to this project.
REFERENCES
Sivik, L., 1997. Color Systems for Cognitive Research. In
C. L. Hardin and L. Maff (Eds.),
Color Categories in
Thought and Language
(pp. 163-193). New York:
Cambridge University Press.
Sugano, N., 2007. Fuzzy Set Theoretical Approach to the
RGB Triangular System.
Journal of Japan Society for
Fuzzy Theory and Intelligent Informatics
. 19(1), 31-
40.
Sugano, N., Chiba, Y., 2007. Fuzzy Set Theoretical
Analysis of the Membership Values on the RGB Color
Triangle.
Proc. of the IEEE International Conference
on Systems, Man, and Cybernetics
. Montreal, pp. 841-
846.
Sugano, N., Ashizawa, N., Ono H., 2008. Fuzzy Set
Theoretical Analysis of Human Membership Values
on the RGB Tone Triangle,
Proc. of Joint 4th
International Conference on Soft Computing and
Intelligent Systems and 9th International Symposium
on Advanced Intelligent Systems
. Nagoya, pp.1921-
1926.
Sugano, N., Komatsuzaki, S., Ono, H., Chiba, Y., 2009.
Fuzzy Set Theoretical Analysis of Human
Membership Values on the Color Triangle.
Journal of
Computers
. 4(7), 593-600.
Sugano, N., Shimomiya, I., 2010. Fuzzy Set Theoretical
Analysis of Semantic Data as Human Membership
Values on the Color Triangle,
Proc. of Joint 5th
International Conference on Soft Computing and
Intelligent Systems and 11th International Symposium
on advanced Intelligent Systems
. Okayama, pp.681-
686.
Sugano, N., 2011. Fuzzy set theoretical approach to the
tone triangular system.
Journal of Computers, 6(11),
2345-2356.
Tilley, R. J. D., 1999.
Colour and Optical Properties of
Materials
, An exploration of the relation-ship between
light, the optical properties of materials and colour.
New York: John Wiley & Sons.
Valberg, A., 2005.
Light Vision Color. New York: John
Wiley & Sons.
ICPRAM2014-InternationalConferenceonPatternRecognitionApplicationsandMethods
246
