
General Purpose Segmentation for Microorganisms in Microscopy
Images
S. N. Jensen
1
, R. Irani
1
, T. B. Moeslund
1
and Christian Rankl
2
1
Visual Analysis of People Lab, Aalborg University, Aalborg, Denmark
2
Agilent Technologies, Measurement Research Laboratory, Gruberstrasse, Austria
Keywords:
Cell Segmentation, Microscopy Image Analysis, Object Detection, Pixel Classification.
Abstract:
In this paper, we propose an approach for achieving generalized segmentation of microorganisms in mi-
croscopy images. It employs a pixel-wise classification strategy based on local features. Multilayer percep-
trons are utilized for classification of the local features and is trained for each specific segmentation problem
using supervised learning. This approach was tested on five different segmentation problems in bright field,
differential interference contrast, fluorescence and laser confocal scanning microscopy. In all instance good
results were achieved with the segmentation quality scoring a Dice coefficient of 0.831 or higher.
1 INTRODUCTION
Microscopy is the art of observing objects which are
normally too small to be seen by the unaided human
eye. It is one of the most important information gath-
ering tools in many different fields such as microbiol-
ogy and have remained so since it’s conception over
a hundred years ago. One of the main applications of
microscopy is the observation of microorganisms, an
important endeavor in microbiology and medical sci-
ence. Through visual magnification of a 100 times or
more, a wealth of visual information can be extracted
from even the tiniest specimens or samples. In fact
information can be so plentiful that a thorough anal-
ysis can be quite a time consuming task. Combining
microscopy with additional techniques such as time-
lapse videos and z-layering, can make the amount
of information even more staggering. This calls for
means by which the analysis tasks may be partially or
fully automated. Fortunately many microscopy anal-
ysis tasks can, on their base level, be boiled down to
locating instances of one or several specific classes
within an image, examples of this includes cancer
(Wienert et al., 2012) and malaria diagnostics (F. Bo-
ray Tek and Kale, 2009a). This means that the bulk
of the analysis work can be automated by develop-
ing a general method for detection microorganisms
within microscopy images. Unfortunately this can be
a quite challenging problem due to visual variation,
which stems from the employed microscopy type and
specific species of microorganism. A few examples
of this behavior can be observed in figure 1. In this
positional paper we will present the preliminary work
for a single segmentation method that is capable of
handling many of these visually varying problems.
2 RELATED WORK
Automatic microscopy image analysis is by no means
a new topic of research and material on the matter
have been published for more than 50 years. Re-
garding the specific subject of cell segmentation, a
survey is illustrated in figure 2 which nicely details
the number article published on cell segmentation ev-
ery 5 years as well as their overall methodology for
solving the problem. Now it clearly shows that the
amount of research gone into cell segmentation has
been steadily increasing over the last 50 years, indi-
cating a clear interest in solving the problem. How-
ever the lower part of figure 2 illustrates a major is-
sue with the research that has been performed; it suf-
fers from a very divergent methodology. Amongst
the utilized methods for achieving microorganism de-
tection are variations of watershed segmentation (Le-
brun et al., 2007) (Ao et al., 2011) (Cheng and Ra-
japakse, 2009) (bin Abdul Jamil et al., 2012), con-
tour and shape based segmentation (Wienert et al.,
2012) (Zhou, 2007) (Kujiper and Heise, 2008), color
and intensity based segmentation (Zhaozhen Ying and
Kanade, 2010) (F. Boray Tek and Kale, 2009b) (F. Bo-
690
Jensen S., Irani R., Moeslund T. and Rankl C..
General Purpose Segmentation for Microorganisms in Microscopy Images.
DOI: 10.5220/0004827106900695
In Proceedings of the 9th International Conference on Computer Vision Theory and Applications (VISAPP-2014), pages 690-695
ISBN: 978-989-758-003-1
Copyright
c
2014 SCITEPRESS (Science and Technology Publications, Lda.)
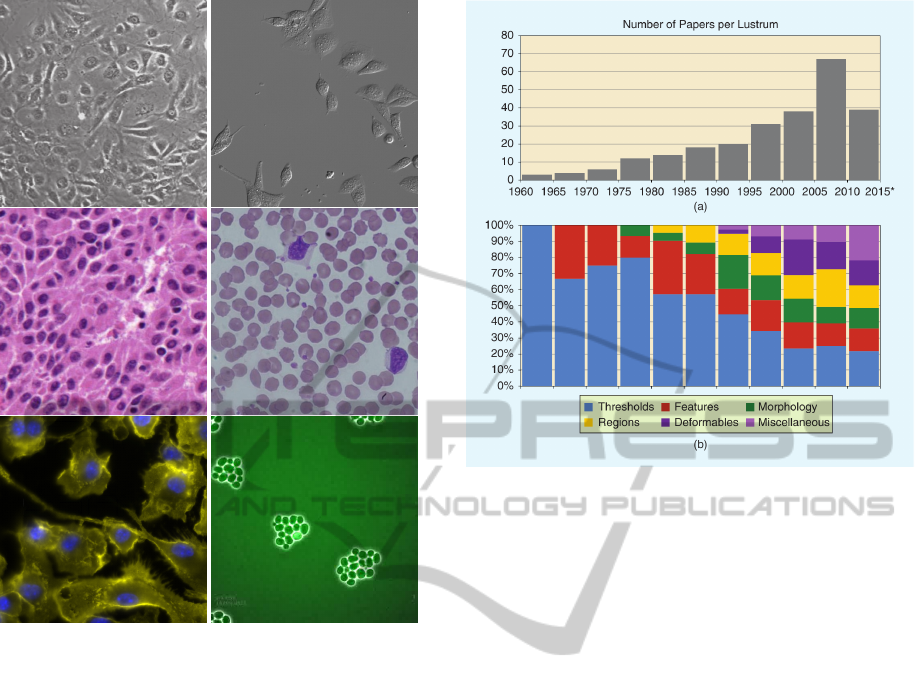
Figure 1: Examples of the visual variety posed by differ-
ent species of microorganisms and types of microscopy.
Contains images produced using bright field(Wienert et al.,
2012)(bin Abdul Jamil et al., 2012), differential interfer-
ence contrast, fluorescence(Institute, 2013) and phase con-
trast microscopy(Kane et al., 2013).
ray Tek and Kale, 2009a), wavelet based detection
(Ariel J. Bernal and Bernal, 2008) and shape based
detection (Kevin Smith and Lepetit, 2009). Addition-
ally there is a clear trend towards specialized solu-
tions, as stated in (Meijering, 2012) and which may
be observed in the previously mentioned work. The
program CellProfiler is capable of handling many
microorganism detection problems, however it does
so by simply letting the user manually choose the
specific segmentation method which is to be em-
ployed(Carpenter et al., 2006). This article will con-
tribute to the overall state of the art by introducing
a single segmentation method that may determine an
optimal segmentation rule for a specific microorgan-
ism detection problem. Segmentation is chosen as
the base of the detection strategy as it is capable of
dealing with the great variations in shape, orientation
and appearance that microorganism naturally exhibit
in microscopy images.
Figure 2: This figure illustrates the progression of research
in cell segmentation over the past 50 years, both in terms
of quantity and methodological distribution. It shows that
no real consensus has been achieved on the approach for
cell segmentation. The graph was obtained from (Meijer-
ing, 2012).
3 METHOD
The main principle of this work is the collection and
classification of pixel-wise local features. This is ac-
complished by having a machine learning algorithm
determine the optimal classification rule through su-
pervised learning. The reason for this approach is that
it provides a simple framework with a constant struc-
ture capable of handling a wide array of microorgan-
ism segmentation problems, as long as the objects are
locally distinguishable.
3.1 Features
It is difficult to ensure that a given feature set can dis-
tinguish between background and object in all plausi-
ble situation. However, it was experimentally found
that in many specific problems good segmentation
could be achieved using a feature set based on color
and gradient information. It is defined below,
¯
F(x, y) =
¯
I(x, y)
E[
¯
I(x, y)]
Var [
¯
I(x, y)]
¯g(x, y)
E[ ¯g(x, y)]
Var [ ¯g(x, y)]
(1)
GeneralPurposeSegmentationforMicroorganismsinMicroscopyImages
691

Where,
¯
F(x, y) is the pixel feature-vector at (x,y),
¯
I(x, y) is the pixel value at (x,y),
¯g(x, y) is the pixel gradient magnitude at (x,y),
Both the pixel value and gradient magnitude functions
are denoted as being vectors as pixel values are as-
sumed to be defined in the HSV color space. The
expectation and variance operators both refer to ele-
ment wise operations. The feature is evaluated on a
square area centered on the pixel in question. Eval-
uating both variance and mean can get quite com-
putationally expensive for larger areas. To remedy
this problem a moving average technique is utilized
to drastically improve real-time performance. For ex-
ample the mean may be efficiently evaluated using the
following equation,
¯µ(x + 1, y) =¯µ(x, y)
+
1
(2w + 1)
2
"
w
∑
j=−w
¯
I(x + w + 1, y + j)
−
w
∑
j=−w
¯
I(x − w, y + j)
#
(2)
Where,
¯µ
I
(x, y) is the mean value of pixel (x,y),
¯
I(x, y) is the value of pixel (x,y),
w is the width of the square evalutation area
3.2 Classification
Multilayer perceptrons with sigmoid activation func-
tions was utilized for pixel classification in this
method, which contained a single input, output and
hidden layer. Each neuron within the network is de-
fined as,
a
j
= f
c
j
∑
i
w
i, j
a
i
!
(3)
Where,
a
j
is the output of the jth neuron,
f is an activation function,
c
j
is the neuron gain,
a
i
is the ith input to the neuron,
w
i, j
is the weight of the edge from ith to jth neuron.
As this network is used for classification, the activa-
tion function for each neuron within the hidden and
output layer is a sigmoid function which is defined
below,
f (z) =
1
1 + e
−z
(4)
In this particular work the multilayer perceptrons is
used to estimate the likelihood of a given feature be-
longing to either the background or object class. This
means that the network has two output nodes for each
class, each of which outputs the likelihood for one
of the given classes. In the training phase, the out-
put corresponding to a given training sample feature
is either [0, 1] or [1, 0] depending on the class which
the feature belongs to. The final classification is then
performed using Bayesian decision,
class( ¯x) =
(
O if P(O)P( ¯x|O) > P(B)P( ¯x|B)
B else
(5)
Where,
¯x is an input feature,
O is the object class,
B is the background class,
A binary image is achieved by numerically represent-
ing the background and object class respectively as 0
and 1. The network is trained using a variation of the
standard backpropagation, whose main difference lies
on that it uses both first and second order derivatives
to estimate the optimal search direction during opti-
mization of neuron weight. At iteration n the optimal
search direction is,
¯p
n
= −H
−1
n
¯g
w,n
. (6)
Where,
¯p
n
is the optimal search direction,
H
n
is the Hessian matrix,
¯g
w,n
is the gradient.
Now this search direction estimate leads to fewer
iteration before convergence, but both the Hessian and
it’s inverse are relative expensive to estimate(Nawi
et al., 2006). To remedy this problem the Broyden-
Fletcher-Goldfarb-Shanno (BFGS) recursive iteration
scheme is used to accurately approximate the Hes-
sian using the following set of equations(Nawi et al.,
2006),
¯s
n
= ¯w
n+1
− ¯w
n
(7)
¯y
n
= ¯g
w,n+1
− ¯g
w,n
(8)
H
−1
n+1
= H
−1
n
+
1 +
¯y
T
n
H
−1
n
¯y
n
¯s
T
n
¯y
n
¯s
n
¯s
T
n
¯s
T
n
¯y
n
−
¯s
n
¯y
T
n
H
−1
n
¯s
T
n
¯y
n
(9)
Where,
¯w
n
is a vector containing the neuron weights.
VISAPP2014-InternationalConferenceonComputerVisionTheoryandApplications
692
As long as H
−1
n
is initialized as a positive definite ma-
trix, the above will converge towards the true Hes-
sian(Nawi et al., 2006). The training algorithm is de-
scribed in detail in (Nawi et al., 2006). It is important
that the training algorithm is supplied with an equal
amount of samples from each class. Having one class
vastly overrepresented leads to classification bias, an
effect which is studied in detail in (Brain, 2003). We
therefore subsample the overrepresented class.
4 EXPERIMENTAL RESULTS
The method has been tested on four image sets con-
taining different microorganisms and produced using
different microscopy types. Each image set contains
approximately 20 images and the results have been
achieved by running the segmentation method on all
of them and performing comparisons to expert pro-
duced ground truths. The main purpose is to illustrate
the viability of the method on a variety of different
detection problems. Segmentation quality is gauged
using the Dice coefficient rather than pixel-wise clas-
sification error, it is defined below (Ao et al., 2011),
D =
2 · |S
auto
T
S
manual
|
|S
auto
+ S
manual
|
(10)
Where,
D is the Dice coeffecient,
S
auto
is the set of segmentation object pixels,
S
manual
is the set of ground truth object pixels.
Now the dice coefficient for each image set was
estimated by utilizing a k-fold procedure with 4 folds.
A example image along with an example segmenta-
tion for each image set can be seen in figure 3, 4,
5 and 6. The image sets were obtained from online
microscopy image databases provided by (Institute,
2013) and (for Bio-Image Informatics, 2013). The re-
sults of each test can be observed in table 1. In all test
high Dice coefficients were achieved, this indicates
that the method is very versatile and can handle a
wide range of segmentation problems. The results ob-
tained from the DIC Wound image set can be directly
compared to those achieved by (Zaritsky et al., 2011),
Table 1: Table of experimental test results.
Image Set Dice Subsample
Fluorescence 0.831
Bright Field 0.851
Laser Scanning 0.952
DIC Wound 0.963
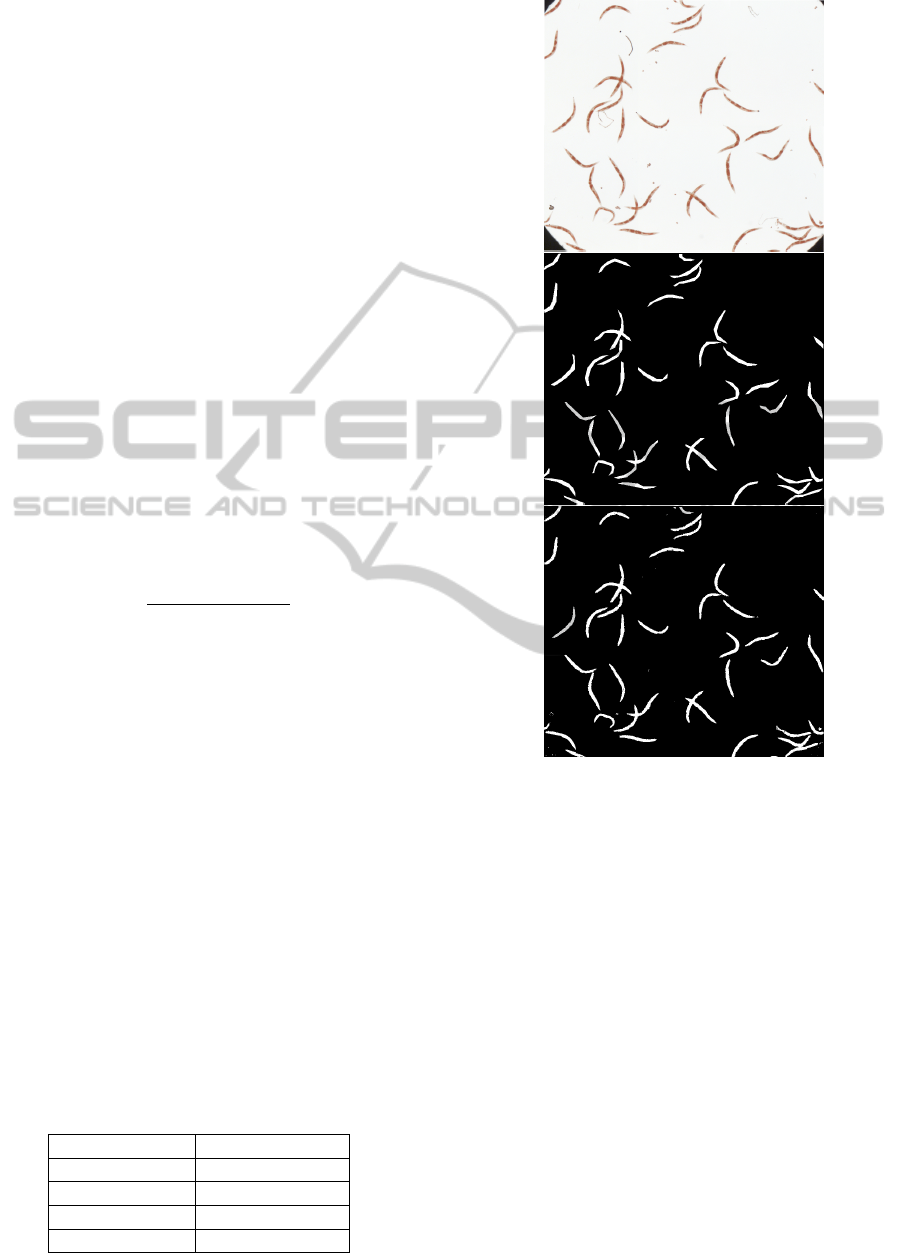
Figure 3: Example segmentation of an image from the
Bright Field set. Input image at the top, ground truth in
the middle and segmentation at the bottom.
who designed a segmentation algorithm for this par-
ticular problem. In their work they achieved an aver-
age pixel-wise segmentation accuracy of 0.922, which
is very much comparable to the Dice coefficient of
0.963 obtained by our method. In (Ao et al., 2011)
a method is presented for segmenting cancer cells in
microscopy images. They achieved an average Dice
coefficient of 0.9 which was deemed to be an accept-
able degree of accuracy. While the data set used in
(Ao et al., 2011) was not available for testing our
method thus preventing a direct comparison, it does
indicate the needed level of precision. As the results
obtained with our method are very close to the re-
sults obtained in (Ao et al., 2011), this demonstrates
that our method is capable of producing segmentation
quality on par with others, without being specifically
designed for a particular problem.
GeneralPurposeSegmentationforMicroorganismsinMicroscopyImages
693
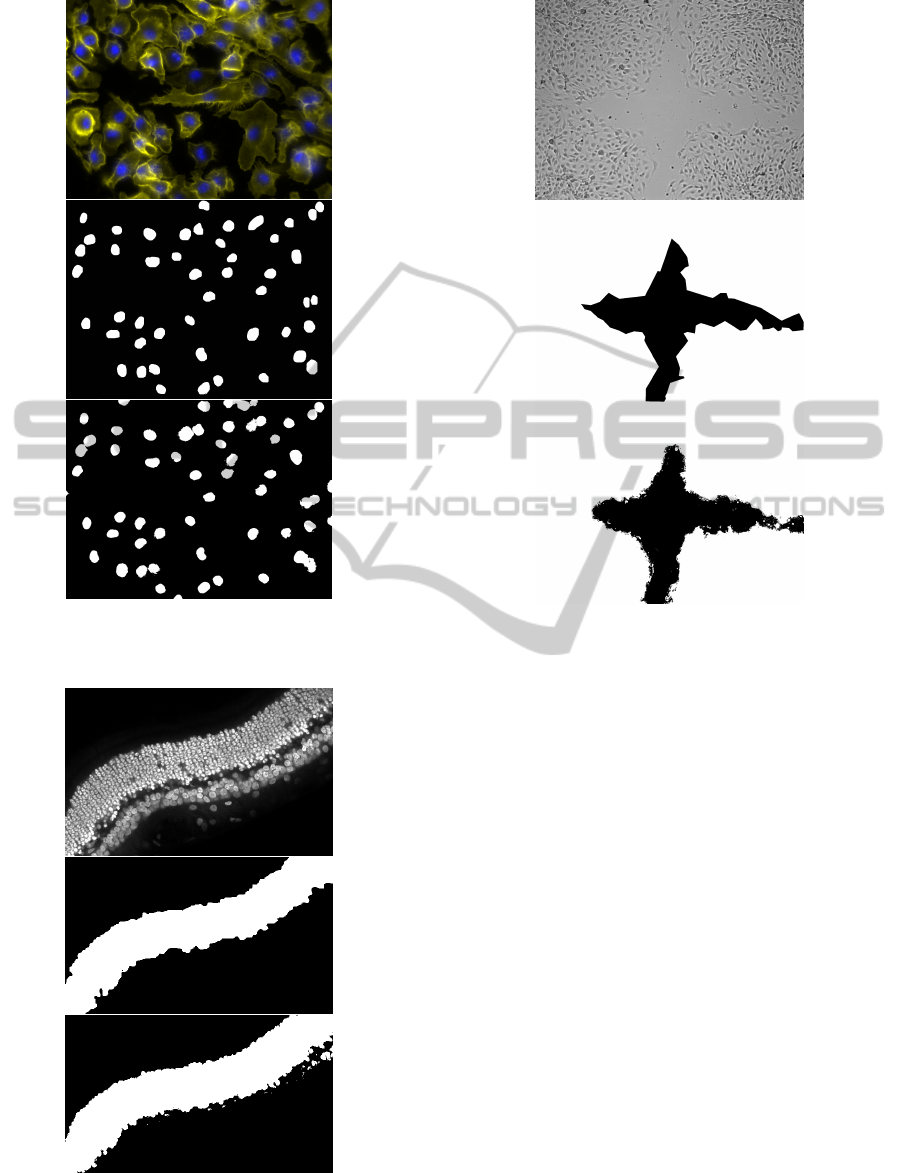
Figure 4: Example segmentation of an image from the Flu-
orescence set. Input image at the top, ground truth in the
middle and segmentation at the bottom.
Figure 5: Example segmentation of an image from the Laser
Scanning set. Input image at the top, ground truth in the
middle and segmentation at the bottom.
Figure 6: Example segmentation of an image from the DIC
Wound set. Input image at the top, ground truth in the mid-
dle and segmentation at the bottom.
5 CONCLUSION
In this paper it has been shown that a wide range of
segmentation problems in microscopy can be solved
through pixel-wise classification of local features.
These are based on the mean and variance of color
and gradient magnitude evaluated in an area centered
locally on each pixel. A classifier, in this case mul-
tilayer perceptrons, is automatically trained to each
specific segmentation problem, using user labeled
sample features. In order to document the viability of
the method, it was tested on five different image set
produced using bright field, fluorescence, differential
interference contrast and laser confocal scanning mi-
croscopy. In all cases good results were obtained with
a Dice coefficient ranging from 0.831 to 0.963. In fu-
ture work this method will be subjected to more sys-
tematic tests in order to closely investigate it’s proper-
ties. Additionally more data produced using different
kinds of microscopy and microorganisms will be uti-
lized in order to fully gauge the potential and limits of
the method.
VISAPP2014-InternationalConferenceonComputerVisionTheoryandApplications
694

REFERENCES
Ao, J., Mitra, S., Long, R., Nutter, B., and Antani, S. (2011).
A hybrid watershed method for cell image segmenta-
tion. IEEE Southwest Symposium on Image Analysis
and Interpretation.
Ariel J. Bernal, S. E. F. and Bernal, L. J. (2008). Cell recog-
nition using wavelet templates. Canadian Conference
on Electrical and Computer Engineering.
bin Abdul Jamil, M. M., Sharif, J. M., Miswan, M. F.,
Ngadi, M. A., and Salam, M. S. H. (2012). Red blood
cell segmentation using masking and watershed algo-
rithm: A preliminary study. International Conference
on Biomedical Engineering.
Brain, D. (2003). Learning From Large Data: Bias, Vari-
ance, Sampling and Learning Curves. PhD thesis,
Deakin University.
Carpenter, A., Jones, T., Lamprecht, M., and et al (2006).
CellProfiler: image analysis software for identifying
and quantifying cell phenotypes. Genome Biology.
Cheng, J. and Rajapakse, J. C. (2009). Segmentation
of clustered nuclei with shape markers and marking
function. IEEE Transactions on Biomedical Engineer-
ing.
F. Boray Tek, A. G. D. and Kale, I. (2009a). Computer
Vision for Microscopy Diagnosis of Malaria. Malaria
Journal.
F. Boray Tek, A. G. D. and Kale, I. (2009b). Malaria Par-
asite Detection in Peripheral Blood Images. IEEE In-
ternational Conference on Acoustics, Speech and Sig-
nal Processing.
for Bio-Image Informatics, C. (2013). Ucsb bio-
segmentation benchmarking.
Institute, B. (2013). Broad bioimage benchmark collection.
Kane, C., Iwasa, J., Orloff, D., and Wong, W. (2013). The
cell: An image library.
Kevin Smith, A. C. and Lepetit, V. (2009). Fast ray features
for learning irregular shapes. Internation Conference
on Computer Vision.
Kujiper, A. and Heise, B. (2008). An automated cell seg-
mentation method for differential interference con-
trast microscopy. International Conference on Pattern
Recognition.
Lebrun, G., Charrier, C., Lezoray, O., Meurie, C., and Car-
dot, H. (2007). A Fast And Efficient Segmentation
Scheme For Cell Microscopic Image. Cellular and
Molecular Biology.
Meijering, E. (2012). Cell segmentation: 50 years down the
road. IEEE Signal Processing Magazine.
Nawi, N. M., Ransing, M. R., and Ransing, R. S. (2006). An
improved learning algorithm based on the broyden-
fletcher-goldfarb-shanno (bfgs) method for back prop-
agation neural networks. International Conference on
Intelligent Systems Design and Applications.
Wienert, S., Heim, D., Saeger, K., Stenzinger, A., Beil, M.,
Hufnagl, P., Dietel, M., Denkert, C., and Klauschen,
F. (2012). Detection and segmentation of cell nuclei
in virtual microscopy images; a minimum-model ap-
proach. Scientific Reports.
Zaritsky, A., Natan, S., Horev, J., Hecht, I., Wolf, L., Ben-
Jacob, E., and Tsarfaty, I. (2011). Cell motility dy-
namics: A novel segmentation algorithm to quantify
multi-cellular bright field microscopy images. PLoS
ONE.
Zhaozhen Ying, Ryoma Bise, M. C. and Kanade, T. (2010).
Cell segmentation in microscopy imagery using a bag
of local bayesian classifiers. The IEEE International
Symposium on Biomedical Imaging.
Zhou, Y. (2007). Cell segmentation using level set method.
Technical report, Institute for Computational and Ap-
plied Mathematics, Johannes Kepler University, Linz.
GeneralPurposeSegmentationforMicroorganismsinMicroscopyImages
695
