
Particle Video for Crowd Flow Tracking
Entry-Exit Area and Dynamic Occlusion Detection
Antoine Fagette
1,3
, Patrick Jamet
1,3
, Daniel Racoceanu
2,3
and Jean-Yves Dufour
4
1
Thales Solutions Asia Pte Ltd, Research & Technology Centre, 28 Changi North Rise, Singapore 498755, Singapore
2
University Pierre and Marie Curie, Sorbonne Universities, Paris, France
3
CNRS IPAL UMI 2955 Joint Lab, Singapore, Singapore
4
Thales Services - Campus Polytechnique, ThereSIS - Vision Lab, Palaiseau, France
Keywords:
Particle Video, Crowd, Flow Tracking, Entry-Exit Areas Detection, Occlusions, Entry-Exit Areas Linkage.
Abstract:
In this paper we interest ourselves to the problem of flow tracking for dense crowds. For this purpose, we use a
cloud of particles spread on the image according to the estimated crowd density and driven by the optical flow.
This cloud of particles is considered as statistically representative of the crowd. Therefore, each particle has
physical properties that enable us to assess the validity of its behavior according to the one expected from a
pedestrian and to optimize its motion dictated by the optical flow. This leads us to three applications described
in this paper: the detection of the entry and exit areas of the crowd in the image, the detection of dynamic
occlusions and the possibility to link entry areas with exit ones according to the flow of the pedestrians. We
provide the results of our experimentation on synthetic data and show promising results.
1 INTRODUCTION
At the 2010 Love Parade in Duisburg, a mismanage-
ment of the flows of pedestrians led to the death of 21
participants. To put it in a nutshell, on a closed area,
the exit routes had been closed while the entry ones
remained open. With people still coming in and none
coming out, the place ended up overcrowded with a
density of population unbearable for human beings
who suffocated. This tragedy is one among others
where the crowd itself is its own direct cause of jeop-
ardy. Setting up video-surveillance systems for crowd
monitoring, capable of automatically raising alerts in
order to prevent disasters is therefore one of the new
main topics of research in computer vision.
Tracking the flow of pedestrians appears here as
an interesting feature for a system monitoring areas
welcoming large streaming crowds. With the capabil-
ity of understanding where the different flows enter
the scene, where they exit it and at what rate, comes
the capability of predicting how the density of pop-
ulation is going to evolve within the next minutes.
In terms of environment management, it means be-
ing able to close or open the right doors at the right
moment in order the avoid a situation similar to the
one of Duisburg.
This paper is presenting an original method to de-
tect the entry and exit areas in a video stream taken
by a video-surveillance camera. By linking these ar-
eas one with another according to the flows of pedes-
trians, it is also able to give an estimation of the
trajectory followed by these pedestrians and there-
fore indicate the most used paths. It is based on the
use of particles initialized according to an instanta-
neous measure of the density and driven by the optical
flow. These particles are embedding physical proper-
ties similar to those of a regular pedestrian in order
to perform optimization computations regarding the
trajectory and the detection of incoherent behaviors.
This article first presents in Section 2 the existing
state of the art in terms of crowd tracking. We are then
presenting an overview of the method in Section 3 as
well as our results in Section 4. Finally, in Section 5,
conclusions are given followed by a discussion on the
possibilities for future developments.
2 STATE OF THE ART
Tracking in crowded scenes is an important problem
in crowd analysis. The goal can be to track one spe-
cific individual in the crowd in order to know his
whereabouts. But, as noted previously, the objec-
445
Fagette A., Jamet P., Racoceanu D. and Dufour J..
Particle Video for Crowd Flow Tracking - Entry-Exit Area and Dynamic Occlusion Detection.
DOI: 10.5220/0004827604450452
In Proceedings of the 3rd International Conference on Pattern Recognition Applications and Methods (ICPRAM-2014), pages 445-452
ISBN: 978-989-758-018-5
Copyright
c
2014 SCITEPRESS (Science and Technology Publications, Lda.)

tive can also be to track the different flows in order
to monitor the global behavior of the crowd. There
are therefore two approaches to tackle this topic. By
segmenting each pedestrian of the crowd on the video
and by tracking them individually, the system can
keep track of some particular designated pedestrians.
However, this method becomes costly as soon as the
number of pedestrians rises and it may be impossible
to use it when the density is too high due to the prob-
lems of occlusions. On the other hand, by consid-
ering the crowd as a whole and by applying holistic
methods such as those used in climatology and fluid
mechanics, it is possible to keep track of the different
flows. The system builds a model that is statistically
representative of the crowd. The drawback of such
methods is that it does not allow the system to keep
track of specific individuals designated by the opera-
tor, it can only give a probability of presence within
the crowd.
Methods belonging to the first paradigm, the ob-
ject tracking approach, are numerous and a classifica-
tion is proposed in (Yilmaz et al., 2006). Yilmaz et
al. point out that the taxonomy of tracking methods
is organized in three branches: point tracking (such
as the use of SIFT as in (Zhou et al., 2009)), appear-
ance tracking (such as the Viola-Jones algorithm used
in (Viola and Jones, 2001)) and silhouette tracking
(such as the CONDENSATION method developed in
(Isard and Blake, 1998)). Based on this survey and
following this classification, Chau et al. present a
most recent and very complete overview of the exist-
ing tracking algorithms in (Chau et al., 2013). From
this overview, one can notice that these algorithms are
all requiring the detection in the image of points or
regions of interest (PoI/RoI) in order to perform the
tracking. They characterize these PoI/RoI using fea-
tures such as the HOG, Haar or LBP ones or detect
them using algorithms such as FAST or GCBAC. The
tracking part is then often optimized using tools such
as Kalman or particle filters. As the number of pedes-
trians in the crowd grows, the quality of the extracted
features is downgraded due mainly to the occlusions.
Regarding the holistic methods applied to the
crowds it appears in the literature that the computer
vision field is mostly inspired by fluid mechanics ap-
proaches used in climatology for example as in (Cor-
petti et al., 2006) or (Liu and Shen, 2008). In particu-
lar, the use of optical flow algorithm applied to crowd
analyses has been explored in (Andrade et al., 2006)
to detect abnormal events. However, such a method
provides an instantaneous detection of events but does
not allow long-term tracking of the flow and predict-
ing models that would detect emerging hazardous sit-
uations. Sand and Teller in (Sand and Teller, 2006)
introduce the Particle Video algorithm. The interest
of such an algorithm is that, instead of detecting at
each frame the points of interest to be tracked, the al-
gorithm sets its own points of interest to follow: the
particles driven by the optical flow. Ali and Shah
in (Ali and Shah, 2007) are using particles to track
the flows of pedestrians in dense crowds. Using the
Lagrangian Coherent Structure revealed by the Finite
Time Lyapunov Exponent field computed using the
Flow Map of the particles, the authors can detect the
instabilities and therefore the problems occurring in
the crowd. Mehran et al. in (Mehran et al., 2010)
are also setting a grid on the image. The nodes of
the grid are the sources for particle emission. At each
frame, each node emits a particle and the authors use
their trajectories to detect streaklines in the flows of
pedestrians. The consistency between streaklines and
pathlines is a good indicator of flow stability. Another
method of crowd analysis implying particles is using
the Social Force Model built by Helbing and Moln
´
ar
in (Helbing and Moln
´
ar, 1995). Mehran et al. are us-
ing particles, initialized on a grid as well, to compute
the social forces applied on a crowd in a video footage
(Mehran et al., 2009). As a result, they can link the
output of their algorithm with the model’s and detect
abnormal behaviors quite efficiently.
At the cross-roads between the discrete and the
holistic approaches, Rodriguez et al. in (Rodriguez
et al., 2012) are giving a review of the algorithms
for crowd tracking and analysis. Subsequently, they
propose to combine results from holistic methods
with outputs from discrete ones. For example, their
density-aware person detection and tracking algo-
rithm is combining a crowd density estimator (holis-
tic) with a head detector (discrete) to find and track
pedestrians in the middle of a crowd.
The method presented in this article belongs to the
holistic approach and is inspired by the work of Ro-
driguez et al. in the use of density. It is using the Par-
ticle Video algorithm in a new way that is described
in Section 3.
3 OVERVIEW OF THE METHOD
The method described hereafter is following the same
pattern proposed by Sand and Teller in (Sand and
Teller, 2006): the particles are set on the image, they
are propagated following the optical flow, their po-
sitions are optimized according to our own criteria
and they are removed when they are no longer rele-
vant. We call this process the BAK (Birth Advection
Kill) Process. As opposed to Sand and Teller, the par-
ticles, as much as the pedestrians in the crowd, are
ICPRAM2014-InternationalConferenceonPatternRecognitionApplicationsandMethods
446

considered as independent from each other and are
therefore not linked. This assumption allows an ef-
ficient parallel architecture implementation such as a
GPU-implementation for example in our case. That
way, we can deal with the great number of particles
involved while achieving real time computation.
Unlike most of the methods using the Particle
Video algorithm, we do not initialize our particles on
a grid, nor do we add any via sources distributed on
a grid. As we want the cloud of particles to be sta-
tistically representative of the crowd, the first initial-
ization and the subsequent additions of particles are
done according to the density of the crowd.
Moreover, in order to comply with the idea that
our particles are a representation of the pedestrians,
we match the behavior of each of them with the one
expected from a regular human being wandering in
the crowd.
3.1 Pre-processing
At each iteration, the algorithm updates the positions
of the particles using the result of an optical flow al-
gorithm. For this study, we are using Farneb
¨
ack’s
algorithm (Farneb
¨
ack, 2003) as it is implemented in
OpenCV.
Plus, as explained previously, the initialization
and additions of particles is performed with respect
to the estimated density of pedestrians. Therefore, we
need to feed our algorithm with such an estimation.
For this study, as we are using synthetic datasets, we
rely on the ground truth to provide the estimation of
density.
Finally, it is to be noted that several steps of the
algorithm require to compute image coordinates into
3D coordinates and vice versa. Therefore, the cam-
era parameters are mandatory as an input for these
orthorectification processes.
3.2 The BAK Process
The Birth-Advection-Kill (BAK) Process that is de-
scribed in the subsection is the process handling the
whole life cycle of a particle. As explained previ-
ously, all the particles are independent from each oth-
ers. This assertion means that once they are born,
all the particles can be handled in parallel, hence the
GPU-implementation.
The Birth part takes care of the addition of new
particles. It assesses whether there is a need for new
particles and the number of these to add.
The Advection part propagates the particles with
respect to the optical flow provided to the algorithm.
This part also evaluates the validity of the displace-
ment ordered by the optical flow with respect to
the displacement expected from a human being. If
needed, the proper corrections and optimization are
made also in this part of the algorithm.
The Kill part removes the particles that are no
longer relevant: those that are out of the scene or
those that have had an inconsistent behavior for too
long (i.e. beyong possible corrections).
This process is summarized on Figure 1. The Ad-
vection part, for which the particles are handled truly
independently one from each other, is the part bearing
most of the processing time. It is the one implemented
in GPU. The Birth part is implemented in CPU be-
cause it is not done independently from the state of
the other particles. As for the Kill part, the killing
decision is taken on the GPU-side of the implemen-
tation however, it is performed in CPU for technical
reasons.
3.2.1 Birth
The Birth part depends exclusively on the density of
pedestrians present in the scene and the density of par-
ticles set on the image. The goal is to have the density
of particles meet the density of pedestrians up to a
scale factor λ. Therefore, where the density of parti-
cles is too low, the algorithm adds new particles.
The scale factor λ represents the number of par-
ticles per pedestrians. This value is to be set by the
user, but concretely it will mostly depend on the po-
sition of the camera with respect to the crowd. If the
pedestrians appear too small, setting λ too high will
only induce the creation of many particles at the same
location and therefore lots of particles will be redun-
dant. On the other hand, if the pedestrians appear
quite large and λ is set too low, the particles may be
fixed on parts of the body whose motion is not rep-
resentative of the global motion of a pedestrian (arm,
leg, etc.).
A cloud of particles generated on a crowd with a
scale factor λ can be interpreted as λ representative
observations of that monitored crowd.
The operation to add particles is performed using
the density map provided by the ground truth in our
case or by any crowd density estimation algorithm.
This map is giving for each pixel a value of the den-
sity. It is subsequently divided into areas of m-by-
n pixels. For each area, its actual size is computed
by orthorectification. By multiplying by the average
density of the m × n densities given in this area by
the density map, one can find the estimated number
of pedestrians. Multiplied by the scale factor λ, this
gives the number of particles that are required. The
particles are then added randomly in the m-by-n area
ParticleVideoforCrowdFlowTracking-Entry-ExitAreaandDynamicOcclusionDetection
447
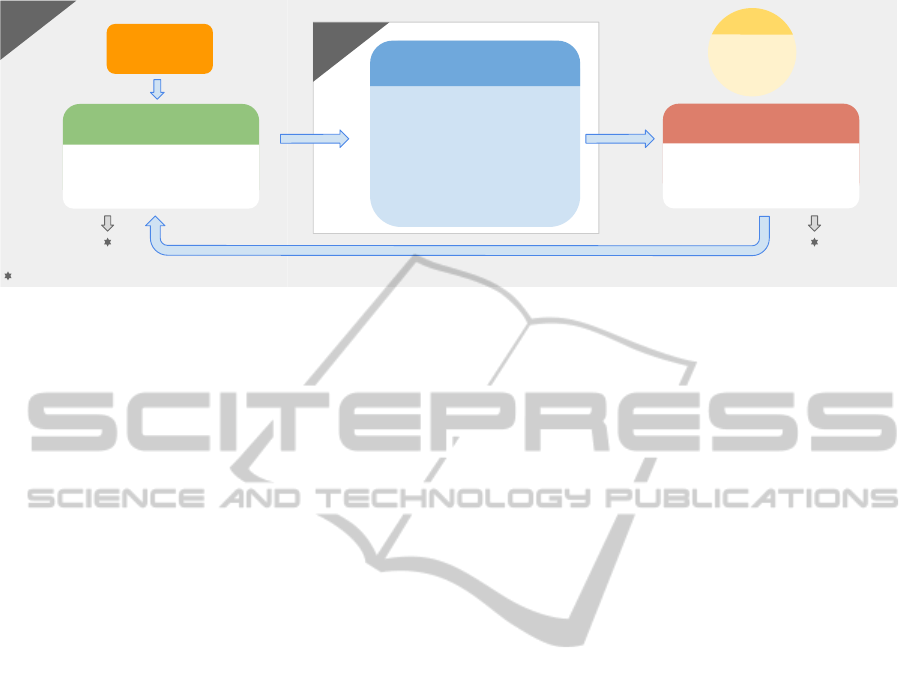
Initialization
Birth
Addition of new particles based
on the density estimation
New iteration
Kill
Remove particles :
- With Vitality equal to 0
- Which are outside the image
= Data which can be used for data analysis
CPU
GPU
1. Particles moving, according
to the optical flow
2. Detection of particles with
abnormal acceleration :
- Decrease of their Vitality
- Particles repositioning based
on their previous movements
Advection
Particle
- Vitality
- History
Figure 1: The BAK Process.
in order to meet the required number. Should the re-
quired number be lower than the actual number of par-
ticles, nothing is done.
3.2.2 Advection
The Advection part performs two tasks: the propa-
gation of the particles and the optimization of their
positions.
The propagation of the particles is using the op-
tical flow computed by a separate algorithm. As the
position of a particle p is given at a sub-pixel level,
its associated motion vector u
p
is computed by bi-
linear interpolation of the motion vectors given by
the optical flow on the four nearest pixels and using
the fourth-order Runge-Kutta method as presented in
(Tan and Chen, 2012). The notion of closeness is
here defined in the 3D environment where the crowd
is evolving and not on the image. Therefore, using
the orthorectification process, the algorithm computes
the positions in the 3D environment of the particle to
propagate as well as those of the four nearest pixels in
the image.
The new computed position may not be valid with
the expected behavior of a regular pedestrian (speed
or acceleration beyond human limits). These abnor-
mal behaviors for the particles may happen mostly for
two reasons: the noise in the optical flow and occa-
sional occlusions of the entity the particle is attached
to.
Therefore, from u
p
and the previous positions, the
validity of the position can be assessed and, if needed,
optimized. The optimization is performed only when
the displacement u
p
generates a speed or an accelera-
tion that is not expected for a pedestrian. When these
kinds of event occur, the particle is tagged as abnor-
mal and the algorithm tries to find its most probable
position according to its history. Each particle there-
fore holds a history of its N previous positions, N a
number that can be set in the algorithm. These N posi-
tions are subsequently used to extrapolate the position
that the particle is most likely to occupy.
As the position of a particle has to be optimized,
the reliability of the computed trajectory decreases.
Indeed, the particle is no longer driven by the optical
flow and its computed moves are only an estimation
with an associated probability. The more a trajectory
requires optimized positions, the less reliable this tra-
jectory is. This leads to another parameter attached
to each particle: its vitality. This vitality, which rep-
resents the reliability of the trajectory, decreases each
time the position of the particle needs to be optimized.
However, as soon as the particle manages to follow
the optical flow without triggering the optimization
process, its vitality is reset to its maximum. A par-
ticle whose vitality decreases down to zero or below
is considered as dead and will be removed in the Kill
part.
3.2.3 Kill
Once the particles have been advected, the Kill part
removes all the particles that are not bringing relevant
information. These particles are the ones outside of
the image, the ones with a vitality equal to or below
0 or the ones that are in an area where the density of
particles is too high.
Indeed some particles can move outside of the im-
age because the optical flow drives them out of the
field of view of the camera. These particles become
useless and are removed.
Some other particles have their vitality dropping
down to 0. As this means that they kept having an
incoherent behavior for too long, it is reasonable to
think that these particles lost track of the object they
were attached to. They are therefore removed. The
Birth part will solve the potential imbalance between
the density of particles and the density of pedestrians
ICPRAM2014-InternationalConferenceonPatternRecognitionApplicationsandMethods
448

induced by these removals. Finally, particles can ac-
cumulate at some location in the image. This happens
when the optical flow points at such a location with
a norm decreasing down to zero. We identified two
causes for these kinds of situation: static occlusions
and crowd stopping.
Static occlusions are elements in the image that
are not part of the crowd but belong to the environ-
ment and can hide the crowd (pillars, walls, trash bins,
etc.). A crowd moving behind a static occlusion gen-
erates an optical flow dropping to zero. Due to the
image resolution and the precision of the optical flow,
the change is usually not sudden. Therefore, the ve-
locity of the particles decreases gradually and no ab-
normal accelerations (dropping the speed from 1m ·s
1
to 0m · s
1
in 1/25 second would generate an accelera-
tion of 25m · s
−2
) are detected. Therefore they accu-
mulate in these areas where there is no pedestrians.
Nevertheless, this can also be due to the crowd
coming to a halt. In this case there would be no den-
sity issue so no particles would be removed. However
if there is a density mismatch with too much parti-
cles then the algorithm will remove as much particles
as needed to match the correlated amount of pedes-
trian. This latter case can happen for instance when
pedestrians gathered in a large crowd are queuing be-
fore stepping on an escalator. Depending on the angle
of the camera, the disappearance of the pedestrians
might not be visible. However, the density would be
quite stable, hence the number of required particles to
remain roughly the same through time and therefore
older particles being removed.
3.3 Entry-Exit Areas Detection
Over the course of the video, pedestrians keep enter-
ing and exiting the camera field of view. They ei-
ther come in and out of the boundaries of the image
or pop up from and get hidden by static occlusions.
These limits where the crowd appears and disappears
in the image are called respectively entry and exit ar-
eas. The Birth and Kill parts described in subsection
3.2 handle the appearances and disappearances of the
particles on the image according to the optical flow
and the crowd density estimation. Due to the noise
in the optical flow and to the precision of the crowd
density estimation, it is expected to have particles ap-
pearing and disappearing even in the middle of the
crowd, where it should not happen. However it is
a reasonable assumption to expect a higher number
of particles added and removed from respectively the
entry and exit areas. The subpixelic position of each
particle added and removed throughout the image is
known. Therefore, areas in which the number of birth
(respectively kill) is a local maximum is an entry (re-
spectively exit) area.
The accumulation of data through the iterations of
the algorithm enables us to define more precisely the
local maxima and therefore the entry and exit areas.
Nevertheless in order to be able to detect new entry
and exit areas that may appear, this accumulation of
data is performed only on a gliding temporal window
of ∆
t
frames.
To detect these maxima the image is first divided
in boxes of a × b pixels. Each box is assigned δ
+
and
δ
−
which are respectively the number of particles that
have been added and removed through all the previous
iterations in the gliding temporal window. The box
map is then divided in blocks of c ×d boxes.
To find the boxes of a block that may form an exit
area, the algorithm computes for each block µ and σ
which are respectively the mean value and the stan-
dard deviation of δ
−
in the block. Then, for each
block, ω and Ω are defined such as:
ω = µ + σ (1)
Ω = µ
ω
+ σ
ω
(2)
with µ
ω
and σ
ω
respectively the mean value and stan-
dard deviation of the values taken by ω during all the
previous iterations. Finally, in each block, the boxes
with δ
−
higher than both ω and Ω are considered as
potential candidates to form an exit area.
To find the boxes of a block that may form an en-
try area, the same process is used, replacing δ
−
by δ
+
.
For these potential entry boxes, another parameter is
also taken into account, the assumption being that en-
try areas are only producing new particles. Therefore,
if a potential entry box is crossed by k particles older
than f frames, it can no longer be considered as a po-
tential entry box.
The selected boxes are then gathered in groups
following a distance criteria: two boxes belong to the
same group if and only if they are at a distance of d
min
meters or less from each other. Groups with more than
n
min
boxes form the entry and exit areas. Each area is
materialized by a convex hull.
For our study, given the camera parameters of our
datasets, we choose a = b = 4 pixels, c = d = 50
boxes, k = 1 particle, f = 15 frames, d
min
= 2 meters,
n
min
= 5 boxes and ∆
t
= 150 frames.
3.4 Dynamic Occlusions Detection
Dynamic occlusions are entities moving in the image
and occluding the pedestrians (e.g. a car, a truck, etc.).
Particles following a portion of the crowd that is be-
ing dynamically occluded tend to have an abnormal
behavior. Indeed the optical flow of the object they
ParticleVideoforCrowdFlowTracking-Entry-ExitAreaandDynamicOcclusionDetection
449
track is replaced by the optical flow of the occluding
object usually resulting in high accelerations which
causes an abnormal behavior for the concerned parti-
cles. There is then a high probability that an area with
a high number of abnormal particles is highlighting a
dynamic occlusion.
The method used to detect the exit areas and de-
scribed in subsection 3.3 can be adapted to detect
these dynamic occlusions. Indeed we are looking for
local maxima of the number of abnormal particles in
the image. As opposed to entry and exit areas, dy-
namic occlusions are happening at a given time and
moving rapidly on the image. Therefore, we do not
wait for the data to accumulate along the gliding tem-
poral window and use rather the instantaneous num-
ber of abnormal particles.
3.5 Linkage of Entry and Exit Areas
The purpose of linking the entry and exit areas is to be
able, in a video footage, to know where the pedestri-
ans coming from one area of the image are most likely
to go. This can help designing clever pathways in an
environment where multiple flows are crossing each
others. The interest is also to keep track of the num-
ber of pedestrians simply transiting in the scene that is
monitored and the number of those staying. With such
figures, the system can anticipate any potential over-
crowding phenomenon and therefore prevent them.
The information to link the entry and exit areas
to each other is carried by the particles themselves.
While the entry and exit areas are detected, a num-
ber is given to each of them. When a particle enters
the scene at a specific entry area, it embeds this entry
area number. Once exiting, the particles informs the
system of its corresponding exit area number.
4 VALIDATION
The validation datasets used for this study are all syn-
thetic. The main reason to explain this choice is that
for our algorithm to work, we need the camera param-
eters. The second reason is that we need the ground
truth to assess the validity of our results. And the
third reason is that, to our knowledge, among the
huge amount of video sequences displaying crowds
and available all over the Internet, none are providing
neither the camera parameters nor the required ground
truth.
The solution of the synthetic dataset justifies it-
self in that nowadays, simulators manage to produce
crowds with a high level of realism in terms of be-
havior as well as in terms of rendering. We are using
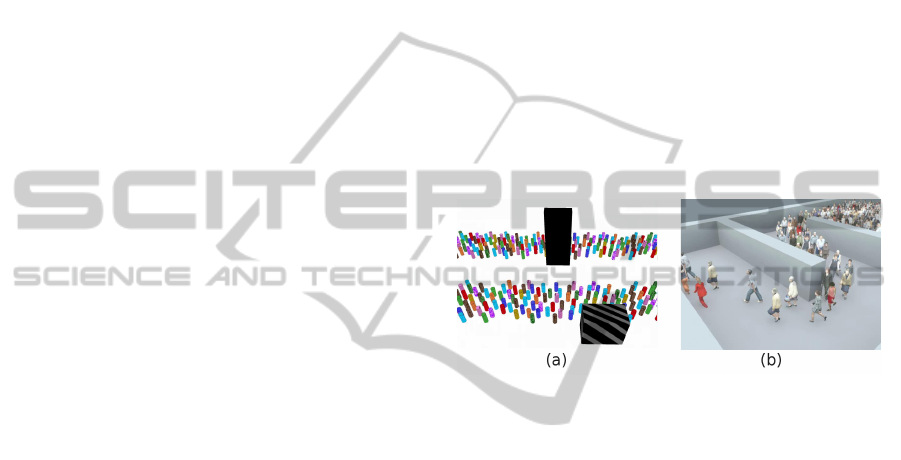
two datasets; a frame of each is displayed on Figure
2. The first one, basic, was produced by our team.
The flow of pedestrians is modeled by cylinders orga-
nized in two lanes moving in opposite directions. A
static occlusions is represented by a large black rect-
angle and one of the lane is going behind it. Two
dynamic occlusions are crossing the image beside the
second lane, just like vehicles on the road next to the
sidewalk. Although this first dataset is not photo-
realistic, it is to be noted that our algorithm does not
need photo-realism but rather behavior-realism. The
second dataset is taken from the Agoraset simulator
(Allain et al., 2012), available on the Internet. It is
more elaborated, with a better rendering as well as a
more realistic engine to rule each pedestrian’s behav-
ior. This second dataset comes with the ground truth
for the pedestrian’s positions as well as the camera
parameters.
Figure 2: Example of images from our datasets: (a) the ba-
sic one, (b) from Agoraset.
We provide in this Section the results of our al-
gorithm on the first dataset for the Entry-Exit area
detection, the dynamic occlusions detection and the
linkage of the entry and exit areas. Results are also
provided for the tests on the second dataset regarding
the entry-exit area detection.
4.1 Entry-Exit Areas Detection
The results provided in Figure 3 show the detected
entry and exit areas compared to the ground-truth that
we manually annotated. The main entry and exit areas
are accurately detected. On our basic dataset, two of
the exit areas are very thin but nevertheless present.
On Figure 3d, one can see that one entry area is
not detected. It is an area in which some pedestrians
are coming from behind a wall. The non-detection
of this entry area can be explained by the fact that
even though particles are being born there, and there-
fore boxes are labeled as potential entry boxes, these
boxes cannot link to each other to form entry areas be-
cause they are crossed by older particles dragged by
pedestrians who are never being hidden by the wall.
ICPRAM2014-InternationalConferenceonPatternRecognitionApplicationsandMethods
450
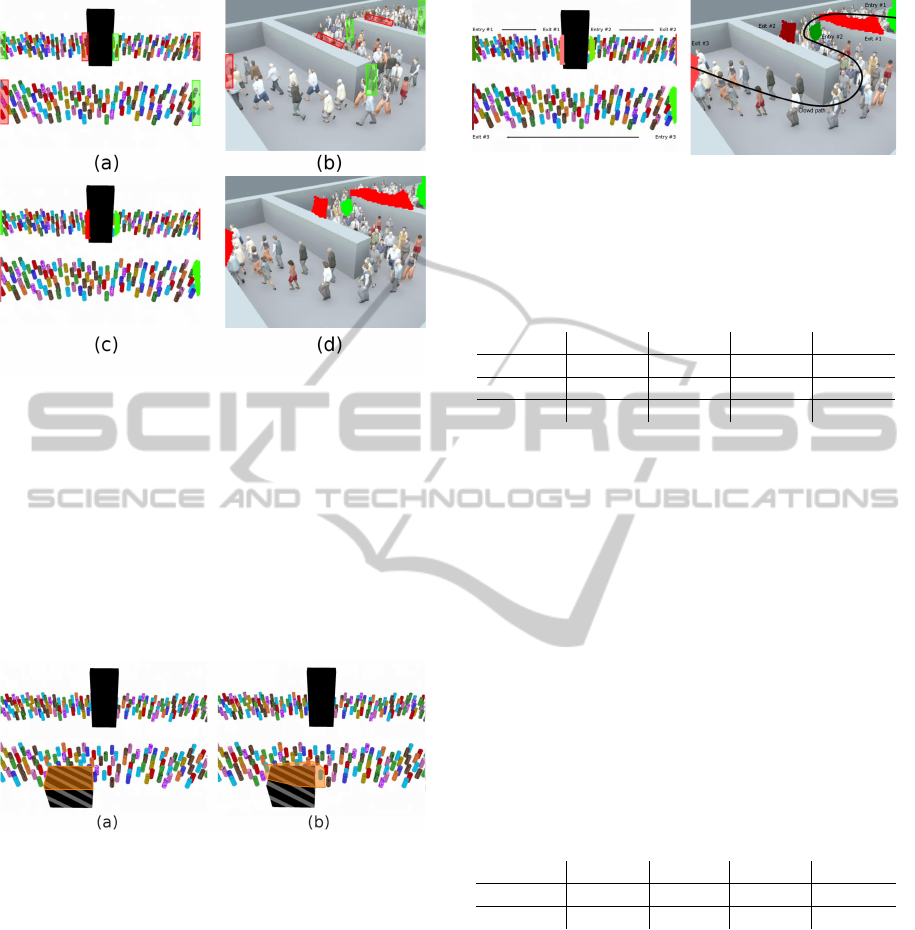
Figure 3: Detection of entry and exit areas. The first line
is the ground truth, the second line our results. The green
polygons are the entry areas, the red polygons are the exit
ones.
4.2 Dynamic Occlusions Detection
The Figure 4 shows the results of our algorithm for the
detection of a dynamic occlusion. One can see that
it is effectively isolating the ”truck” from the crowd.
Due to the precision of the optical flow, the polygon
embedding this dynamic occlusion is larger than the
occlusion itself.
Figure 4: Detection of a dynamic occlusion: on (a) the
ground truth is materialized with the orange polygon. On
(b) the result obtained.
4.3 Linkage of Entry and Exit Areas
The Figure 5 displays the entry and exit areas with
a unique label assigned to each of them. Each label
is materialized by a different color. We can therefore
know for each entry area, where the particles spawned
in this area are dying.
The Table 1 and 2 display the percentages of par-
ticles from Entry #i dying in Exit #j. The ”No Exit”
column exists because some particles can die out of
the exit areas. These figures are obtained by running
the algorithm several times and keeping the mean per-
centage.
From these results, it can clearly be inferred that
(a)
(b)
Figure 5: Linkage of the exit areas with the entry areas on
(a) our basic dataset and (b) the dataset coming from Ago-
raset. Each entry and exit areas is assigned a unique label,
materialized by a unique color.
Table 1: Linkage of the entry and exit area for our basic
dataset.
Exit #1 Exit #2 Exit #3 No Exit
Entry #1 95.29% 0.29% 0.00% 4.42%
Entry #2 0.00% 92.36% 0.00% 7.64%
Entry #3 0.00% 0.00% 82.32% 17.68%
Entry #1 is linked to Exit #1 and Entry #2 is linked
to Exit #2. To be noted that a very small amount of
particles spawned in Entry #1 managed to ”jump” the
static occlusion and end up in Exit #2.
For the particles spawned in Entry #3 the score
achieved for the rate of particle reaching Exit #3 is
less than expected. This is due to the dynamic oc-
clusion crossing the image from time to time and
killing a higher number of particles than where it is
not present (between Entry #1 and Exit#1 and En-
try #2 and Exit #2). However, the percentage is high
enough to be interpreted as a link between Entry #3
and Exit #3.
The Table 2 provides our results for the Agoraset
dataset.
Table 2: Linkage of the entry and exit area for our basic
dataset.
Exit #1 Exit #2 Exit #3 No Exit
Entry #1 94.05% 7.50% 0.03% 0.43%
Entry #2 0.00% 0.00% 98.81% 1.19%
These results clearly show the link between En-
try #1 and Exit #1 with a small amount of pedestrian
reaching Exit #2. Indeed, Exit #1 is the first wall be-
hind which pedestrians are being hidden before ap-
pearing again (Entry #2). The pedestrians managing
to reach Exit #2 are those on the outside of the curve
imposed by the first wall who are then being hidden
by the second wall (Exit #2). No surprisingly, it is
only a very small amount of pedestrians spawned in
Entry #1 who are reaching Exit #3 without being hid-
den by any walls.
ParticleVideoforCrowdFlowTracking-Entry-ExitAreaandDynamicOcclusionDetection
451

5 CONCLUSIONS
In this paper we have presented an adaptation of the
Particle Video algorithm for crowd flow tracking. The
goal was to detect where the crowd is entering the
scene that is monitored and where it exits this scene.
It is of a particular interest for any crowd monitoring
system to be able to track the different crowd flows in
order to be able to adapt the environment as efficiently
as possible to the different streams of pedestrians and
their strength. We showed that our algorithm can de-
tect the different entry and exit areas of the crowd in
the image and that it can also provide the route of the
crowd within the image with an indication of the rate
of pedestrians coming from one area and going to an-
other. Morevover, our GPU-implementation shows
that this kind of algorithm reaches real-time execu-
tion even though not fully optimized. This depends,
of course, on the number of particles that are set and
also on the hardware used. In our case, tests were
run on a machine equipped with an Intel Core i7 @
3.20GHz CPU and a nVidia GeForce GTX 580 GPU.
About 10
5
particles were deployed.
To conclude, we would like to point out some fur-
ther directions of research that could be done in order
to enhance such a system. First, on the algorithm it-
self, the condition of abnormality could be improved.
For the moment, they are just based on physical prop-
erties linked to the pedestrians’ accelerations.
Then, it is obvious that some additional functions
could be added on top of those existing. The first that
can be thought of is the clustering or the classifica-
tion of behaviors. Grouping the particles according to
their behavior and being able to put a label on top of
these groups could help the human operator to ana-
lyze the scene he is monitoring.
Finally, as explained in Subsection 3.2, a cloud of
particles generated on a crowd with a number of parti-
cles per pedestrian λ can be interpreted as λ represen-
tatives observations of that monitored crowd. There-
fore, these λ observations could be used to train crowd
simulators specifically designed to reproduce the be-
havior of crowds at some location of interest mon-
itored by video-surveillance. The learning of these
specific behaviors would help to generate crowd mod-
els adapted to specific environments and help, once
again, a human operator to design some environmen-
tal response to events of interest.
REFERENCES
Ali, S. and Shah, M. (2007). A lagrangian particle dynam-
ics approach for crowd flow segmentation and stability
analysis. In IEEE International Conference on Com-
puter Vision and Pattern Recognition.
Allain, P., Courty, N., and Corpetti, T. (2012). AGORASET:
a dataset for crowd video analysis. In 1st ICPR Inter-
national Workshop on Pattern Recognition and Crowd
Analysis, Tsukuba, Japan.
Andrade, E. L., Blunsden, S., and Fisher, R. B. (2006).
Modelling crowd scenes for event detection. In Pro-
ceedings of the 18th International Conference on Pat-
tern Recognition - Volume 01, ICPR ’06, pages 175–
178.
Chau, D. P., Bremond, F., and Thonnat, M. (2013). Ob-
ject tracking in videos: Approaches and issues. arXiv
preprint arXiv:1304.5212.
Corpetti, T., Heitz, D., Arroyo, G., Memin, E., and Santa-
Cruz, A. (2006). Fluid experimental flow estimation
based on an optical-flow scheme. Experiments in flu-
ids, 40(1):80–97.
Farneb
¨
ack, G. (2003). Two-frame motion estimation based
on polynomial expansion. In Image Analysis, pages
363–370. Springer.
Helbing, D. and Moln
´
ar, P. (1995). Social force model for
pedestrian dynamics. Physical Review E, 51:4282.
Isard, M. and Blake, A. (1998). Condensationconditional
density propagation for visual tracking. International
journal of computer vision, 29(1):5–28.
Liu, T. and Shen, L. (2008). Fluid flow and optical flow.
Journal of Fluid Mechanics, 614(253):1.
Mehran, R., Morre, B. E., and Shah, M. (2010). A streakline
representation of flow in crowded scenes. In Proc. of
the 11th European Conference on Computer Vision.
Mehran, R., Omaya, A., and Shah, M. (2009). Abnormal
crowd behavior detection using social force model. In
Proc. of the IEEE International Conference on Com-
puter Vision and Pattern Recognition 2009.
Rodriguez, M., Sivic, J., and Laptev, I. (2012). Analysis
of crowded scenes in video. Intelligent Video Surveil-
lance Systems, pages 251–272.
Sand, P. and Teller, S. (2006). Particle video: Long-range
motion estimation using point trajectories. Computer
Vision and Pattern Recognition, 2:2195–2202.
Tan, D. and Chen, Z. (2012). On a general formula of fourth
order runge-kutta method. Journal of Mathematical
Science & Mathematics Education, 7.2:1–10.
Viola, P. and Jones, M. (2001). Rapid object detection using
a boosted cascade of simple features. In Computer Vi-
sion and Pattern Recognition, 2001. CVPR 2001. Pro-
ceedings of the 2001 IEEE Computer Society Confer-
ence on, volume 1, pages I–511. IEEE.
Yilmaz, A., Javed, O., and Shah, M. (2006). Object track-
ing: A survey. Acm Computing Surveys (CSUR),
38(4):13.
Zhou, H., Yuan, Y., and Shi, C. (2009). Object tracking
using sift features and mean shift. Computer Vision
and Image Understanding, 113(3):345–352.
ICPRAM2014-InternationalConferenceonPatternRecognitionApplicationsandMethods
452
