
An Unsupervised Nonparametric and Cooperative Approach
for Classification of Multicomponent Image Contents
Akar Taher, Kacem Chehdi and Claude Cariou
University of Rennes 1, TSI2M, IETR/ENSSAT - 6, rue de Kerampont, 22300 Lannion, France
Keywords: Classification, Cooperative, Unsupervised, Nonparametric, Genetic Algorithm, Multicomponent, Image.
Abstract: In this paper an unsupervised nonparametric cooperative and adaptive approach for multicomponent image
partitioning is presented. In this approach the images are partitioned component by component and
intermediate classification results are evaluated and fused, to get the final partitioning result. Two
unsupervised classification methods are used in parallel cooperation to partition each component of the
image. The originality of the approach relies i) on its local adaptation to the type of regions in an image
(textured, non-textured), ii) on the automatic estimation of the number of classes and iii) on the introduction
of several levels of evaluation and validation of intermediate partitioning results before obtaining the final
classification result. For the management of similar or conflicting results issued from the two classification
methods, we gradually introduced various assessment steps that exploit the information of each component
and its adjacent components, and finally the information of all the components. In our approach, the
detected region types are treated separately from the feature extraction step, to the final classification
results. The efficiency of our approach is shown on two real applications using a hyperspectral image for the
identification of invasive and non invasive vegetation and a multispectral image for pine trees detection.
1 INTRODUCTION
The growth and the availability of multicomponent
images (e.g. hyperspectral images with hundreds of
spectral bands) which contain rich information have
opened new possibilities of applications in many
domains. In order to interpret the richness of this
information, a large diversity of image classification
approaches can be found in the literature. In
(Kermad and Chehdi, 2002), these approaches are
classified into two groups: non-cooperative and
cooperative approaches. Non-cooperative
approaches use a single classification method. These
methods can be supervised or unsupervised,
parametric or nonparametric. Supervised parametric
methods like Maximum Likelihood (ML) (Cox and
Snell, 1968), Support Vector Machines (SVM)
(Vapnik, 1998), Expectation Maximization (EM)
(Dempster et al., 1977), are the most commonly
used. These methods need a priori information to
accomplish the classification task. However the
required information is not available in all
application cases. The most frequently used
unsupervised nonparametric methods include: K-
Means (McQueen, 1967), LBG (Linde et al., 1980),
Fuzzy C-means (FCM) (Bezdek, 1981), and the
more recent Affinity Propagation (AP) (Frey and
Dueck, 2007). These methods do not require or
require little information a priori to accomplish the
classification task.
Another difficulty to the general problem of
segmentation or classification of multicomponent
images is the fact that applying several methods to a
single image never gives identical results. This
situation makes the quality assessment for the choice
of a particular method very difficult. Therefore,
cooperation between methods is highly desirable to
reliably partition images. The cooperation can be
done using three different schemes (Kermad and
Chehdi, 2002): sequential, parallel, or hybrid
cooperation. The drawback of the first scheme is the
sequential order of the applied methods which can
highly affect the results. Parallel cooperation
schemes use different classification methods at the
same time. A fusion stage introducing a validation
criterion is therefore required at the end of the
process. The main difficulty of this scheme is the
fusion process which requires a robust decision rule
to give optimal results. However, the application of
different classification methods in a parallel manner
263
Taher A., Chehdi K. and Cariou C..
An Unsupervised Nonparametric and Cooperative Approach for Classification of Multicomponent Image Contents.
DOI: 10.5220/0004828502630270
In Proceedings of the 3rd International Conference on Pattern Recognition Applications and Methods (ICPRAM-2014), pages 263-270
ISBN: 978-989-758-018-5
Copyright
c
2014 SCITEPRESS (Science and Technology Publications, Lda.)

allows reducing the computing time. The third
cooperation scheme is the hybrid cooperation which
combines the two previous schemes. This third
scheme has essentially the same drawbacks as the
first one.
In the literature, many cooperative approaches of
multicomponent image partitioning are available.
Part of them uses supervised parametric methods
(Tarabalka et al., 2009), (Kalluri et al., 2010),
(Benediktsson and Kanellopoulos, 1999) but some
others use unsupervised methods (Forestier et al,
2010).
(Tarabalka et al., 2009) propose a parallel
cooperative approach that uses three classification
methods: Support Vector Machines (SVM),
Maximum Likelihood (ML), and ISODATA. A
sequential approach, presented by (Benediktsson and
Kanellopoulos, 1999), involves the cooperation of
Neural Networks and ML methods. Another recent
parallel approach proposed by (Kalluri et al., 2010)
uses only ML classification method to partition an
image. The partitioning process is repeated several
times, changing the features extracted from the
image each time, and then the results are fused to get
the final result. The drawback of these cooperative
approaches resides in the use of supervised and/or
parametric methods, which require the availability of
some prior information that is not available in all
applications cases. The approach proposed by
(Forestier et al, 2010) makes cooperation between
different unsupervised methods in parallel but
requires some background knowledge about the data
while fusing the results of the different methods.
The main ideas of the approach presented in this
paper are based firstly, on the use of unsupervised
nonparametric classification methods and, secondly,
on the management of conflicting partitioning
results. The developed approach belongs to the
family of parallel cooperation scheme.
This paper is organized as follows: the second
section describes the proposed approach, the third
section presents applicative experiments on different
real images and finally, the last section gives the
conclusions and provides some perspectives.
2 APPROACH DESCRIPTION
The proposed partitioning approach is composed of
four steps (for the first three steps, see Figure
1):
The First Step is the adaptive feature extraction,
in which the image is divided into two types of
regions, i.e. textured and non-textured. The adaptive
characterization of pixels, taking into account the
textured or non-textured nature of the region to
which they belong, is an essential step before the
classification. Indeed, the features dedicated to the
description of regions with low variance do not have
sufficient discriminating power for textured regions,
and vice versa.
The Second Step is the unsupervised parallel
classification, in which the image is partitioned
using two different unsupervised nonparametric
classification methods (FCM and LBG) where the
number of classes is estimated automatically. In this
step, the pixels belonging to textured or non-textured
regions are classified separately and in parallel using
appropriate feature sets.
The Third Step includes the results management
of the same component (monocomponent image)
which is done at two levels, firstly by validating
pixels which are coherently classified by the two
methods (FCM and LBG), and secondly by
processing conflicting classification results using a
genetic algorithm (GA). The objective function of
the genetic algorithm depends on between-class and
within-class disparities to evaluate and manage the
conflicting pixels between the partitioning results.
The last block of fusion is the union between the
results of textured and not textured regions
In the case of multicomponent images the above
three steps are applied independently on each
component.
The Fourth Step is the identification of similar
pixels between the classification results of adjacent
components. In this step the results from the
different components are grouped into subsets,
which are formed depending on the number of pixels
that are classified to the same class in different
components. Then these subsets are processed
independently to get one classification result for
each of them. The same process as in the third step
is used to get the final result of the multicomponent
image.
In the following subsections the approach is
described in details.
2.1 Adaptive Feature Extraction
This step is composed of two processes. In the first
one, the image is globally analyzed, in order to be
divided into two types of regions: textured and non-
textured. In the second process, features are
extracted taking into account the type of detected
regions.
ICPRAM2014-InternationalConferenceonPatternRecognitionApplicationsandMethods
264
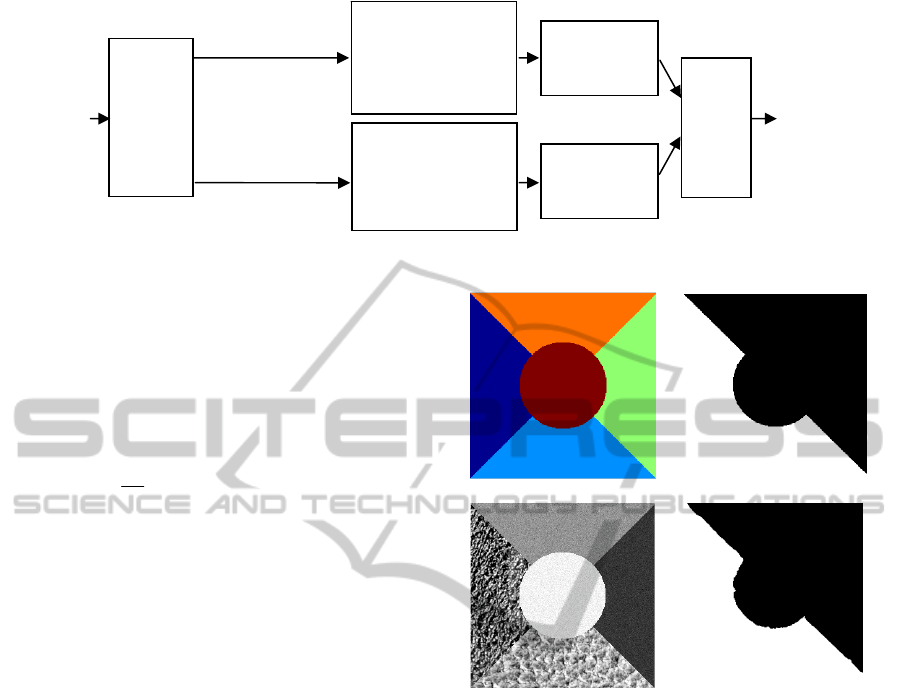
Figure 1: The general layout of the proposed approach (case of monocomponent image).
2.1.1 Region Nature Detection
The detection of regions’ types is done by local
extraction of the uniformity feature issued from the
co-occurrence matrix (Haralick, 1979). The
uniformity features are calculated using the
following equation (Rosenberger and Chehdi, 2003):
),(
1
11
, ii
M
j
L
i
d
ggP
M
Unif
j
(1)
Where L is the number of gray levels in the
monocomponent image, g
i
is an gray level, M is the
number of orientations θ
j
used to compute the co-
occurrence matrices, and P
d, θ
(.,.) are the entries of
the co-occurrence matrix obtained with inter-pixel
distance d.
The co-occurrence matrix is very time
consuming for an image in its original gray levels. In
order to reduce the gray levels number of an image
and while preserving the significant information at
the same time, we have used the multi-thresholding
method described in (Kermad et al., 1995).
In order to consider different texture scales, this
feature (uniformity) is extracted for each pixel using
five different sizes of an analysis window. These
extracted features are injected into an FCM classifier
and pixels are partitioned into two classes; by this
procedure, the textured and non-textured regions are
identified. This process enables the adaptativity of
feature extraction in the further processing steps.
To validate this procedure of region nature
detection we have applied it on a set of 30 images.
The database of images used includes images which
are composed of two types of regions: two textured
regions (textures are taken from the Brodatz album)
(Brodatz, 1966) and three non-textured regions.
Figure 2 shows a sample image and the
corresponding region nature detection map. The
Average Correct Detection Rate (ACDR) for all the
tested images is 98.60%.
(a)
(b)
(c)
(d)
Figure 2: Region nature detection results. (a) Image
ground truth mask (b) region type mask: white is textured,
black is non-textured, (c) Original sample image,
(d) Detected region types.
2.1.2 Feature Extraction
Two types of features are extracted to characterize
pixels in an image: the local average of pixel values
is a sufficient feature in the case where pixels belong
to a non-textured region; however in the case of a
textured region, several texture descriptive features
are needed. In (Rosenberger and Chehdi, 2003), 23
features are analyzed and 15 of them are selected
after removing the most redundant ones. These
features are:
Mean, variance, skewness, and kurtosis.
9 features issued from the co-occurrence
matrix (Haralick, 1979): contrast,
correlation, inverse difference moment, sum
average, sum entropy, entropy, first and
second information measure of correlation,
contour information.
Adaptive
feature
extraction
Textured regions
features
Non-textured regions
features
Class number
estimation
and unsupervised
classification using
(FCM, LBG)
Class number
estimation
and unsupervised
classification using
(
FCM
,
LBG
)
Evaluation and
conflict
management
Classification
result
Fusing
results
Evaluation and
conflict
management
Mono
component
image
AnUnsupervisedNonparametricandCooperativeApproachforClassificationofMulticomponentImageContents
265
2 features from the curvilinear integral.
All the features are calculated locally by sliding
an analysis window with maximum overlapping of
size WxW pixels (W odd). We have chosen a
window size of 3x3 pixels to compute the local
average for the non-textured regions, and extended it
to 9x9 pixels for features of the textured regions.
Identifying pixels belonging to one among two
types of regions brings two advantages, i.e. a natural
adaptation of feature extraction, and a computation
time gain in feature calculation.
2.2 Unsupervised Parallel
Classification
In this step the pixels in the textured and non-
textured regions are processed independently and in
parallel. The features extracted are injected into two
classification methods (FCM and LBG) chosen to
cooperate with each other due to their respective
fuzzy and hard decisions rules. These two methods
are used in many applicative domains, and have
shown their efficiency (Havens et al., 2012),
(Huang
and Xie, 2010). Their common advantage is that
they are both nonparametric, but both of them
require the prior knowledge of the number of classes
which is not known in most practical cases.
As our approach is considered to be completely
unsupervised, a step of class number estimation is
introduced. The pixels are classified in an iterative
manner using FCM. More precisely, the pixels are
classified using FCM several times by increasing the
number of class k, starting from k=2. The result
obtained at the end of each iteration is evaluated
using combined within-class and between-class
disparities as follows:
2
)()(1
))(),((
IDID
IDIDF
(2)
The within-class disparity
)(ID
quantifies the
homogeneity of each class obtained in the
partitioning result. Similarly, the global between-
class disparity
)(ID
measures the disparity between
the classes (Rosenberger and Chehdi, 2003). This
criterion provides some advantages: firstly it is
unsupervised; and secondly it adapts itself
automatically to the nature of the regions (textured,
non-textured). Finally it is composed of a
combination of two measures that both control
efficiently the issue of under and over classification.
The optimum value of the number of classes is
the one which maximizes criterion (2). Then the
estimated class number by FCM classifier is directly
used in the LBG method.
The motivation for applying FCM before LBG is
that, it is more robust in the estimation of the
number of classes. Actually, the LBG method gives
under-partitioning as shown in Figure 4.
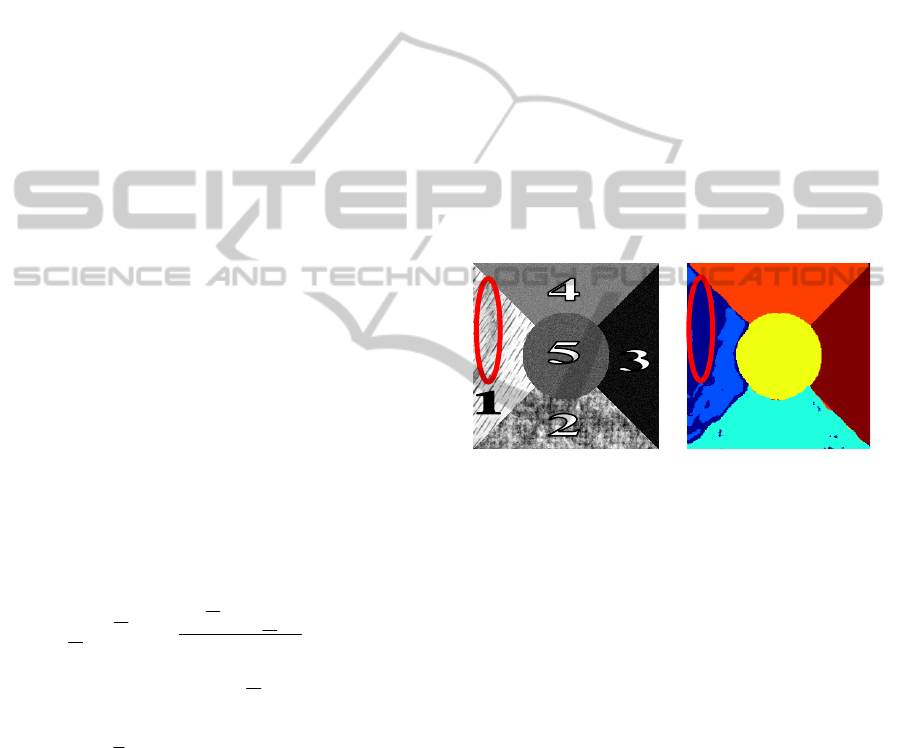
This process is tested on the set of images
described previously in section 2.1.1. The average
correct class number estimation over the tested
image set is 90%. This rate is coherent because in
some cases there are high fluctuations within a class
so that it is detected as more than one class. For
example, the class labelled as “1” in the image in
Figure 3-(a) is composed of wood, where a part of
this class is defected; it is clear from visual
inspection that the area inside the highlighting red
oval (wood defect) is not the same as the rest of the
class. This class is detected as two classes by our
method, which is actually true.
We can point out that if this kind of information
were accounted for in the ground truth of the image
set, the correct class estimation rate would be greater
than 90%.
Figure 3: Example of estimation the number of classes.
(a) Original image, (b) Classification result (6 classes).
2.3 Evaluation and Management of
Conflicts
In the partitioning process each classification
method generates a different partition from the same
data. Therefore, effective evaluation criteria are
important to provide the end users a degree of
confidence in clustering results. These assessments
should be objective and have no preference to any
algorithm (Xu and Wunsch, 2005).
2.3.1 Monocomponent Image Case
To validate the classification results obtained from
FCM and LBG, a two-level evaluation process is
applied. First, the pixels that are classified to the
same classes by both methods are considered
directly as valid pixels, and reported to the final
partitioning result. These pixels do not enter the
second level of evaluation, which dramatically
considerably reduces the complexity of processing.
ICPRAM2014-InternationalConferenceonPatternRecognitionApplicationsandMethods
266

The pixels that are classified to different classes by
the two methods are considered as invalidated, and
are subject to a second evaluation process using an
objective function optimized by a GA. The objective
function used is based on within-class and between-
class disparities (see Equation (2)).
In the GA (Holland, 1992), each pixel is
considered as a gene and each classification result is
considered as a chromosome. In our case, each
chromosome is composed of the invalidated pixels
only. Since there are two classification methods, the
initial population is composed of two chromosomes.
This population is evolved using genetic operations,
where only selection and cross-over operations are
considered. The genetic algorithm stops when no
better chromosomes are created, or the quality
difference between the best chromosomes of the two
last generations is smaller than ɛ, which guarantees
the termination of the GA. In our experiments the
value of ɛ is set to 10
-10
. The selection operation
used in this approach is the fitness proportionate
selection (Neumann et al. 2009). With this selection
operation type there is a chance for some weaker
solutions to survive the selection process; this is an
advantage, as though a solution may be weak, it may
include some information which could prove useful
following the recombination process. The type of
cross-over operation used in the approach is the
uniform cross-over (Syswerda, 1989), which uses a
fixed mixing ratio between two parent
chromosomes. The advantage of this cross-over
operation type is that it enables the parent
chromosomes to exchange at the gene level rather
than at the segment level. At termination of the GA,
the best evaluated chromosome in the population is
considered as the final result for the conflicting
pixels. Eventually, these pixels are grouped with the
valid pixels from the first level, to get the final
partitioning result for a single component).
To have the complete classification result of the
monocomponent image, the fusion in the last block
of Figure 1, is a union between the partitioning
results of textured and no textured regions.
To prove the validity of this process, we have
assessed it on the database of images previously
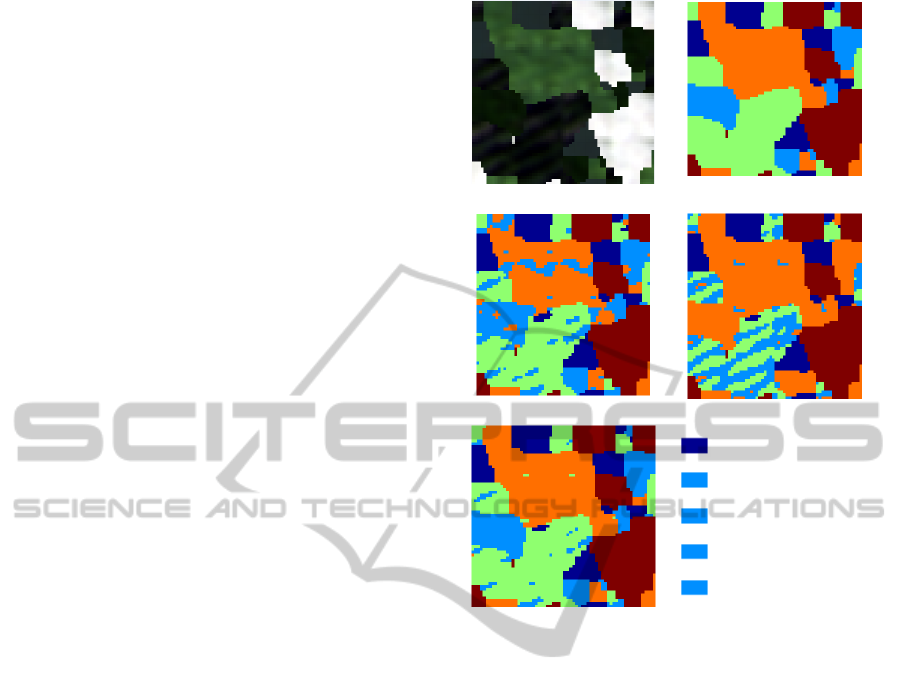
described in section 2.1.1. Figure 4 shows a sample
image and the obtained results including the detected
region natures, the individual results of LBG and
FCM, the result of our cooperative approach, and the
corresponding average correct classification rates
(ACCR). The number of classes in this experiment is
correctly estimated to 5 classes. In this example, the
result given by the LBG method only mixes up two
regions of the image, yielding a low correct
classification rate, while the result obtained by FCM
is clearly more robust. Another remark is that some
pixels from the LBG method result are classified in
the correct class, which is not true with the FCM
method. The application of the cooperative approach
has kept the pixels correctly classified and reassigns
those which were not previously correctly classified.
(a)
(b)
(c)
(d)
(e)
(f)
Figure 4: Results of mono-component image. (a) Original
image, (b) Region nature detection (white: textured, black:
non-textured), (c) LBG result (ACCR: 78.20%), (d) FCM
result (ACCR: 98.58%), (e) Validation map (white: valid,
black: invalid), (f) Our approach result (ACCR: 98.63%).
The global average correct classification rate, for the
set of 30 test images is: 94.71% for FCM method,
88.31% for LBG method and 97.19% for our
approach.
2.3.2 Multicomponent Image Case
In this case the results from the different
components are fused to get the final classification
result.
The steps described in sections (2.1, 2.2 and
2.3.1) are applied to each component in the image
independently to obtain N partition results, where N
is the number of components of the image. To get
the final partition result, the results of different
AnUnsupervisedNonparametricandCooperativeApproachforClassificationofMulticomponentImageContents
267
components are compared, and adjacent components
with similar classification results are grouped within
the same subset. The contents of each subset are
fused independently. At the beginning the first
component result is taken as reference and compared
with the adjacent components result. The reference
component is changed if the number of identical
pixels decreases. For example, if the first component
result is compared with the second component result
and some percentage of the pixels where found to be
classified identically, then the first component result
is compared with the third component result, if the
percentage of the identical classified pixels are
greater than this percentage, the reference
component remains unchanged and compared with a
further component result; if not, the first and second
component results are considered as one subset and
the third component result becomes the reference
component, and the same procedure is repeated until
the last component is processed.
The component results in each subset are fused
separately, and then the results of the subsets are
fused to get the final partitioning result of the
multicomponent image. GA is used in the fusion
process where the objective function is the same as
the one described previously.
To validate this approach of evaluation and
fusion, it is applied on a hyperspectral test image
which is constructed from regions of interest of a
real image. The ground truth of the image is
available (used for estimation of the results only).
The original hyperspectral image was collected by
an AISA Eagle sensor on October 1
st
2010 over the
region of Cieza in southeastern Spain. It was
acquired at 0.5 meter spatial resolution in 62 spectral
bands within the range [400, 970] nm. The data used
to construct the test image are taken randomly from
5 different regions of the original image. The 5 land
covers are: Water, Pinus halepensis, Peach trees,
Arundo donax, and Buildings. The estimated number
of class for this test is 5 classes. The result for this
test is shown in Figure 5.
3 ASSESSMENT ON REAL
APPLICATIONS
Our classification approach was also evaluated on
two real applications using respectively a
hyperspectral image for identification of invasive
and non invasive vegetation in the region of Cieza
(Spain) and a multispectral image for pine trees
detection in the region of Baabdat (Lebanon). For
(a)
(b)
(c)
(d)
(e)
Water
Pinus halepensis
Peach trees
Arundo donax
Buildings
Figure 5: Hyperspectral test image classification results.
(a) Original image (RGB components over 62 for
visualizing only), (b) ground truth masks, (c) FCM result
(ACCR: 91.68%), (d) LBG result (ACCR: 69.59%),
(e) Our approach result (ACCR: 97.95%).
these experiments, a ground truth data is available,
which allows us to assess the performances of our
approach.
The characteristics of the hyperspectral image
are described in section 2.3.2. The spatial size of this
image is1000 lines by 1000 columns.
The ground truth of the image includes six
different classes, namely: Phragmites australis,
Arundo donax, Tamarix, Ulmus minor, Pinus
halepensis, and Peach trees.
The multispectral image was acquired by the
Earth observation satellite Ikonos on July 11, 2005,
in the region of Baabdat (Lebanon) and it is used to
detect pine trees. The ground pixel size of this three
components (RGB) image is 0.8m.
To assess our unsupervised approach on these
two applications, the correct classification rates are
calculated using available ground truth areas.
For the detection of invasive and non invasive
vegetation, Figure 6 and Table 1 respectively show
the result of our classification approach and the
ICPRAM2014-InternationalConferenceonPatternRecognitionApplicationsandMethods
268
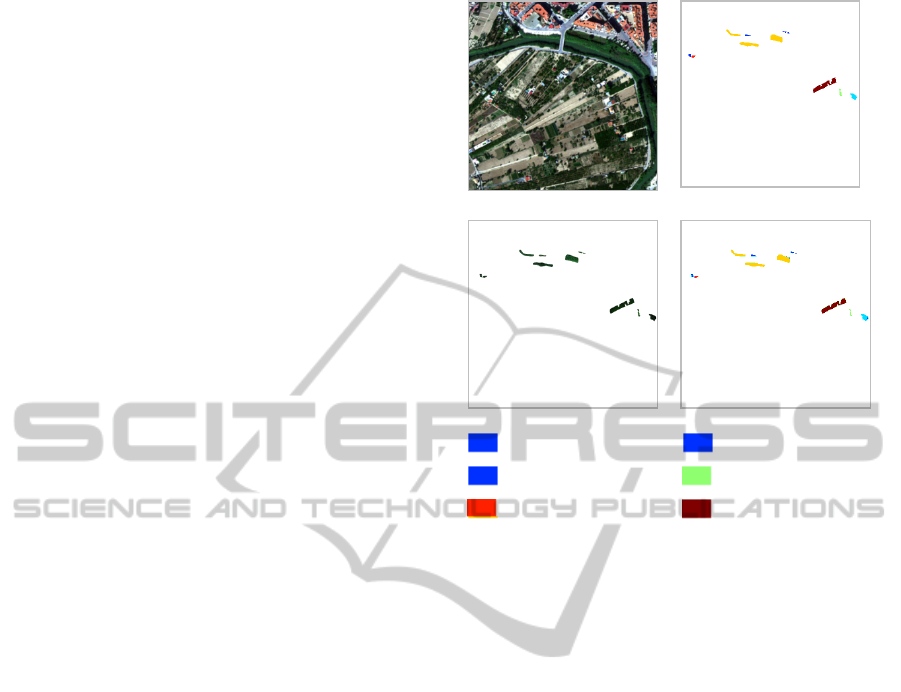
corresponding confusion matrix. The estimated
number of classes for this experiment is 6 classes.
The average correct classification rate for FCM,
LBG, and our approach are: 98.70%, 98.55%, and
99.13% respectively.
Concerning the detection of pine trees
application, the ground truth data contains 11736
pixels, with 11410 of them labeled as pine trees. In
this test, the estimated number of classes is 2. The
average correct classification rates (ACCR)
calculated only on the ground truth zones is: 96.91%
for FCM method, 97.09% for LBG method, and
lastly 97.22% for our cooperative approach.
A key point to mention is that, in all the
experiments, the ground truths provided with the
image data is only used for evaluating the results of
our approach, since the approach is unsupervised
and does not require any training; or any other
knowledge about the data.
4 CONCLUSIONS
This paper addresses the design of a cooperative and
adaptive classification approach for partitioning
mono or multicomponent images. The proposed
approach is non parametric and totally unsupervised.
The characterization of pixels according to the
nature of the region to which they belong, reduces
the computation burden of feature extraction, and
makes their processing independent in the
classification and result management steps.
The automatic estimation of class numbers
allows to better identify or classify the contents of
images. Indeed forcing a classifier to a subjective
fixed class number generally causes false or less
accurate classification results.
The systematic validation of the results from the
classification methods used, and the assessment of
only conflicting results before their validation leads
to consistent and reliable results. Several evaluations
on monocomponent and multicomponent (multi and
hyperspectral) images show the robustness of the
proposed approach results compared to those
obtained without cooperation.
The integration of the spectral information in the
feature extraction step remains as a perspective for
this work.
(a)
(b)
(c)
(d)
Phragmites australis Ulmus minor
Arundo donax Pinus halepensis
Tamarix Peach trees
Figure 6: Detection of invasive and non invasive
vegetation results from hyperspectral image. (a) Original
Image (3 components over 62 for visualizing only), (b)
Ground truth masks, (c) Pixels of ground truth to classify,
(d) Our approach classification result (ACCR: 99.13%)
ACKNOWLEDGEMENTS
This study was conducted in the framework of the
franco-lebanese cedre programme n° 2010/ef/l6.
Authors wish to thank the national Council for
Scientific Research, Centre for Remote Sensing
Lebanon, for providing the dataset on pine trees.
They also thank Infraestructura y Ecología S.A.-
Aretech Group for providing the dataset on invasive
and non invasive vegetation species.
REFERENCES
Benediktsson J. A., Kanellopoulos I., 1999. Classification
of multisource and hyperspectral data based on
decision fusion. IEEE Trans. on Geoscience and
Remote Sensing. 37(3), 1367-1377.
Bezdek J. C., 1981. Pattern recognition with fuzzy
objective function algorithms. Kluwer Academic
Publishers Norwell, MA, USA.
Brodatz P., 1966. Textures: A Photographic Album for
Artists and Designers, Dover Publications, New York.
AnUnsupervisedNonparametricandCooperativeApproachforClassificationofMulticomponentImageContents
269

Table 1: Confusion Matrix of classification result using the proposed approach for detection of invasive and non invasive
vegetation: correct classification rate in %, (.): number of pixels. Average correct classification rate: 99.13 %.
Ground truth classes (number of pixels)
Classes predicted
by our approach
Phragmites
australis
(544)
Arundo donax
(4200)
Tamarix
(162)
Ulmus minor
(764)
Pinus
halepensis
(274)
Peach trees
(3040)
Phragmites australis 99.08% (539) 0.16% (7) 2.47% (4) 0.52% (4) 0.73% (2) 0.33% (10)
Arundo donax 0 99.84% (4193) 0 0 0 0
Tamarix 0 0 97.53% (158) 0 0 0
Ulmus minor 0,55% (3) 0 0 99.48% (760) 0 0.07% (2)
Pinus halepensis 0.37% (2) 0 0 0 99.27% (272) 0
Peach trees 0 0 0 0 0 99.6% (3103)
Cox D. R. and Snell E. J., 1968. A general definition of
residuals. Journal of the Royal Statistical Society,
Series B. 30(2), 248-275.
Dempster A. P., N. M. Laird and D. B. Rubin, 1977.
Maximum likelihood from incomplete data via the EM
algorithm. Journal of the Royal Statistical Society,
Series B. 39(1), 1-38.
Forestier G., Gancarski P., and Wemmert C., 2010.
Collaborative clustering with background knowledge.
Data and Knowledge Engineering. 69(2), 211-228.
Frey B. J. and Dueck D., 2007. Clustering by passing
messages between data points. University of Toronto
Science 315, 972–976.
Haralick R., 1979. Statistical and structural approaches to
texture. Proceedings of the IEEE. 69, 786-804.
Havens T. C., Bezdek J. C., Leckie Ch., Lawrence O., and
Palaniswami M., 2012. Fuzzy C-means algorithms for
very large data. IEEE Trans. on Fuzzy Systems. 20(6),
1130-1146.
Holland J. H., 1992. Adaptation in natural and artificial
system. 2nd Edition. Cambridge, MA, USA: MIT
press.
Huang B., Xie L., 2010. An improved LBG algorithm for
image vector quantization. 3rd IEEE International
Conference on Computer Science and Information
Technology (ICCSIT).
Kalluri H. R., Prasad S., and Bruce L. M., 2010. Decision-
level fusion of spectral reflectance and derivative
information for robust hyperspectral land cover
classification. IEEE Trans. on Geoscience and Remote
Sensing. 48(11), 4047-4057.
Kermad Ch., Chehdi K., 2002. Research of an automatic
and unsupervised system of segmentation. Image and
Vision Computing Edition Elsevier. 541-555.
Kermad Ch, Chehdi K, Cariou C, 1995. Segmentation
d’images par multi-seuillage et fusion des régions
labellisée minimisant un critère de similarité. In
Quinzième Colloque GRETSI, 2, 641-644. Juan-Les-
Pins, France.
Linde, Y., Buzo, A., Gray R. M., 1980. An Algorithm for
vector quantizer design. IEEE Transactions on
Communications. 28, 84–94.
McQueen J., 1967. Some methods for classification and
analysis of multivariate observations. In Proceedings
of the Fifth Berkeley Symposium on Mathematical
Statistics and Probability. 1, 281-297.
Neumann F., Oliveto P. S., Witt C., 2009. Heoretical
analysis of fitness-proportional selection: landscapes
and efficiency. In Proc. of 11
th
(GECCO), 835-842.
Rosenberger Ch., and Chehdi K., 2003. Unsupervised
segmentation of multi-spectral images. In Proc.
International Conference on Advanced Concepts for
Intelligent Vision Systems, Ghent, Belgium.
Syswerda G., 1989. Uniform crossover in genetic
algorithms. In Proc. 3rd International Conference on
Genetic Algorithms, 2-9.
Tarabalka Y., Benediktsson J. A., and Chanussot J., 2009.
Spectral–spatial classification of hyperspectral
imagery based on partitional clustering techniques.
IEEE Trans. on Geoscience and Remote Sensing.
47(8), 2973-2987.
Vapnik V., 1998. A tutorial on support vector machines
for pattern recognition. Statistical Learning Theory,
New York: Wiley, 1998. C. Burges, Data Mining and
Knowledge Discovery. 2, 121-167.
Xu R., Wunsch II D., 2005. Survey of clustering
algorithms. IEEE Trans. on Neural Networks. 16(3),
645-678.
ICPRAM2014-InternationalConferenceonPatternRecognitionApplicationsandMethods
270
