
A Multi-objective Mixed-Integer Programming Model for a
Multi-Section Operating Theatre Facility Layout
Abdelahad Chraibi
1,2
, Said Kharraja
1
, Ibrahim H. Osman
3
and Omar Elbeqqali
2
1
University of Lyon, University of Saint-Etienne, Laboratory of Signal and Industrial Process Analysis (LASPI),
Roanne, France
2
University Sidi Mohamed Ben Abdellah, Faculty of Science Dhar El Mahraz,
Laboratory of Informatics Image Processing and Numerical Analysis (LIIAN), Fez, Morocco
3
Suliman S. Olayan’s School of Business, Business Information & Decision Systems, American University of Beirut,
Beirut, Lebanon
Keywords: Operating Theatre, Facility Layout Problem, Mixed Integer Programing, Multi-Section Layout, Multi-Goal
Formulation.
Abstract: The operating theater layout problem (OTLP) in a hospital aims to determine for a set of facilities their
positions and orientations on the floor-layout of departments in a hospital subject to a set of constraints on
distances, available areas, and non-overlapping facilities according to international medical standards and
specifications. The OTLP has two main objectives: a quantitative objective to minimize the
interdepartmental travel costs among facilities and a second qualitative objective to maximize the closeness
rating among facilities. In this paper, a mixed integer linear programming (MILP) model is proposed for
OTLP. The MILP model is validated on two illustrative cases to determine the positions as well as the
orientations of facilities in a two-dimensional space for a two-floor hospital using commercial optimization
software.
1 INTRODUCTION
The health care sector is one of the fastest growing
sectors in the world and in particular in France
where the current political, economic and social
conditions are the driving factors for hospitals to
streamline costs and improve quality of health care
services due to increased health care demands from
an aging population. As a consequence, hospitals are
conducting studies to establish better health
management tools to control the rapid increase in
health care cost as well as to improve the efficiency
of the health care system. In this regards, the
operating theater layout problem (OTLP) has a
significant impact on the cost efficiency
performance of any hospital and associated health
care services.
The OTLP consists of a set of n activities or
services to be placed on the floor-layout of
departments in a hospital. The positions and
orientations for each facility must be determined
subject to a set of constraints on distances, available
areas, and non-overlapping facilities according to
international medical standards and specifications,
(Tompkins et al., 2010).
The OT is one of the most critical and expensive
resources in hospitals (Guerriero and Guido 2011),
since 60–70% of all hospital admissions are due to
surgical interventions. They also account to more
than 40% of the total expenses of a hospital (Denton
et al. 2007). Such high expenses attracted the
attention of hospital management to look into
studying the efficiency of the operating theater.
The facility layout design of plants in
manufacturing systems aims to arrange in an
effective layout to minimize the material handling
costs. However, the design of OTLP in hospitals has
different objectives beyond classical manufacturing
requirements, it aims to find a layout design that
reduces operating expenses and the duration of the
health care process, enhances the quality of work
environment, increases the staff effectiveness,
improves patient and staff satisfaction and optimizes
the resources utilization.
In this paper, we will focus our research on the
OTLP in order to develop an optimal OT facility
layout respecting the standard guidelines and
specifications (Sehulster et al, 2003, AIA, FGI); to
196
Chraibi A., Kharraja S., H. Osman I. and Elbeqqali O..
A Multi-objective Mixed-Integer Programming Model for a Multi-Section Operating Theatre Facility Layout.
DOI: 10.5220/0004832401960204
In Proceedings of the 3rd International Conference on Operations Research and Enterprise Systems (ICORES-2014), pages 196-204
ISBN: 978-989-758-017-8
Copyright
c
2014 SCITEPRESS (Science and Technology Publications, Lda.)

minimize the movement cost; making distinction
between patients, doctors, medical and non-medical
staff travel cost; (the movement cost is considered to
be proportional to travel frequency and distance
between activities); to maximize the desired
closeness among activities; and to develop a
decision making support system based on the above
mentioned specifications, international standards and
optimization methods.
Section II presents a state of the art literature
review. Section III introduces the problem statement
and our mathematical model and in Section IV our
computational results are presented. Finally, section
V contains conclusions and future research
perspectives.
2 LITERATURE REVIEW
The FLP can be classified in two categories
according to the problem according to the
arrangement of facilities: equal-area or un-equal area
layout problems. The un-equal area FLP category
can also be subdivided primarily into two more
groups based on the plan layout representations: a
discrete plan layout - the plant site is divided into
equal-area rectangular units, and each group of units
on the grid is assigned to a facility; and a continuous
plan layout- facilities can be placed anywhere within
the plan layout without any overlap among them.
The FLP aims to find an efficient non-overlapping
arrangement of n facilities in a given plant.
Generally, the material handling costs is used to
measure the efficiency of the facility layout.
Minimizing the total cost of material transportation
and maximizing the total closeness rating between
each two departments are the common objectives
used in FLP (Meller et al., 1996).
Three of the most popular modeling approaches
for the FLPs are the quadratic assignment
(Koopmans et al., 1957), the mixed-integer
programming (Montreuil, 1990), and integer linear
formulation and heuristics for the graph theoretical
approaches (Osman et al., 2002); (Osman et al.,
2003); (Osman, 2006); (Hassan and Hogg, 1987).
The Quadratic Assignment Problem (QAP) is a
special formulation for FLP. It assumes a fixed
known set of locations, equal areas for each facility
and one-to-one matching between facilities and
locations. In recent times, efforts are made to solve
QAP using heuristic procedures. Different types of
solutions were proposed in the literature to solve
QAP: an evolutionary search heuristic, Ramkumar et
al., (2007); simulated annealing method combined
with ant colony, Jingwei et al., (2012) and other
approaches including construction methods, limited
enumeration methods, tabu search, genetic
algorithms as well as their hybrids. For more details,
we refer to Commander (2003).
Montreuil (1990) extended the QAP formulation
to a mixed-integer programming (MIP)
formulation to minimize the material handling cost
within a plant. Generally the QAP is used for
discrete representation, while the MIP is used for the
continuous one. In Hathhorn et al., (2013), authors
presented a multi-goal approach to minimize both
the material handling and facility building costs and
proposed a lexicographic ordering technique to
handle the multiple objectives.
While the objective of MIP and QAP is to
minimize the material handling cost within a plant,
the objective of the graph-theoretic approach is to
maximize the weighted sum of desirable measures
among adjacent facilities (departments). In graph-
theoretic approaches, it is assumed that the closeness
ratings (desirable measures) between departments
are known. Each department is then represented by a
node in a graph and department adjacency
relationships are represented by an arc connecting
the two adjacent departments. The objective function
is to maximize the weight sum of adjacencies
between department pairs (Osman, 2006).
FLP has wide applications ranging from: an OT
to a whole hospital, an assembly line to the baggage
department in an airport, an existing warehouse to an
office. In OT, the facility layout design involves the
determination of how to design the physical layout
of OT of activities to provide the best support for
production of health care services. There is literature
on FLP in hospitals but a few in the OTFL design.
Motaghi et al., (2011) used heuristic techniques
(Diamond Algorithm) in Shafa hospital to optimize
the hospital layout. The application of the layout
improvement has increased the efficiency of the
hospital by 45%. Assem et al., (2012) applied the
FLP to the OTFL. They improved the design of OT
by generating a block layout based on a graph
theoretic method called SPIRAL which is a
qualitative approach to maximize the
interdepartmental adjacency of the graph layout.
Padgaonkar (2004) developed a multi-floor
facility layout for hospitals to minimize the moving
cost of four entities: patients, doctors, medical, and
non-medical staff. These entities have various
difficulties and cost factors, for which various
alternative layouts were developed and the best
strategy was selected. Barrett (2008) used a
modified systematic layout planning approach to
AMulti-objectiveMixed-IntegerProgrammingModelforaMulti-SectionOperatingTheatreFacilityLayout
197

assess the clinic’s space usage, operation levels, and
flow and activity patterns and identified a number of
opportunities for improvement. Feyzollahi et al.,
(2009) have designed a model for the location of
hospital service units and assessment of their
efficiency on the basis of QAP mathematical model.
Lin et al., (2013) proposed an approach for
designing and optimizing OTFL in hospitals. First, a
systematic layout planning (SLP) is applied to
design OTFL and they applied fuzzy constraint
theory to comprehensively evaluate the layout
schemes.
Given the advantage and disadvantage of various
reviewed approaches, MILP is deemed best for the
OTFL formulation. The MILP approach has been
widely used in the industrial domain, but it has never
been applied to OTFL to the best of our knowledge.
Hence, it is the basis for our motivation to explore
its applicability for OTFL context.
3 PROBLEM STATEMENT
Building a new facility for hospital is an expensive
process which requires a significant amount of
resources to complete. Further, once construction of
the facility is completed, it is very difficult to
restructure to correct bad design layout without
incurring additional cost and loss of revenue during
re-work process, especially in re-design of
healthcare facilities. Therefore, the design phase of a
healthcare project is of prime importance. The
placement of departments (activities in our case
study) or other units such as corridors or aisles in a
facility has to be carefully determined. Many of the
problems faced in the delivery of healthcare services
are directly related to poor building designs of the
interactions among services. Therefore, managers
and designers must adopt an integrated and
comprehensive approach to support the decision-
making process in building design (Tzortzopoulos et
al., 2008).
Finding an optimal OTFL to minimize the
various costs requires the following specification of
requirements: the number of sections, the land area
required by the facility, the number of corridors
within the facility, the length, width and orientation
of each activity, the activity and corridors
allocations to each section and placement of the
activities and corridor within each floor.
Given a set of activities, their areas and the
available space, the OTFL seeks to determine the
optimal placement of the set of activities within the
available space subject to non-overlapping activities
on the floor plan layout while optimizing the value
of the objective function. To find the optimal
placement, a multi-goal Mixed Integer Programming
model is proposed to solve the multi-section in the
OTFL The main objectives are minimizing the
traveling costs for the considered entities (doctors,
patients, medical and non-medical staff) and
maximizing the closeness ranking among activities
to accommodate health services within the optimally
layout of such activities.
The idea of this formulation came from the
multi-floor layout problem, using elevators to move
between the two floors. In this study, floors are
represented by adjacent sections. In addition to the
assumption used for a single floor layout in Chraibi
et al., (2013), we assume that the following for the
two-floor layout:
The maximum number of corridors and their
orientation are given. In the solution, corridors
are used to travel between two activities in the
same section, and to transit from one to the other
section.
The location of a corridor is a decision variable.
The corridors are aligned using a vertical
structure, i.e. they have the same x coordinates
on any section they service to insure the entrance
to the OT unit, crossing between section and the
exit from the OT unit.
No relationships of activities with the outside
world are allowed.
An activity cannot be split among multiple
sections (floors).
Transition between sections can only occur
through corridors.
The shape and area of the activities are given.
For each activity, the associated decision
variables are its location and its horizontal or
vertical orientation.
a. Definitions of Sets:
Let N= { a
i
; i=1,2,…,n } be the set of n
activities in a department,
Let K= { e
k
; k=1, …,4} be the set of k entity
types: doctor, patient, medical staff or non-
medical staff.
Let S= {
; s=1, 2,…,t } be the set of sections:
outer, restricted, Aseptic, disposal….
Let C= {
; c=1, 2,…,r } be the set of corridors:
clean, public, .
Let
be a set of a single element denoting the
section to which activity a
i
is belonging.
Let
be a set of single element denoting the
section to which corridor
is belonging.
ICORES2014-InternationalConferenceonOperationsResearchandEnterpriseSystems
198

b. Definition of Parameters:
α
i :
Length of activity ‘a
i
’
β
i :
Width of activity ‘a
i
’
l
c
, d
c
:
Dimensions of corridor
F
ijk
:
Number of trips between activity ‘a
i
’ to
activity ‘a
j
’ made by an entity type ‘e
k
’
φ
ijk
:
Moving difficulty between activity ‘a
i
’ to
activity ‘a
j
’ made by an entity type ‘e
k
’
σ
k
: Cost factor assigned to entity ‘e
k
’
x
max:
Maximum length of the department ;
y
max
: Maximum width of the department ;
R
ij
:
Desirable relationship value between
activity ‘a
i
’ to activity ‘a
j
’;
ρ
1
, ρ
2
: Weights for each sub-objective function.
,
,
X and Y boundary coordinates of sections
c. Definition of Decision Variables:
Ω
i
{
1 if length (α
i
) of activity a
i
is parallel to x_axis
(horizontal orientation)
0 otherwise
µ
ij
{
1 if ‘a
i
’ and ‘a
j
’ are fully adjacent
0 otherwise
V
ijc
{
1 if traffic between activities ‘a
i
’ and ‘a
j
’ travels
through corridor
0 otherwise
t
ij
{
1 if activity ‘a
i
’ and ‘a
j
’ are assigned to the same
section
0 otherwise
t
ic
{
1 if activity ‘a
i
’ and corridor
are assigned to the
same section
0 otherwise
v
is
{
1 if activity ‘a
i
’ is assigned to section
0 otherwise
v
cs
{
1 if corridor
is assigned to section
0 otherwise
{
1 if activity ‘a
i
’ is strictly to the right of activity
‘a
j
’
0 otherwise
{
1 if activity ‘a
i
’ is strictly above activity ‘a
j
’
0 otherwise
,
{
1 if activity ‘a
i
’ is strictly to the right (r) ( or left
(l) of corridor
)
0 otherwise
,
{
1 if activity ‘a
i
’ is strictly above (a) or below (b)
corridor
0 otherwise
x
i
,
y
i
:
x and y coordinates of the geometric center of gravity
activity ‘a
i
’
x
c
,y
c
:
coordinates of the geometrical center of corridor
l
i
:
x-length of activity ‘a
i
’ depending on whether α
i
or β
i
is parallel on x-axis
d
i
:
y-length of activity ‘a
i
’ depending on whether α
i
or β
i
is parallel on y-axis
:
x-distance between activity ‘a
i
’ and ‘a
j
’
:
y-distance between activity ‘a
i
’ and ‘a
j
’
d. Definition of Constraints:
Orientation constraints (activities and
corridors)
The values of the variables l
i
and d
i
depend on the
activity ‘a
i
’ orientation in the plane. When the
activities are placed, if the longer side is parallel to
the x-axis, then the activity orientation is horizontal,
otherwise it is vertical:
Ω
1Ω
∀
(1)
∀
(2)
Sections constraints
Constraints (3) ensure that each activity is assigned
to only one section. Constraints (4), (5), and (6) are
used to obtain the value of t
ij
. If two activities ‘a
i
’
and ‘a
j
’ are allocated to the same section (v
is
= v
js
),
then constraint (4) will have t
ij
=1, while constraints
(5) and (6) remain inactive. Else, if activities ‘a
i
’ and
‘a
j
’ are allocated to different sections, then
constraint (4) is inactive and constraints (5) and (6)
will ensure that t
ij
=0.
1 ∀
(3)
1
∀1,…,1;
1,…,;
∀
(4)
1
∀1,…,1;
1,…,;
∀
(5)
1
∀1,…,1;
1,…,;
∀
(6)
Corridors Constraints
Constraint (7) ensures that the routing of the flow
between two activities is through the corridors in the
case when they are not assigned to the same section.
1
∀1,…,1;
1,…,
(7)
The corridors must have common boundaries to
route flows between the two sections, and common
boundaries with the entrance or the exit of the
section to facilitate the communication with the
outside. So constraints (8) and (9) assure the
adjacency between corridors. Constraint (10) forces
the corridors to be vertically aligned to insure the
traveling between sections. Constraint (11) makes
sure that each corridor is assigned to only one
section.
AMulti-objectiveMixed-IntegerProgrammingModelforaMulti-SectionOperatingTheatreFacilityLayout
199

2
∀1,2 ∈
(8)
2
∀1,2 ∈
(9)
∀1,2 ∈
(10)
1 ∀
(11)
Activities Non-overlapping Constraints
When two activities ‘a
i
’ and ‘a
j
’ occupy the same
section, they should be separated in the x-direction
or the y-direction. These restrictions can be imposed
using Equations (12) and (13):
1
2
∀,
(12)
1
2
∀,
(13)
to guarantee the non-overlapping at least one of the
following inequalities must be active:
1
∀ 1,…,1;
1,…,
(14)
1
∀ 1,…,1;
1,…,
(15)
1
∀ 1,…,1;
1,…,
(16)
Bounding Constraints
Constraints (17) through (21) indicate that activities
have to be allocated within the appropriate section
space defined by the corners (0, 0) and (
,
),
while (22) through (24) insure the same bounding
for corridors.
2
∀,
(17)
2
∀,
(18)
2
∀,
(19)
2
∀,
(20)
2
∀,
(21)
2
∀,
(22)
2
∀,
(23)
2
∀,
(24)
Corridors & Activities Non-overlapping
Constraints
Constraints (25) to (29) provide the non-overlapping
between an activity ‘a
i
’ and a corridor
if they
occupy the same section, or to be in different
sections.
2
2
1
∀,
(25)
2
1
2
∀,
(26)
2
2
1
∀,
(27)
2
1
2
∀,
(28)
1
∀,
(29)
Distance Constraints
Distance between any two activities will be
calculated using constraints (30) to (35):
∀,
(30)
∀,
(31)
∀,
(32)
∀,
(33)
∀1,…,1;
1,…,
(34)
∀1,…,1;
1,…,
(35)
ICORES2014-InternationalConferenceonOperationsResearchandEnterpriseSystems
200

e. Objective Functions
The goal of the FLP is to provide the best placement
of the activities within the available space. This goal
is achieved using a composite of two objective
functions. The first one is denoted the quantitative
objective and the second one is denoted the
qualitative objective. Meller (1996) gives a literature
overview on the different types of objective
functions: quantitative, qualitative and weighted
combined objectives.
The quantitative objective of the FLP is to
minimize the material handling cost. It is
proportional to the rectilinear distance, travel
frequency, trip difficulty rating, and baseline travel
cost:
∗
(36)
While:
is the travel frequency attribute. It represents
the number of trips made from activity ‘a
i
’ to
activity ‘a
j
’ by an entity type ‘e
k
’.
is the trip difficulty rating. It represents the
difficulty of an entity ‘e
k
’ to move from activity ‘a
i
’
to activity ‘a
j
’. It is proportional to the required
resources and provided effort.
, is the baseline travel cost. It represents the cost
factor assigned to entity ‘e
k
’ which depends on the
human resources involved. Its assumed that
(The value of this parameter is detailed in
Chraibi et al., 2013).
The qualitative objective is to maximize the
subjective closeness rating by considering vital
factors such as international standards. Qualitative
factors are easily analyzed in a closeness rating
chart, which is essentially a grid that qualitatively
evaluates the desired
closeness between activities.
The used rates are relative to the strength of the
closeness: absolutely necessary (A), very important
(E), important (I), ordinary importance (O),
unimportant (U) and undesirable (X). These rates are
subjectively defined based on (Muther and Wheeler,
1962).
The qualitative objective function is expressed
by:
(37)
Where:
R
ij
: Relationship value that expresses the need for
proximity i.e. If two activities have a strong positive
relationship, they are considered adjacent, thus we
consider the rank A. The AEIOUX rates are
respectively considered equal to 16, 8, 4, 2, 0 and -2
(see Figure 1).
µ
ij
: Adjacency coefficient that expresses the
proximity of each two activities in the final layout:
Fully adjacent (µ
ij
=1): Two activities are fully
adjacent when they are facing each other directly.
Non-adjacent (µ
ij
=0): If the activities don’t share
any point or when they can’t be seen together in the
same area (septic/aseptic area).
The final objective function that we considered is a
weighted sum of the two objective functions shown
above:
∶
∗
(38)
To facilitate computation, we choose
0.5.
4 EXPERIMENTS
In this section, we validated the proposed
formulation using previously published two data
instances available in the literature (Chraibi et al.,
2013) on OTFL optimization. We used ILOG
CPLEX 12.2 software to solve the model using
Windows 7 platform, Intel5® Core ™ i5-2410M
CPU@ 2.30GHz and 6Go of RAM. For all
instances, the followings settings were used:
0.5,
80,
60,
40 and
20 are used.
The data instance are of dimension consisting of
eleven activities. The placements of these activities
in the appropriate sections are affected by OT
international standards in addition to physical
dimensions - a set of specific practices and
procedures performed under carefully controlled
conditions with the goal of minimizing
contamination by pathogens.
In this work, we only consider the restricted and
aseptic zone; the trip is assured by corridors that
make possible traveling between the four zones.
AMulti-objectiveMixed-IntegerProgrammingModelforaMulti-SectionOperatingTheatreFacilityLayout
201
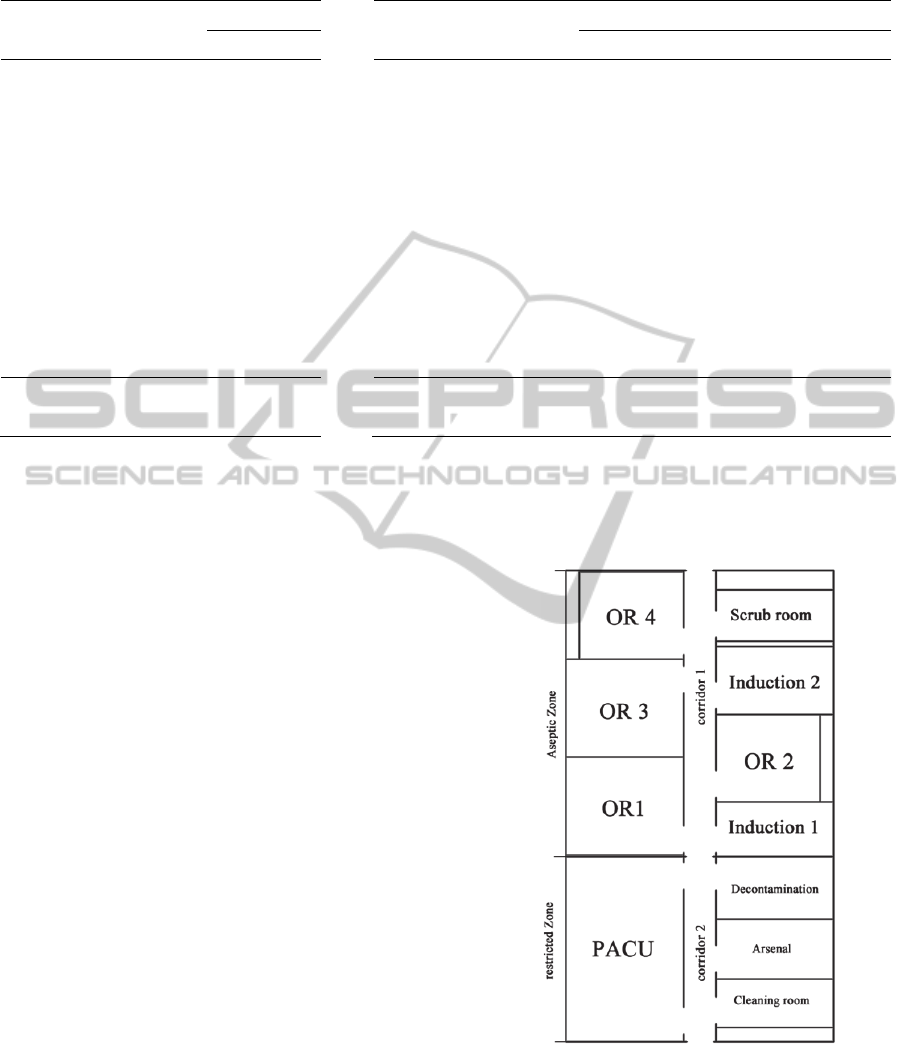
Table 1: Instance 1 with eleven activities.
Nomination
Dimensions
Nomination
Orientation Optimal location
αi βi li di xi yi
Induction 1 8.6 4 Induction 1 8,6 4 15,3 15,6
Induction 2 8.6 5 Induction 2 8,6 5 15,3 26,5
OR1 8.6 7.2 OR1 8,6 7,2 4,3 17,3
OR2 7.6 6.4 OR2 7,6 6,4 15,3 20,8
OR3 8.6 7.2 OR3 8,6 7,2 4,3 24,5
OR4 7.6 6.4 OR3 7,6 6,4 4,3 31,3
Scrub room 3.4 8.6 Scrub room 8,6 3,8 15,3 31,3
PACU 13.4 8.6 PACU 8,6 13,6 4,3 6,8
Decontamination 4.6 8.6 Decontamination 8,6 4,6 15,3 11,3
Cleaning room 3.6 8.6 Cleaning room 8,6 3,6 15,3 2,8
Arsenal 4.4 8.6 Arsenal 8,6 4,4 15,3 6,8
Corridor 1 2.4 21 Corridor 1 2.4 21 9.8 24,1
Corridor 2 2.4 13.6 Corridor 2 2.4 13.6 9.8 6,8
(a) activities dimensions (b) Orientation and optimal location results
Instance 1: Large activities and more relationships
are considered. This example gives the optimal
layout with eleven activities. In contrary situation
to the first instance, the induction rooms are
considered to be independent activities where the
OR1 and OR2 share the induction room1 while the
OR3 and OR4 share the induction room2. The
scrub room is also shared by all the activities in the
aseptic section. Xmax and Ymax are fixed to 20
and 34.6, respectively (See Table1.a). Table 1.b
shows the optimal solution that was obtained after
23.06 sec. Figure 1 shows the optimal OT layout
for this configuration. Using the continuous
representation, we tested to solve the OT LP with
only the quantitative objective function. The
resulting layouts are more satisfactory than in
(Chraibi et al. 2013), both in term of quality, time
processing and the respect of entities flow.
In addition, the use of weighted criteria
function proved that the results were best in both
responding to our objectives and in computation
time. Several improvement works are planned such
as to use of heuristics for large sized OT.
5 CONCLUSIONS
In this paper, a new mixed integer linear
programing (MILP) model was introduced to find
the optimal solution to the Operating Theater
Layout Problem, which consists of laying medial
service activities on two-floor levels in two-
dimensional space.
Figure 1: Instance 1 optimal layout.
The MILP model was able to determine
simultaneously the position and the orientation of
each activity, the distribution of the set of activities
among floors, the location of corridors and lifts in
the final OT layout while minimizing the total
ICORES2014-InternationalConferenceonOperationsResearchandEnterpriseSystems
202

traveling cost and maximizing the desirable
closeness of activities to each other according to
international standards.
The proposed model was validated on two
typical instances from the literature. In our
numerical experiments, we observed that the
computation time increases as the number of
department increases until it reaches the maximal
number of facilities. The MILP model was able to
generate optimal solutions for thirteen activities
within seconds on a personal computer.
For future direction, the authors are
investigating other options such as (a) calculating
distances based on originating input and final
destination output point, (b) considering the
relationship between activities and the outside
environment, (c) applying the model to a larger
sized instances of OT layout (d) considering
activities with non-rectangular shape and (e) using
other heuristics and meta-heuristics to solve large
sized instances.
REFERENCES
AIA (American Institution of Architecture), Guidelines
for Design and Construction of Health Care
Facilities. http://www.aia.org.
Assem, M., Ouda, B., & Abdel Wahed, M., (2012).
Improving Operating Theatre Design Using
Facilities Layout Planning. Cairo International
Biomedical Engineering Conference (CIBEC),
Cairo, Egypt, December 20-21, 2012.
Barrett, A. (2008). Optimization of facility design and
workflow process at the phlebotomy clinic of
Toronto general hospital. Toronto: University of
Toronto
Chraibi, A., Kharraja, S., Osman, I.H., and Elbeqqali, O.
(2013). A mixed integer programming formulation
for solving Operating Theatre layout problem: a
multi-goal approach. Proceedings of IESM 2013,
Rabat, Morocco, October 27-30
th
.
Commander, C. W. (2003). A survey of the quadratic
assignment problem, with applications (Doctoral
dissertation, UNIVERSITY OF FLORIDA).
Denton, B., Viapiano, J., & Vogl, A. (2007).
Optimization of surgery sequencing and scheduling
decisions under uncertainty. Health Care
Management Science, 10 (1), 13–24.
Feyzollahi, M., Shokouhi, A., Modarres Yazdi, M., &
Tarokh, M. (2009). Designing a model for optimal
hospital unit layout. Pajoohandeh Journal, 14(4),
191–198.
FGI (Facility guideline institution), Guidelines for
Design and Construction of Health Care Facilities.
http://www.fgiguidelines.org.
Guerriero, F., & Guido, R. (2011). Operational research
in the management of the operating theatre: A
survey. Health Care Management Science,14, 89–
114.
Hassan, M., & Hogg, G. L. (1987). A review of graph
theory application to the facilities layout problem.
Omega, 15(4), 291-300.
Hathhorn, J., Sisikoglu, E., & Sir, M. Y. (2013). A
multi-objective mixed-integer programming model
for a multi-floor facility layout. International
Journal of Production Research, (ahead-of-print), 1-
17.
Jingwei, Z., Ting, R., Husheng, F., Jinlin, Z., & Ming, L.
(2012, May). Simulated annealing ant colony
algorithm for QAP. In Natural Computation (ICNC),
2012 Eighth International Conference on (pp. 789-
793). IEEE.
Koopmans, T. C., & Beckmann, M. (1957). Assignment
problems and the location of economic activities.
Econometrica: Journal of the Econometric Society,
53-76.
Lin, Q. L., Liu, H. C., Wang, D. J., & Liu, L (2013).
Integrating systematic layout planning with fuzzy
constraint theory to design and optimize the facility
layout for operating theatre in hospitals. Journal of
Intelligent Manufacturing, 1-9.
Maryam, H., Lei, W., Yuet, W., & Houshang, D. (2006,
May). Renovation of mercy family health center. In
Information Control Problems in Manufacturing
(Vol. 12, No. 1, pp. 665-670).
Meller, R. D., & Gau, K. Y. (1996). Facility layout
objective functions and robust layouts. International
journal of production research, 34(10), 2727-2742.
Montreuil, B., (1990), A modeling framework for
integrating layout design and flow network design,
Proceedings of the Material Handling Research
Colloquium, pp. 43-58.
Motaghi, M., Hamzenejad, A., & Riyahi, L. (2011).
Optimization of hospital layout through the
application of heuristic techniques (Diamond
Algorithm) in Shafa hospital. International Journal
of Management of Business Research, 1(3), 133–
138.
Osman, I.H., Al-Ayoubi, B., and Barake, M.A. (2003).
A greedy random adaptive search procedure for the
weighted maximal planar graph problem. Computers
and Industrial Engineering. Vol. 45, 635-651.
Osman, I.H. (2006). A tabu search procedure based on a
ranked-roulette diversification for the weighted
maximal planar graph problem. Computers and
Operations Research. Vol. 33: 2526-2546.
Osman, I.H., Hasan, M. and Abdullah, A. (2002). LP-
based meta-heuristics for the weighted maximal
planar graph problem. Journal of Operational
Research Society, Vol. 53, 10, 1142-1149.
Padgaonkar, A. S. (2004). Modeling and analysis of the
hospital facility layout problem. New Jersey: New
Jersey Institute of Technology.
Ramkumar, A. S., Ponnambalam, S. G., & Jawahar, N.
(2007, September). An evolutionary search heuristic
for solving QAP formulation in facility layout
AMulti-objectiveMixed-IntegerProgrammingModelforaMulti-SectionOperatingTheatreFacilityLayout
203

design. In Evolutionary Computation, 2007. CEC
2007. IEEE Congress on (pp. 4005-4011). IEEE.
Sehulster, L., Chinn, R. Y., Arduino, M. J., Carpenter, J.,
Donlan, R., Ashford, D. & Cleveland, J. (2003).
Guidelines for environmental infection control in
health-care facilities. Morbidity and Mortality
Weekly Report Recommendations and Reports RR,
52(10).
Tarkesh, H., Atighehchian, A., & Nookabadi, A. S.
(2009). Facility layout design using virtual multi-
agent system. Journal of Intelligent Manufacturing,
20, 347–357
Tompkins, J. A., White, J. A., Bozer, Y. A., and
Tanchoco, J. M. A., Facilities Planning, Wiley, New
York, New York, 4th edition (2010).
Tsai, R. D., Malstrom, E. M., & Kuo, W. (1993). Three
dimensional palletization of mixed box sizes. IIE
transactions, 25(4), 64-75.
Tzortzopoulos, P. et al. 2008. Design for Operational
Efficiency–Linking Building and Service Design in
Healthcare Environments. In: Proceedings:
ELAGEC-II Encuentro Latino-Americano De
Gestion Y Economia De La Construccion, Santiago,
Chile, January, 24–25.
Vos, L., Groothuis, S., & van Merode, G. G. (2007).
Evaluating hospital design from an operations
management perspective. Health care management
science, 10(4), 357-364.
Wahed, M. A., Ouda, B. K., & Elballouny, M. (2011).
Evaluation of an Operating Theater Design by a
Software Program (OTDA: Operating Theater
Design Analyzer). International Journal of Database
Management Systems, 3(3).
ICORES2014-InternationalConferenceonOperationsResearchandEnterpriseSystems
204
