
Analysis of Downward Product Substitution in a Recoverable System
Fethullah Gocer
1
, S. Sebnem Ahiska
1
and Russell E. King
2
1
Industrial Engineering Department, Galatasaray University, Ortakoy, Istanbul, 34349, Turkey
2
Edward P. Fitts Department of Industrial and Systems Engineering, North Carolina State University, Raleigh, NC, U.S.A.
Keywords: Product Substitution, Remanufacturing, Manufacturing, Inventory Control, Markov Decision Process.
Abstract: We consider the inventory control problem for an infinite-horizon stochastic hybrid manufacturing /
remanufacturing system with product substitution under stochastic demand and returns. Remanufactured
and manufactured products are considered as two different products, having different costs and selling
prices as well as separate demand streams. Remanufactured products have a higher stock out risk because
the remanufacturing capacity is mainly dependent on the amount of returns available for remanufacture.
One way to cope with the stock-out issue for remanufactured products is to use a downward substitution
strategy, which allows a manufactured product (i.e. higher value item) to be substituted for a
remanufactured product (i.e. lower value item) in case the latter runs out of stock. We formulate this
problem as Markov Decision Process in order to determine the optimal manufacturing and remanufacturing
decisions under product substitution, and through numerical experimentation, we investigate the effects of
stochastic demand/return distributions on the profitability of the substitution strategy.
1 INTRODUCTION
More and more manufacturers are collecting back
their products from customers after usage or at the
end of their life due to both environmental
regulations and concerns as well as the potential
economic benefits of product recovery. Product
recovery, especially remanufacturing, can
substantially reduce the resource consumption and
waste disposal, which consequently results in
savings in material, energy and disposal costs.
During the early years of the remanufacturing
operations, manufacturers considered only savings
in costs. As governments tighten environmental laws
and regulations, many manufacturers are required to
incorporate product recovery activities where a
significant portion of production uses recovered
material. As product returns increase, the
profitability of hybrid recoverable manufacturing
systems increase (Robotis et al., 2005). While
manufacturers often consider remanufacturing as an
obligation forced by government regulations, in
recent years, they have also realized that customers
may also prefer remanufactured products for the
price advantage as well as environmental awareness.
In this study, we consider inventory control of a
hybrid manufacturing/remanufacturing system,
which has two modes of supply in order to satisfy
customer demand: manufacturing of new items and
remanufacturing of returned items. Here production
planning and control focuses on the effective
utilization of resources in order to satisfy customer
demand in a cost-efficient manner. In a hybrid
system where the new and remanufactured items are
viewed as not having the same value, there are
mainly three types of inventories: manufactured
items, returned items and remanufactured items.
Here, we consider product substitution among
manufactured and remanufactured items to mitigate
lost sales (backorders) in a cost effective way.
In most hybrid systems studies, the manufactured
and remanufactured items are assumed to be alike;
therefore they are stored in the same serviceable
inventory and have a common demand stream. In
some cases though, customers may perceive lower
quality in a remanufactured item and expects to pay
less for it than for a new item resulting in a
segmented market among the items. When
manufactured and remanufactured items are non-
identical, product substitution may be used in case of
a stock-out. The substitution style varies depending
on whether it is customer- or manufacturer-driven.
Under ‘upward substitution’ a customer demanding
a newly manufactured product agrees to accept a
108
Gocer F., Sebnem Ahiska S. and King R..
Analysis of Downward Product Substitution in a Recoverable System.
DOI: 10.5220/0004833301080115
In Proceedings of the 3rd International Conference on Operations Research and Enterprise Systems (ICORES-2014), pages 108-115
ISBN: 978-989-758-017-8
Copyright
c
2014 SCITEPRESS (Science and Technology Publications, Lda.)

remanufactured product. This customer driven
process is known as two-way substitution such that
when a customer’s first-choice product is out-of-
stock, he/she buys a similar product within same
category (Huang et al., 2011). Alternatively,
‘downward substitution’ (or one-way substitution) is
manufacturer-driven such that a higher-value item is
substituted for a stocked-out lower-value item. This
strategy is commonly used by automotive spare part
manufacturers, e.g. for parts such as injectors and
engine starters (Ahiska et al., 2013).
We analyse a periodically reviewed stochastic
hybrid manufacturing/remanufacturing system under
downward substitution. Using a Markov decision
process (MDP), we find optimal inventory control
(i.e. optimal manufacturing and remanufacturing
decisions). Our research extends earlier research by
numerically investigating how the profitability of a
product substitution strategy is affected by the
characteristics of the demand/return distributions.
2 LITERATURE REVIEW
Hybrid manufacturing and remanufacturing systems
are more difficult to control than the traditional pure
manufacturing systems due to many factors. First,
the flow of product returns in terms of quantity and
timing is uncertain. Second, the manufacturing and
remanufacturing processes are usually interrelated
because they either share common production
resources (such as common storage area, production
line or workforce) or produce products that are
substitutable. Hence, for an efficient control of
manufacturing and remanufacturing systems, the
coordination between them is essential. The
inventory management of hybrid production systems
has received significant attention in the literature
over the last couple of decades. However, the studies
that specifically analyse the use of product
substitution strategies in these systems are scarce.
Most of these studies consider a single-period
setting. Inderfurth (2004) investigates analytically
the structure of optimal inventory policy for a hybrid
system under one-way product substitution in a
single-period setting. Kaya (2010) considers partial
substitution of manufactured and remanufactured
products in a single-period newsvendor setting. Jin
et al. (2007) use a threshold level to control when to
offer new products as substitutes for remanufactured
products in a single-period monopoly setting.
Robotis et al. (2005) consider a single-period multi-
product stochastic system with downward
substitution where there is only remanufacturing of
the used products. Considering the quality of the
used items, some portion of them is resold to
secondary markets while the remaining part is
remanufactured. Bayindir et al. (2005) use a
continuous-review inventory policy to control the
hybrid system, and they determine whether the
remanufacturing option is profitable under one-way
substitution policy. Bayindir et al. (2007) extend
their study by adding a capacity constraint for the
single-period version of the problem, and they
investigate the effect of substitution on the optimal
utilization of remanufacturing.
Some work on hybrid systems with product
substitution assumes a deterministic environment for
demand and returns. Pineyro and Viera (2010)
formulate an NP-hard deterministic economic lot-
sizing problem where new items can substitute for
remanufactured items. They find an optimal or near
optimal solution using a Tabu-search procedure. Li
et al. (2006) propose a dynamic program in order to
minimize manufacturing, remanufacturing, holding
and substitution costs for an uncapacitated multi-
product production planning problem with time-
varying demands in a finite time horizon with no
disposal or backlog. In another study by Li et al.
(2007), the finite-horizon multi-period two-product
capacitated dynamic lot sizing problem is analysed
for deterministic time-varying demands. They apply
a genetic algorithm and then develop a dynamic
programming approach to provide the optimal
solution to capacitated production planning model
with remanufacturing and substitution problem.
Inventory models with two-way substitution is
another stream of research that enable consumers to
substitute products within the same category.
Korugan and Gupta (2001) is among the earliest
work on product substitution in a stochastic hybrid
system. They study a system where the demand for a
certain type of product is satisfied with either new
items or remanufactured items. In a later work,
Korugan (2004) considers alternative substitution
policies for hybrid manufacturing/remanufacturing
system using an MDP.
Recently, Ahiska et al., (2013) discuss multi-
period periodic-review inventory control problem
for a hybrid manufacturing/remanufacturing system
with product substitution to find the optimal
inventory policies for both with and without one-
way product substitution using discrete-time MDPs.
They assume stochastic demands and returns and
one period lead time for manufacturing and
remanufacturing operations.
In this paper, we analyse the profitability of the
downward substitution strategy under different
AnalysisofDownwardProductSubstitutioninaRecoverableSystem
109

stochastic demand and return settings for a
periodically-reviewed hybrid system.
3 PROBLEM DESCRIPTION
We consider a recoverable manufacturing system
with two production processes: manufacturing and
remanufacturing. Manufacturing produces new items
using externally supplied virgin materials while
remanufacturing uses a returned item to produce a
remanufactured item. Remanufactured products are
viewed as having an inferior value by customers,
therefore they are sold for a lower price than new
items and have a different customer profile. Hence,
there is a segmented market for manufactured (i.e.
new) and remanufactured items. In real-world
situations, demand is stochastic, which may cause
excessive inventory to build up or lost sales to occur
if poor production decisions are made. The classic
tradeoff exists between lost sales or excess inventory
to avoid loss of customer goodwill. In this paper,
downward substitution is considered to reduce the
lost sales risk for remanufactured products such that
when the remanufactured item inventory runs out of
stock, a new item is sold to the customer at the
remanufactured item price (i.e. the discounted price).
No explicit cost associated with substitution is
considered other than the opportunity cost of selling
the manufactured item at the discounted price.
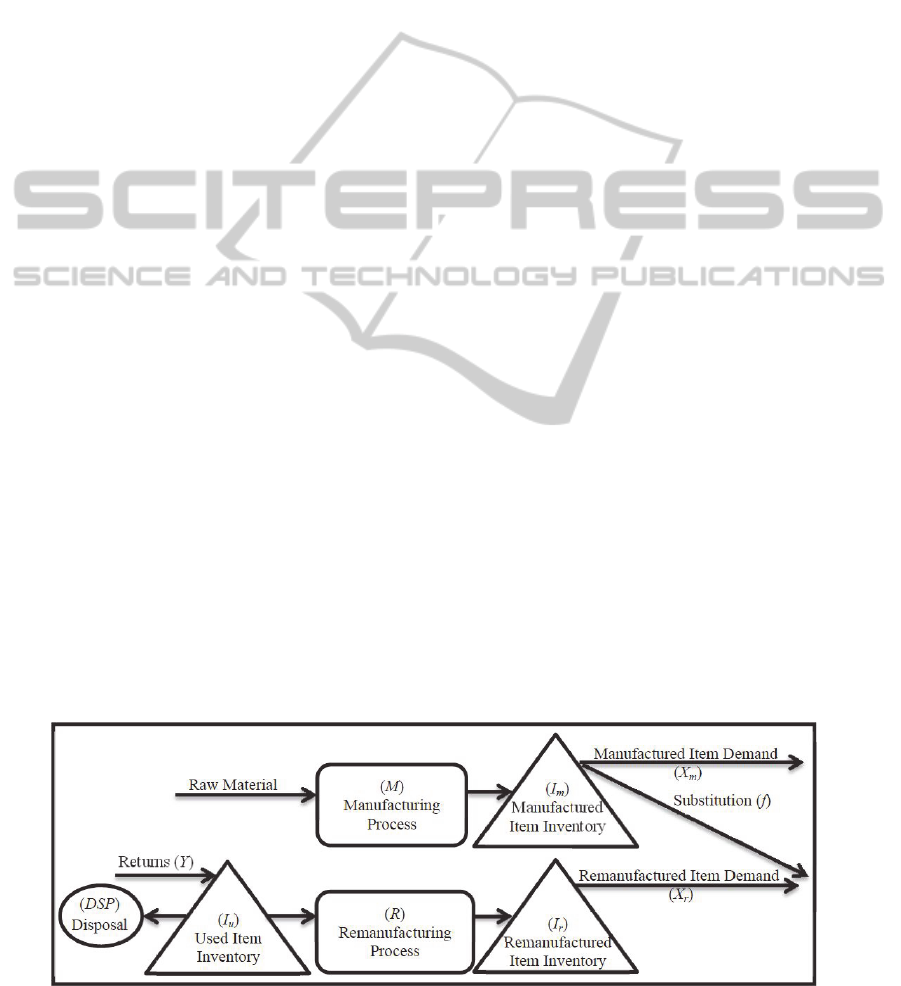
Fig. 1 illustrates the hybrid manufacturing/
remanufacturing system under downward product
substitution. There are three stocking points in this
system: the recoverable inventory that includes the
used or returned items, the remanufactured items
inventory and the manufactured items inventory.
The incoming returned items are disposed only if
recovered item inventory is full, otherwise they are
stored for later remanufacture. After manufacturing
and remanufacturing operations, the resulting items
are stored in their respective inventories. During
each period, demand for the manufactured and
remanufactured items diminish the corresponding
inventory levels. At the beginning of every period,
the quantities to manufacture and remanufacture
must be determined.
This problem was formulated by Ahiska et al.,
(2013) as a discrete-time MDP to find the optimal
manufacturing and remanufacturing decisions. The
MDP model formulation is briefly described below.
The state of the system in a period, denoted by S
,
is represented by three variables I
u
, I
r
, and I
m
which
are the inventory levels of used (i.e. recoverable),
remanufactured and manufactured items
respectively. These inventory levels are bounded as
,
and 0
.
means that backordering of the demand is
allowed up to
for j=r,m if
0
.
In this system we have to make the decisions of
how many units to manufacture (d
m
), and to
remanufacture (d
r
). For each system state, we find
the feasible values for (d
m
, d
r
) decisions considering
the production and storage capacities.
Given that the current state is S=(I
u
, I
r
, I
m
), the
manufacturing and remanufacturing decisions are d
r
and d
m
, and manufactured item demand (X
m
),
remanufactured item demand (X
r
) and returns (Y)
take the values x
m
,x
r
and y, respectively, the next
state will be
,
,
where
,
and
are
calculated as follows.
The inventory level for used items decreases for
each unit sent into the remanufacturing process and
increases by the amount of used items that are
returned, but cannot exceed the used item storage
capacity, as shown below.
,
(1)
The inventory levels for both items at the end of the
current period depend on current inventories,
demand for corresponding items and manufacturing
and remanufacturing decisions, and also on the
product substitution strategy such that unfulfilled
remanufactured item demand is met from the
manufactured item stock if stock is available after
first satisfying the demand for manufactured items.
The amount of remanufactured item demand
satisfied from new item stock, i.e. the amount of
substitution, f, is computed as follows.
Clearly, if I
r
≥x
r
(no shortage for remanufactured
items) or if I
m
≤x
m
(no manufactured items left in
stock after satisfying demand for manufactured
items), no product substitution will occur (f=0). In
this case, the amount of remanufactured item
demand that remains unsatisfied, denoted by l, is
l=max{x
r
-I
r
, 0}. If I
r
<x
r
(i.e. there is a shortage of x
r
-
I
r
remanufactured items) and if I
m
>x
m
, then there are
I
m
-x
m
items left in manufactured item stock that can
be used to deal with the remanufactured item
shortage. In this case, the amount of substitution is
f=min{I
m
-x
m
,x
r
-I
r
} and the amount of
remanufactured item demand that remains
unsatisfied after product substitution occurs is
l=max{x
r
-I
r
-f, 0}. General formulations for f and l
that cover all the ‘if’ conditions defined in this
paragraph can be formed as: f=[min{I
m
-x
m
, x
r
-I
r
}]
+
and l=[x
r
-I
r
-f]
+
where[x]
+
=max{x,0}.
The substitution amount f and unsatisfied
ICORES2014-InternationalConferenceonOperationsResearchandEnterpriseSystems
110
remanufactured item demand l being defined as
above, the inventory levels for manufacturing and
remanufacturing items at the beginning of next
period are formulated as:
,
(2)
,,
(3)
The state transitions under a no substitution strategy
can be simply obtained by setting f=0 in the
formulations above.
The transition probability from S to
under
decision
,
, represented by ,
,
,
equals the sum of the probabilities of occurrence for
demands and returns, (x
m
, x
r
, y), that lead to
transition from S to
under the
decision
,
.The objective of this problem is to
maximize the expected profit per period. The profit
is simply defined by the total revenue obtained from
selling the products minus the total cost including
manufacturing and remanufacturing cost, holding
costs for different stocking points, backordering
cost, lost sales cost and disposal cost.
The following notation is used.
p
m
: unit price for manufactured product
p
r
: unit price for remanufactured product
s
m
: setup cost for manufacturing
s
r
: setup cost for remanufacturing
c
m
: unit manufacturing cost
c
r
: unit remanufacturing cost
h
m
: manufactured product period unit holding cost
h
r
: remanufactured product period unit holding cost
h
u
: used (returned) product period unit holding cost
b
m
: manufactured product period unit backorder cost
b
r
: remanufactured product period unit backorder
cost
l
m
: unit lost sales cost for manufactured products
l
r
: unit lost sales cost for remanufactured products
k: unit disposal cost for used products
DSP: disposal amount for the current period
LS
m
: current period manufactured items lost sales
LS
r
: current period remanufactured items lost sales
BO
m
: current period backordered manufactured item
demand
BO
r
: current period backordered remanufactured
item demand
Given that the system state is S, demand is x
m
and x
r
units for manufactured and remanufactured items
respectively, y units of return occur, and decisions d
r
and d
m
are made, the profit is calculated as:
,
,
,
,
,
(4)
where Q
r
and Q
m
represent the amounts of
remanufactured and manufactured items sold for
their corresponding prices, respectively.
,0
(5)
,0
(6)
0
0
0
(7)
0
0
0
(8)
,
0
(9)
(10)
0
(11)
Figure 1: Hybrid manufacturing/remanufacturing system under downward substitution.
AnalysisofDownwardProductSubstitutioninaRecoverableSystem
111

0
(12)
0
(13)
Then the expected profit in a given period is
calculated as:
,
,
,
,
,
,
,
,
,
,
,
where
,
,
represents the joint probability
mass function for the random variables X
m
, X
r
and Y.
The formulation is solved with a variant of the
Howard (1960) policy iteration method using the
fixed policy successive approximation method by
Morton (1971) for computational efficiency.
4 NUMERICAL EXPERIMENTS
AND RESULTS
In this section, we analyse numerically the
profitability of using the downward substitution
strategy under different demand/return distributions.
For the numerical experimentation, we consider
a product produced by an international automotive
spare part manufacturer. Due to privacy concerns,
the data is scaled and the identity of the firm is kept
anonymous. Due to the vigorous competition in the
sector, over the last few years the firm noticed that
the lost sales due to stock-outs of remanufactured
products were resulting in loss of customers and
damage to the image of the firm in the market.
Hence, customer satisfaction is very important, and
in order to guarantee a high level of customer
satisfaction, the company is considering a stock-out
based substitution strategy. The product for which
we evaluate the substitution strategy is an ‘engine
starter’ which is a type of electric motor. This
product family was among the firm’s first
production, and a better service level for this product
is considered to be prestigious by the manufacturer
(Ahiska et al., 2013).
The unit selling prices for the manufactured (i.e.
new) and remanufactured engine starter are 68.39€
and 51.85€, respectively, and the unit manufacturing
and remanufacturing costs are 22.74€ and 17.46€.
The manufacturer tolerates the backordering of the
manufactured item demand up to a certain level (i.e.
0) while backordering of the remanufactured
item demand is not allowed (i.e.
0) due to
the risks associated with receiving returns when
needed. If some remanufactured item demand
remains unsatisfied after the substitution is done,
then this demand is lost. Unit backordering cost for
manufactured product per period is calculated as
20% of its unit price while unit lost sales cost (cost
of goodwill loss) for both manufactured and
remanufactured products are calculated as 25% of
the corresponding unit price. The annual holding
costs for manufactured and remanufactured items
are calculated as 20% of the corresponding unit cost,
and the holding cost for a used item is considered to
be half of the holding cost for a remanufactured
item. The lead times for manufacturing and
remanufacturing are both one period. No set up costs
exists for either production option.
We design the first set of experiments in order to
investigate how the profitability of product
substitution strategy is affected as the means of the
demand and return distributions change. In this set
of experiments, we use bounded discrete stochastic
distributions with three different shapes for the
manufactured and remanufactured item demands and
used item returns, which are uniform, normal, and
right skewed. The mean of each different-shape
stochastic distribution is assigned three different
values: low, medium and high, as shown in Table 1.
Table 1: Mean values for different distributions.
Mean
Distribution shape High Medium Low
Uniform (Uni) 2.00 1.50 1.00
Normal (Nrm) 2.51 2.00 1.50
Right skewed (RS) 1.20 1.05 0.54
In all, 27 combinations of the three means are
created by assigning the three different levels of the
mean of the distribution for manufactured item
demand (E[X
m
]), remanufactured item demand
(E[X
r
]) and used item returns (E[Y]). These 27
combinations coupled with the three distribution
shapes yield a total of 81 scenarios. For each
scenario, the optimal expected profits per period for
the hybrid system under substitution and no
substitution strategies are determined by solving the
MDP as defined in the previous section.
The % improvements in profit gained by
substitution vs. no substitution are reported in Table
2. We make the following observations: When the
mean of remanufactured item demand is at least as
much as the mean of returns (E[X
r
]≥E[Y]), the
substitution strategy results in additional profit for
ICORES2014-InternationalConferenceonOperationsResearchandEnterpriseSystems
112
the manufacturer. Among the 54 scenarios where
E[X
r
]≥E[Y], the highest improvement in profit was
85%. When returns are substantially higher than the
remanufactured item demand (i.e. E[X
r
]<E[Y]), the
use of substitution is not economically justified. It
caused loss of profit but only up to 3% among the 27
scenarios we considered (see Table 2). Further
experimentation (not shown here) reveals that if the
average returns exceed the demand but at a lower
level than the amounts shown in Table 1,
substitution is still profitable.
It is worth noting that the mean of manufactured
item demand does not affect the amount of change in
profit by substitution. However because the profit of
manufacturing is lower for lower manufactured item
demand, a same amount of change in profit by
substitution corresponds to a higher percent change
of profit over no substitution case as the mean of
manufactured item demand decreases. In short, the
profitability of product substitution strategy is
mainly dependent on the size of remanufactured
item demand relative to that of returns.
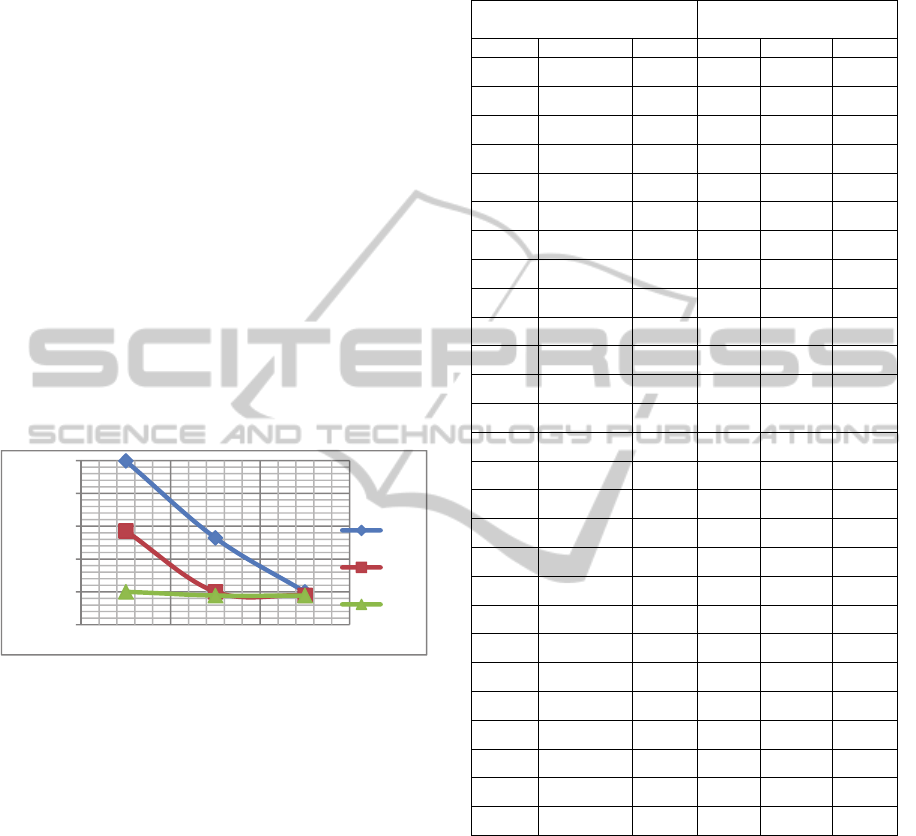
Figure 2: % improvement in profit as E[X
r
] and E[Y]
change (for Normal-shape distribution and low E[X
m
]).
Clearly, substitution results in a higher
improvement in profit when the expected
remanufactured item demand gets higher and/or the
expected return gets lower. For representative results
supporting this comment, see figure 2, which plots
the % improvements in profit by substitution for
nine scenarios with the low level of mean
manufactured item demand and the Normal shaped
distribution, and the mean of remanufactured item
demand and returns as low, medium and high. As
the ratio of the mean remanufactured item demand
to the mean returns increases from lowest
(E[X
r
]=low, E[Y]=high) to highest (E[X
r
]=high,
E[Y]=low), the percent change of firm’s profit when
the product substitution strategy is used increases
from -1.1% to 39.9%.
Table 2: The improvement in profit by substitution (%) for
different combinations of E[X
m
], E[X
r
] and E[Y] under
different-shape distributions.
Means
Improvement in profit by
substitution (%)
E[X
m
] E[X
r
] E[Y] Uni Nrm RS
high high high 1.75 0.00 2.29
high high med 15.25 12.00 7.63
high high low 37.11 27.61 43.84
high med high -1.06 -0.77 -0.53
high med med 1.16 0.00 2.18
high med low 17.49 13.02 32.81
high low high -1.24 -0.80 -1.63
high low med -1.23 -0.79 -1.64
high low low 0.47 0.02 1.11
med high high 2.03 0.00 2.47
med high med 18.23 13.86 8.30
med high low 46.42 32.63 49.31
med med high -1.27 -0.89 -0.59
med med med 1.38 0.01 2.37
med med low 21.58 15.28 36.74
med low high -1.53 -0.95 -1.86
med low med -1.51 -0.94 -1.87
med low low 0.57 0.02 1.22
low high high 2.44 0.00 3.47
low high med 22.73 16.43 11.84
low high low 62.10 39.87 84.82
low med high -1.58 -1.04 -0.82
low med med 1.70 0.02 3.42
low med low 28.14 18.54 61.82
low low high -2.00 -1.13 -3.03
low low med -1.97 -1.12 -3.02
low low low 0.73 0.03 2.01
We performed a second set of experiments in
order to clearly see how the economic attractiveness
of the substitution strategy varies as the return
distribution changes. For this purpose, nine different
return distributions are created with different
coefficients of variations (CVs) ranging from 0.2 to
1.0 with an increment of 0.1, which are plotted in
figure 3. All the distributions have the standard
deviation of 0.5, hence they differ only by their
mean, which ranges from 2.5 to 0.5 as CV changes
from 0.2 to 1.0. The return distribution with
coefficient of variation of 0.6 is also used as the
demand distributions for remanufactured and
manufactured items in this set of experiments.
-10
0
10
20
30
40
% Imp. by
Substitution
low med high E[Y]
High
Med
Low
E[Xr]
AnalysisofDownwardProductSubstitutioninaRecoverableSystem
113
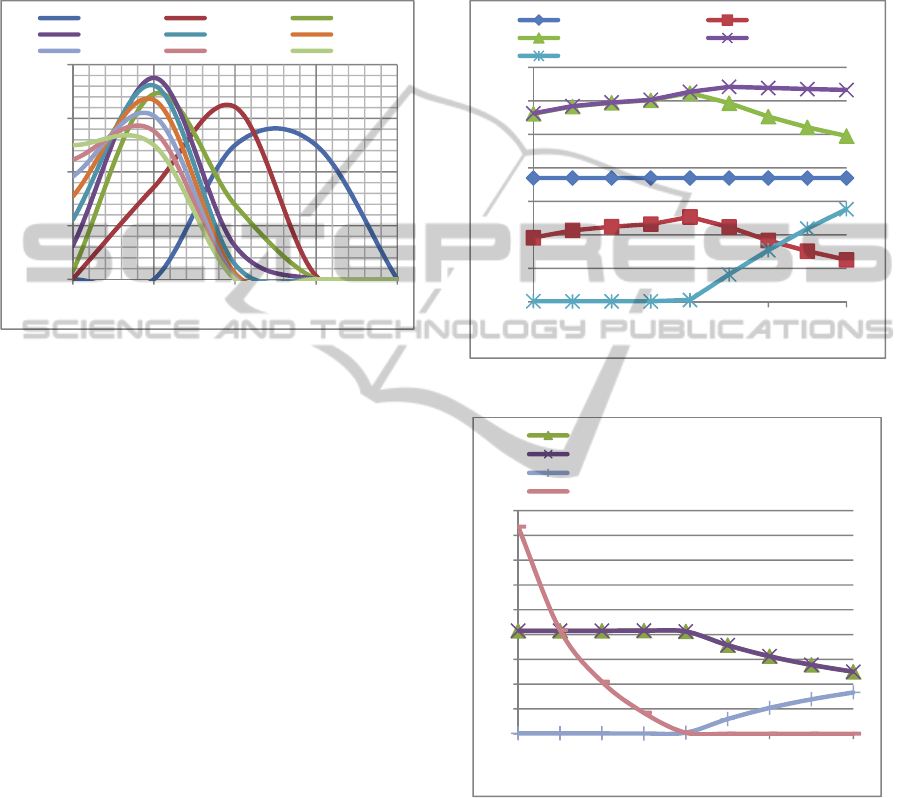
Figure 4 shows how the expected profits for the
hybrid system with/without product substitution
change as the mean of the return distribution
decreases from 2.5 to 0.5 (or CV increases from 0.2
to 1). The expected profits from the remanufacturing
and manufacturing processes are also plotted
separately for the no substitution case.
Figure 3: The return distributions with different coefficient
of variations (CVs).
The following observations are made: Recall that
the CV of remanufacturing item demand distribution
was set 0.6. Hence, in all the scenarios with return
distribution’s CV<0.6, the mean of return is higher
than the mean of remanufactured item demand
(E[Y]>E[X
r
]). When CV<0.6, the use of substitution
does not provide substantial additional profit over no
substitution case (only around 0.2%) since the
amount of returns available are typically sufficient to
meet remanufactured item demand. However when
CV exceeds 0.6 (i.e. E[Y] goes below E[X
r
]), a
decrease in returns increases the economic
attractiveness of product substitution from 0.6% to
nearly 28%.
Another observation is that when CV<0.6, an
increase in CV (i.e. decrease in expected return)
results in an increase in remanufacturing process
profit while the effect is opposite for CV>0.6. This
can be explained as follows: For CV<0.6, the
expected remanufacturing amount (consequently, the
sales revenue for remanufactured items and the
remanufacturing cost) remains unchanged as
expected returns decrease because the returns are
sufficient to meet the remanufactured item demand
and the expected remanufacturing amount is just as
much as remanufactured item demand. In this case
the increase in profit for remanufacturing process is
explained by the significant amount of savings
obtained in disposal cost since less disposal is
needed as returns get lower (see figure 5). For
CV>0.6 (i.e. returns are not sufficient to meet all
remanufactured item demand), a decrease in
expected return decreases the profit for
remanufacturing process because in this case sales
revenue from remanufactured items decreases and
the lost sales cost increases (see figure 5).
Figure 4: The expected profits under different CVs.
Figure 5: Expected values for remanufacturing amount,
sales/lost sales for remanufactured items and disposal
amount for used items for the no substitution case under
different return CVs.
5 CONCLUSIONS
We analyze a periodically reviewed stochastic
manufacturing/remanufacturing system where the
remanufacturing items have an inferior value from
0,00
0,20
0,40
0,60
0,80
01234
Probability
Return Values
CV=0.2 CV=0.3 CV=0.4
CV=0.5 CV=0.6 CV=0.7
CV=0.8 CV=0.9 CV=1.0
0,00
10,00
20,00
30,00
40,00
50,00
60,00
70,00
0,20 0,40 0,60 0,80 1,00
CV of Return Distribution
Profit-Man. Profit-Rem.
Profit-NoSub Profit-Sub
% Imp by Sub
0
0,2
0,4
0,6
0,8
1
1,2
1,4
1,6
1,8
0,20 0,40 0,60 0,80 1,00
CV of Return Distribution
Remanufacturing Amount
Sales for Remanufactured Items
Lost Sales for Remanufactured Items
Disposal Amount for Used Items
ICORES2014-InternationalConferenceonOperationsResearchandEnterpriseSystems
114

customers’ point of view compared to newly
manufactured items. A downward product
substitution strategy is employed in case of a stock-
out for remanufactured items. The problem is
formulated as a discrete-time MDP in order to find
the optimal inventory policies for both with and
without product substitution. Through a numerical
study based on real data for a product produced by
an automotive spare part manufacturer, the
profitability of substitution is investigated under
different demand and return distributions. The
results show that the substitution strategy is
economically attractive when the expected demand
for remanufactured items is at least as much of
expected returns, and the improvement in profit by
substitution increases significantly as the size of
returns decreases relative to the size of
remanufactured item demand. These results should
encourage the manufacturers operating hybrid
systems to use the product substitution strategy since
it may increase significantly their profit along with
improving the service level by reducing the expected
lost sales for remanufactured parts.
Opportunities for future work include performing
extensive experimentation using a broad range of
input parameters to better understand the scenarios
best suited for substitution and those least suited. In
addition, characterization of the optimal policies will
lead to implementable policies.
ACKNOWLEDGEMENTS
This work has been financially supported by
Galatasaray University research fund grant no.
13.402.002 and the Laboratory for Additive
Manufacturing and Logistics at N.C. State
University. The authors would like to thank Emre
Kurtul for his help in collecting data from the
automotive spare part manufacturer.
REFERENCES
Ahiska, S. S., Kurtul, E., King, R. E., 2013. Determining
the value of product substitution for a stochastic
manufacturing/remanufacturing system, Proceedings
of Industrial and Systems Engineering Research
Conference, San Juan, Puerto Rico.
Bayindir, Z. P., Erkip, N., and Gullu, R., 2005. Assessing
the benefits of remanufacturing option under one-way
substitution, Journal of the Operational Research
Society, 56, 286-296.
Bayindir, Z. P., Erkip, N., and Gullu, R., 2007. Assessing
the benefits of remanufacturing option under one-way
substitution and capacity constraint, Computers &
Operations Research, 34, 487-514.
Howard, R. A., 1960. Dynamic Programming and Markov
Processes, The MIT Press, Cambridge.
Huang, D., Zhou, H., Zhao, Q. H., 2011. A competitive
multiple product newsboy problem with partial
product substitution, Omega, 39, 302-312.
Inderfurth, K., 2004. Optimal policies in hybrid
manufacturing/remanufacturing systems with product
substitution, International Journal of Production
Economics, 90, 325-343.
Jin, Y., Ana M., Yihao L., 2007. On the profitability of
remanufactured products, 18th Annual Conference of
POMS, 4-7.
Kaya, O., 2010. Incentive and production decisions for
remanufacturing operations, European Journal of
Operational Research, 201, 442-453.
Korugan, A., Gupta, S. M., 2001. Substitution policies for
a hybrid system, SPIE Proceedings, Vol. 4193, 1-6.
Korugan, A., 2004. The effect of product substitution at
non-boundary inventory states, Optics East.
International Society for Optics and Photonics, 224-
233.
Li, Y., Chen, J., and Cai, X., 2006. Uncapacitated
production planning with multiple product types,
returned product remanufacturing, and demand
substitution, OR Spectrum, 28, 101-125.
Li, Y., Chen, J., and Cai, X., 2007. Heuristic genetic
algorithm for capacitated production planning
problems with batch processing and remanufacturing,
International Journal of Production Economics, 105,
301-317.
Morton, T. E., 1971. Asymptotic convergence rate of cost
differences for Markovian Decision Processes,
Operations Research, 19, 244-248.
Pineyro, P., and Viera, O., 2010. The economic lot-sizing
problem with remanufacturing and one-way
substitution, International Journal of Production
Economics, 124, 482-488.
Robotis, A., Bhattacharya, S., Van Wassenhove, L. N.,
2005. The effect of remanufacturing on procurement
decisions for resellers in secondary markets, European
Journal of Operational Research, 163(3), 688-705.
AnalysisofDownwardProductSubstitutioninaRecoverableSystem
115
