
Intelligent Dynamic Load Management Based on Solar Panel Monitoring
Gwendolin Wilke
1
, Marc Schaaf
1
, Erik Bunn
2
, Topi Mikkola
2
, Remo Ryter
1
, Holger Wache
1
and Stella Gatziu Grivas
1
1
Institute for Information Systems, University of Applied Sciences and Arts Northwestern Switzerland,
Riggenbachstr. 16, 4600 Olten, Switzerland
2
BaseN Corporation, Helsinki, Salmisaarenaukio 1, FI-00180 Helsinki, Finland
Keywords:
Smart Grid, Complex Event Processing, Dynamic Data Handling.
Abstract:
The Smart Grid will largely increase the amount of measurement data that needs to be processed on distribution
grid level in order to fulfill the promised smart behavior. Many modern information systems are capable of
handling the produced data amounts quite well. However they are usually highly specialized systems that are
costly to change or limited to very basic analytical tasks. We aim to overcome these limitations by utilizing an
optimized event processing based framework that can easily be customized to a certain application scenario.
In the paper we outline our approach by applying it to one of our motivational scenarios from the area of
intelligent dynamic load management.
1 INTRODUCTION AND
PROBLEM STATEMENT
Smart Grids promise to improve the efficiency, reli-
ability and sustainability of today’s power grids by
utilizing communication and information technology.
To this end, detailed information on supply, transmis-
sion and consumption is made accessible, which leads
to a massive increase in measurement data to process
in particular at the distribution grid level. This holds
most notably for dynamic load management (DLM)
approaches, cf., e.g., (Koch et al., 2009; Dam et al.,
2008).
Dynamic load management is a special form of
demand-side management that refers to the ability to
influence load curves dynamically as a reaction to
an operational state, such as transformer overload-
ing or the measured level of energy production of a
photovoltaic unit (PV). DLM will become particu-
larly important in the future due to the proliferation of
stochastic and distributed renewable energy sources
such as solar panels and wind turbines (Molderink
et al., 2010): The high fluctuation in energy pro-
duction leads to higher grid volatility, which jeopar-
dizes the stability and security of power supply. DLM
can be used to balance fluctuations by complement-
ing long-term storage units, such as pumped-storage
hydropower plants, cf., e.g., (Koch et al., 2009). To
implement DLM in a smart grid, it is necessary to
introduce highly flexible monitoring and information
systems that are able to monitor and rapidly process
the huge amounts of data from advanced metering in-
frastructure (AMI) and external sources. To provide
the necessary decision making capability to automat-
ically trigger load shifting, complex relations in the
produced data must be analysed. Many modern in-
formation systems are capable of handling these data
volumes quite well. Yet, there is usually a trade off
between two aspects:
• the capability to monitor and process big data
amounts in near real time, and
• the amount of flexibility in performing complex
analytical tasks.
One approaches that allows for a partial reconcilia-
tion of these two aspects is complex event processing
(CEP). It allows for monitoring and rapidly analysing
Big Data streams. Yet, to ensure scalability, the con-
ventional CEP processing model requires the incom-
ing event streams to be pre-partitioned. The static
pre-partitioning limits the flexibility of the approach
in analysing complex relationships in the data, since
data streams can only be related to each other if they
share the same partition. This can pose a problem for
DLM solutions that rely on highly dynamic and com-
plex patterns for grid state estimation. To overcome
this problem, we propose an extension of the conven-
tional CEP framework which we call dynamic com-
plex event processing (DCEP) framework. It adds a
76
Wilke G., Schaaf M., Bunn E., Mikkola T., Ryter R., Wache H. and Grivas S..
Intelligent Dynamic Load Management Based on Solar Panel Monitoring.
DOI: 10.5220/0004847300760081
In Proceedings of the 3rd International Conference on Smart Grids and Green IT Systems (SMARTGREENS-2014), pages 76-81
ISBN: 978-989-758-025-3
Copyright
c
2014 SCITEPRESS (Science and Technology Publications, Lda.)

situation specific dynamic partition to the static CEP
partitions. We outline the proposed DCEP framework
by applying it to one of the use cases identified in the
EUROSTARS project DYNE
1
. Here, we consider the
issue of increased voltage variations along branches
of the distribution grid, which stem from the stochas-
tic infeed of decentralized PVs. The voltage varia-
tions can be balanced with DLM if intraday PV pro-
duction forecasts can be provided. Since they depend
on fast changing weather conditions such as moving
clouds, these patterns must be analysed to estimate
the grid state, and we show that they usually break
with any static partitioning of sensor measurement
streams.
The paper is structured as follows: Section 2
briefly outlines similar approaches to dealing with big
data in DLM applications. Section 3 describes the ref-
erence use case that is used as a running example in
the remainder of the paper. The processing model of
the DCEP framework is described in detail in section
4. The paper ends with conclusions and an outline of
future work.
2 APPROACHES TO HANDLING
BIG SMART GRID DATA
The highly dynamical nature of the power grid, the
proliferation of distributed generation (DG), and the
massive amounts of measurement data available in
a smart grid pose considerable challenges to DLM
processing. This holds in particular for DLM appli-
cations that aim at avoiding switching off DG units
when the frequency or voltage deviation in the grid
exceeds the allowable threshold, cf., e.g., (Lu and
Hammerstrom, 2006). To meet these challenges,
DLM algorithms often use demand prediction to esti-
mate future grid states. Yet, accuracy of estimations
is limited, since short-term forecasting of PV produc-
tion curves is usually omitted due to the stochastic
nature of the infeed. Many DLM models employ dif-
ferential equations and optimization functions that re-
quire significant time to be solved numerically. As
a consequence, grid state estimations can be updated
only in intervals of several minutes (insetad of several
seconds), and the according load management opera-
tions operate at a similar level of detail. E.g., (Koch
et al., 2010) employ a Model Predictive Control strat-
egy to operate controllable thermal household appli-
ances for minimizing the “balance error” of a group
of end customers at distribution grid level. In this
case, a 15-minute update cycle leaves enough time to
1
www.project-dyne.eu
pre-calculate the estimated grid state. As another ex-
ample, (Ringwood et al., 2001) use neural networks
for peak demand prediction, but the level of detail ac-
quired omits other cardinal points of the load curves
such as valleys, which are necessary for short time-
scale dynamic load management.
In order to allow near-real-time DLM operations
that operate at a higher level of detail, the accuracy
of grid state estimation must be increased. This can
be done by complementing the above mentioned de-
mand forecast approaches with short time scale pro-
duction forecasts, and we address this challenge in
our reference use case, cf. section 3. To achieve this
goal, the computing performance of DLM solutions
must be increased. As of today, only few approaches
exist that address the problem, and they mostly do
not directly address DLM. E.g., (Yin et al., 2011)
propose a scalable and reliable middleware layer for
real time data management in smart grids. The pro-
posed software is tailored to smart grid requirements
and thereby eliminates overheads of other data mid-
dleware such as latencies and unpredictable perfor-
mance stemming from e.g. the use of generalized
APIs. Yet, the software has not been tested with DLM
applications. Another approach is given by (Huang
and Nieplocha, 2008) who propose a parallelization
approach with high performance computing (HPC).
Unlike these solutions, the proposed DCEP approach
does not rely on costly HPC hardware. We increase
the computing efficiency by separating simple pattern
matching tasks (that can operate rapidly on Big Data
using conventional CEP) from dynamically changing
complex analysis tasks that only required a small por-
tion of the overall data stream for their deductions.
3 USE CASE SCENARIO
The introduction of decentralized energy production
causes increased variability of the voltage level along
distribution lines at the lowest grid layer, and, as a
result, the voltage level sometimes exceeds the maxi-
mum allowable threshold (Vovos et al., 2007), cf. Fig-
ure 1.
This problem can be solved by switching off gen-
erators when the threshold is met, by increasing the
capacity of power lines, or by installing distribution
grid transformers that are switchable on load. Our
reference use case addresses the latter scenario: here,
DLM peak shaving can be used to avoid unnecessary
switching operations of the adjustable transformer,
switching being costly and reducing equipment life
span.
Figure 1A) illustrates the problem of increased
IntelligentDynamicLoadManagementBasedonSolarPanelMonitoring
77
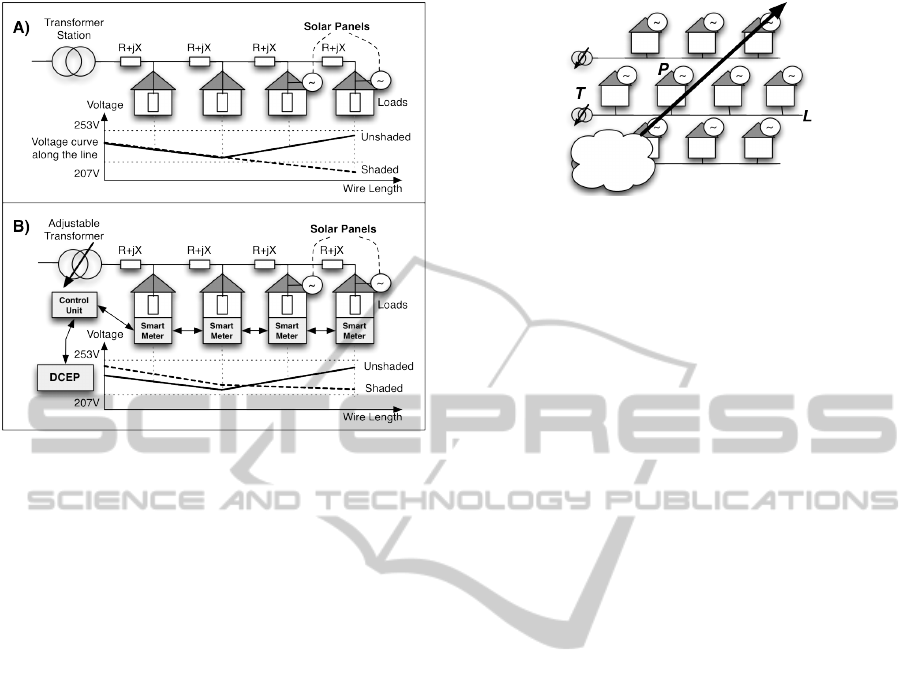
Figure 1: Increased variability of voltage levels caused by
PV infeed, A) with conventional transformers, B) with ad-
justable transformers.
variability of the voltage level when conventional
transformers are used. In rural areas, distribution
power lines are often connected to the grid by only
one feeder. If additional decentralized PV units are
connected to such power lines, the voltage level pro-
gression along a line depends not only on the power
consumption of the households, but also on the PVs’
power production. The figure shows the voltage level
progression along a power line in times of high power
consumption. The continuous line depicts the volt-
age curve when the PVs production is average. In or-
der to account for the additional PV infeed, the trans-
former’s level of infeed is lower than normal, and cho-
sen so that the resulting (continuous) voltage curve is
well within the tolerance band of 230 ± 23V. In con-
trast, the dotted line depicts the voltage curve when
PVs production is low, e.g., at nighttime or when PVs
are shaded by fog or passing clouds. In this case, PVs
do not add to the voltage level. Since the infeed level
is low and can not be changed, the dotted curve falls
below the lower threshold of 207V. Choosing a higher
infeed level does not solve the problem, since the con-
tinuous voltage curve would exceed the upper thresh-
old of 253V.
Figure1B) illustrates the situation when adjustable
transformers are used. Here, the infeed level can be
changed on load. Whenever PV production is low,
smart metering devices at the households measure a
drop in the voltage level, and report it to the au-
tonomous management unit of the adjustable trans-
former, which steps up the infeed level. The dot-
ted line shows that the resulting voltage curve stays
Figure 2: Use case scenario.
within the tolerance band.
DLM can be used to in order to avoid unneces-
sary switching operations that are, e.g., caused by fast
travelling clouds, cf. Figure 2. As a cloud passes over
a PV P installed along the power line L, it temporar-
iliy casts a shadow on P and causes the transformer T
to switch the infeed level up and then down againg in
fast succession. Whenever the time span in question
is less than than 30 minutes, DLM is well suited to
temporarily shift or reduce consumer loads on house-
hold level, e.g., by delaying the charging of electric
vehicles or by temporarily interrupting the operation
of heat pumps, cf., e.g., (Koch et al., 2009).
Yet, the intervals between switching operations
are often much smaller, and DLM algorithms must
react quickly. To provide the required rapid reaction
time, DLM algorithms must include short-term de-
mand and production forecasts. Our use case focuses
on predicting sudden drops in PV production that are
caused by traveling clouds in areas of high PV den-
sity. Here, smart meter readings of neighbouring PVs
can be used to estimate a cloud’s trajectory, which in
turn can be used to predict the time and duration of
shading of a given PV, cf. Figure 2.
Complex Event Processing (CEP) is a scal-
able method for analysing and combining Big Data
streams from multiple sources to infer events or pat-
terns that suggest more complicated circumstances.
Its goal is to identify and track meaningful events
and respond to them as quickly as possible. It hence
provides the capability to process and analyze big
data amounts in near real time, and this is a nec-
essary requirement to implement the cloud tracking
task described above. Unfortunately, CEP does not
provide sufficient flexibility to indeed implement the
task, since CEP requires the overall event stream to be
partitioned in advance to ensure the scalability of the
approach. The partitions can not be changed during
processing, and complex patterns can only be recog-
nized if they are composed of event streams of the
same partition. As a consequence, cloud tracking can
not be implemented with conventional CEP.
To see this, consider Figure 3, which sketches a
sensor field consisting of PV units, partitioneded into
SMARTGREENS2014-3rdInternationalConferenceonSmartGridsandGreenITSystems
78

Figure 3: Fiexed partitions prevent cloud tracking.
four squares. A cloud that is traveling above the
PV field may have an arbitrary trajectory that poten-
tially crosses the boundaries of any predefined parti-
tion along its way. E.g., as shown in the figure, the
cloud may occlude parts of all four partitions of the
sensor field at a given point in time. In this case, the
CEP platform can not recognize the cloud as one in-
tegral object, but instead recognizes four different ob-
jects, one in each of the four partitions. This would
not a problem per se, if the trajectories of the four
“cloud parts” could be calculated to estimate their fu-
ture movements. Unfortunately, this is not the case:
when trying to derive an object’s trajectory, a tracking
algorithm must consider changes of sensor readings in
the object’s neighbourhood. This is not always possi-
ble, since the neighbourhood of a cloud part overlaps
with another partition, preventing the algorithm from
analyzing its movement.
4 PROCESSING MODEL AND
PROTOTYPE ARCHITECTURE
In order to address the problem of prepartitioning in
conventional CEP architectures, we extend it with
the possibility of instantiating dynamically chang-
ing partitions. We refer to such a dynamic parti-
tion as a focus area, and the processing tasks per-
formed within are referred to as focused processing.
Our focused processing framework consists of three
phases: The situation indication phase is based on
normal CEP stream processing; the focused process-
ing initialization phase determines the selection of
data streams necessary for a given complex analysis
task (e.g., cloud recognition and tracking); finally, the
focused processing phase performs the the dynami-
cally changing and computationally intensive analy-
sis tasks in a separate processing environment that
is decoupled from the normal CEP processing with
its fixed pre-partitioning. The prototype architecture
has been developed in a cooperation of the University
of Applied Sciences and Arts Northwestern Switzer-
land (FHNW) and the Finnish technology company
Figure 4: DCEP Architecture Overview.
BaseN
2
as part of the DYNE project. BaseN’s real-
time monitoring and stream processing platform pro-
vides built-in components for preprocessing the raw
event stream data from PV measurements. The pre-
processing includes semantic enrichment with con-
text information such as measurement units and de-
vice parameters, as well as filters for statistical evalua-
tion and data concentration. In particular, data quality
issues such as noisy PV measurement data, varying
latencies and packet loss observed in smart metering
systems can already be partially dealt with in the pre-
processing step.
The processing system architecture defines several
loosely coupled components that can be deployed on
multiple computers to allow for basic scalability (Fig-
ure 4). The main components are defined as follows:
The DCEP Manager acts as an overseer of compo-
nents that manages the life cycle of the specified use
cases including the initial situation monitoring setup
and the coordination of the focused processing. The
Continuous Processor is configured by the DCEP
Manager to continuously monitor for use case spe-
cific situation indicators in the incoming event data.
The event data is provided by the Data Stream Man-
ager which allows each component to subscribe itself
to event streams provided by the BaseN Monitoring
platform. A specialized adapter component mediates
between the BaseN communication system and our
DCEP system. If an indicator for a complex situation
of interest is detected during normal CEP processing,
the DCEP Manager is notified, which configures the
Focused Processor component to initialize a new fo-
cused processing and to subscribe to the required data
streams. Both processing components, the continu-
ous and the focused processing, are intended to be in-
stantiated multiple times on several computers to pro-
vide scalability. The resource provisioning of the in-
frastructure is handled by the BaseN Platform and is
similar to a typical cloud infrastructure as a service
offering. To support the processing tasks with addi-
tional domain specific knowledge, the Relationship
Manager provides access to a specialized knowledge
2
https://www.basen.net/
IntelligentDynamicLoadManagementBasedonSolarPanelMonitoring
79

base specified by a RDF schema.
To illustrate the focused processing mechanism,
we outline the processing flow for a cloud tracking
use case in simplified form.
Identifying relevant event streams. For every
use case, a processing model specific representation
of the use case is provided: the so-called use case tem-
plate. It refers to domain specific background knowl-
edge that is available through the relationship man-
ager. Since not all event streams are relevant for ev-
ery use case, the knowledge contained in the use case
template is used to query the relationship manager for
relevant data streams. For each of the single event
streams contained in the result set, the situation in-
dication is initialized as a normal processing task by
the DCEP Manager. In our example use case, relevant
event stream sources are the PV sensors. The query is
specified in SPARQL:
PREFIX :< h t t p : / / www. w3 . o rg / 2 0 0 0 / 0 1
r df −schema #>
PREFIX r d f :< h t t p : / / www. w3 . org / 1 9 9 9 /
02/22 − r d f −s yn t ax −n s #>
PREFIX s g :< h t t p : / / p r o j e c t −dyne . eu /
s m a r t g r i d #>
s e l e c t d i s t i n c t ? s t r e a m i d where
{? s t r e a m i d r d f : t y p e sg : s o l a r P a n e l }
Situation Indication Phase. The use case tem-
plate provides a set of rules that defines an indication
of the possible occurrence of a situation of interest.
It is evaluated against each of the relevant individual
event streams. In our example use case, a sudden pro-
duction drop in a single PV sensor can serve as an
indicator that it may be shaded by a cloud. The indi-
cation rule is specified in the event stream processing
language used by the JBoss Drools Fusion engine
3
:
pa c ka ge eu . p r o j e c t −dyne ;
i m p o r t eu . p r o j e c t −dyne . Measure ment ;
d e c l a r e Measur em ent
@role ( e v e n t )
end
r u l e ” Pr o d u c t io n D r o p ”
d i a l e c t ” mvel ”
when
Number ( $avg : d o u bl e V al u e )
from a c c u m ul a t e (
Measur ement ( $ v a l : v al u e , v a lu e >0)
o ve r window : t i me ( 1m)
from e n t r y −p o i n t
” d a t a s t r e a m 0 ” ,
a v e r a g e ( $ v a l ) )
Number ( $avg <30)
3
Ref to JBoss hp
t h e n
/ / t r i g g e r s i t u a t i o n
end
Focused Processing Initialization Phase. Once a
situation indication rule fires , the DCEP Manager is
informed so it can determine an initial focus area for
a focused processing instance. To do this, a SPARQL
query to the Relationship Manager retrieves a set of
single event stream identifiers to be monitored in the
beginning of the focused processing stage. In the ex-
ample, the focus area consists of all PV sensor event
streams that are in the immediate neighbourhood of
the event stream that triggered the indication rule, cf.
Figure 3. The exact query would exceed the size of
this paper. It is of a similar structure as the previous
SPARQL query and uses the additional WGS84 Geo
Positioning vocabulary
4
. To avoid reduntant instanti-
ations of processes in the focused processing phase,
the DCEP Manager checks if the retrieved focus area
coincides with other focus areas of already instanti-
ated focused processing tasks. If so, the process is
aborted. Otherwise the DCEP Manager instantiates a
new focused processing instance.
Focused Processing. An algorithm is specified
that performs the actual focused processing. Since we
consider highly dynamical problems that can not be
solved with the conventional CEP pre-partitioning of
the event stream, the focus area is expected to change
dynamically over time during focused processing. To
account for this fact, the algorithm is designed as
an iterative process that allows for the adaptation of
the focus area after each iteration step. Furthermore,
it generates external notifications after each iteration
steps and checks for termination criteria. In the ex-
ample, the focused processing algorithm tries to de-
termine the border of a cloud by looking at the mea-
surement streams within the focus area. In case a co-
herent shape can not be found, the focused processing
is terminated. Otherwise the generated shape is val-
idated against background knowledge to distinguish
it from other patterns such as fog or malfunction of
PVs. If the shape’s distance from the focus area bor-
der falls below a threshold, the focus are must be up-
dated, i.e., moved and/or extended such that the iden-
tified shape has sufficient padding. The DCEP Man-
ager is informed about the update and again checks
for redundancies. Each processing iteration produces
as its result the current shape of the cloud which is
published within the DYNE system to be usable by
other DLM components, such as a forecasting service
that predicts the PV production curves.
4
http://www.w3.org/2003/01/geo/wgs84 pos
SMARTGREENS2014-3rdInternationalConferenceonSmartGridsandGreenITSystems
80

5 CONCLUSIONS AND NEXT
STEPS
The extension of the conventinal CEP architecture by
decoupled dynamic partitions overcomes the problem
of limited flexibility due to pre-partitioning. It thereby
allows for applying the proposed DCEP approach to
highly dynamic and high volume DLM scenarios. By
seperating simple CEP pattern matching tasks from
dynamically changing complex analysis tasks, we in-
crease the computing efficiency of DLM processing.
In a next step, the prototypical realization of the
DCEP architecture will be evaluated using several
data sets of AMI data from a smart grid test field
in northwestern Switzerland. The provided PV mea-
surement data will be combined with simulated cloud
movement data, based on empirically tested assump-
tions about the signal behaviour of the PV devices
under the effect of cloud shading. Existing studies
show that PV arrays under partially shaded conditions
exhibit characteristic signal patterns, cf., e.g., (Ve-
muru et al., 2012). These signal characteristics can be
used for cloud recognition when combined with back-
ground domain knowledge on typical cloud shapes,
shape change, movement patterns and the geographic
charactersitics of PV locations that influence the shad-
ing patterns. Other challenges that must be addressed
in the generalized DCEP framework design such as
the fuzzy matching of time lags between situations
of interest will be addressed in future work, cf. also
(Schaaf, 2013).
ACKNOWLEDGEMENTS
Parts of the work presented here were done under Eu-
rostars Project E!7377.
REFERENCES
Dam, Q., Mohagheghi, S., and Stoupis, J. (2008). Intelli-
gent demand response scheme for customer side load
management. In Energy 2030 Conference, 2008. EN-
ERGY 2008. IEEE, pages 1–7.
Huang, Z. and Nieplocha, J. (2008). Transforming power
grid operations via high performance computing. In
Power and Energy Society General Meeting - Con-
version and Delivery of Electrical Energy in the 21st
Century, 2008 IEEE, pages 1–8.
Koch, S., Barcenas, F. S., and Andersson, G. (2010). Using
controllable thermal household appliances for wind
forecast error reduction. In Ferrera, P. M., editor, IFAC
Conference on Control Methodologies and Technol-
ogy for Energy Efficiency, volume 1, pages 261–266.
IFAC.
Koch, S., Meier, D., Zima, M., Wiederkehr, M., and Ander-
sson, G. (2009). An active coordination approach for
thermal household appliances - local communication
and calculation tasks in the household. In PowerTech,
2009 IEEE Bucharest, pages 1–8.
Lu, N. and Hammerstrom, D. (2006). Design considerations
for frequency responsive grid friendlytm appliances.
In Transmission and Distribution Conference and Ex-
hibition, 2005/2006 IEEE PES, pages 647–652.
Molderink, A., Bakker, V., Bosman, M. G. C., Hurink, J.,
and Smit, G. J. M. (2010). Management and control
of domestic smart grid technology. Smart Grid, IEEE
Transactions on, 1(2):109–119.
Ringwood, J. V., Bofelli, D., and Murray, F. T. (2001). Fore-
casting electricity demand on short, medium and long
time scales using neural networks. J. Intell. Robotics
Syst., 31(1-3):129–147.
Schaaf, M. (2013). Event processing with dynamically
changing focus. To be published in the Proceedings
of the Seventh IEEE International Conference on Re-
searcg Challenges in Information Science 2013 (RCIS
2013).
Vemuru, S., Singh, P., and Niamat, M. (2012). Anal-
ysis of photovoltaic array with reconfigurable mod-
ules under partial shading. In Photovoltaic Specialists
Conference (PVSC), 2012 38th IEEE, pages 001437–
001441.
Vovos, P., Kiprakis, A., Wallace, A., and Harrison, G.
(2007). Centralized and distributed voltage control:
Impact on distributed generation penetration. Power
Systems, IEEE Transactions on, 22(1):476–483.
Yin, J., Kulkarni, A., Purohit, S., Gorton, I., and Akyol, B.
(2011). Scalable real time data management for smart
grid. In Proceedings of the Middleware 2011 Industry
Track Workshop, Middleware ’11, pages 1:1–1:6, New
York, NY, USA. ACM.
IntelligentDynamicLoadManagementBasedonSolarPanelMonitoring
81
