
Cross-analysis of Transversal Competences in Project Management
Ana González-Marcos
1
, Fernando Alba-Elías
1
, Joaquín Ordieres-Meré
2
and Fermín Navaridas-Nalda
3
1
Department of Mechanical Engineering, Universidad de La Rioja, c/ Luis de Ulloa 20, 26004 Logroño, La Rioja, Spain
2
PMQ Research Group, ETSII, Universidad Politécnica de Madrid, José Gutiérrrez Abascal 2, 28006 Madrid, Spain
3
Department of Education Sciences, Universidad de La Rioja, c/ Luis de Ulloa 8, 26004 Logroño, La Rioja, Spain
Keywords: Project Management, Transversal Competences, Competence Assessment.
Abstract: This paper presents a framework for project management competence assessment based on participant’s
performance and contribution in a simulated environment. The proposed framework considers competence
assessment through evidences and the participation of different roles. The system enforces the assessment of
individual competences by means of a set of performance indicators. A specific case study is presented and
the relationship between exhibited transversal competences and project quality is analysed.
1 INTRODUCTION
The European space for higher education is
immersed in a substantial transformation process of
the organizational, pedagogical and methodological
aspects of knowledge transmission (Council of the
European Union, 2004). In this changing context,
the new educational model focuses on learning and
competences’ development.
In a constantly changing society, the demands
faced by an individual vary from one situation to
another and from time to time. Therefore, in addition
to possessing the specific basic skills for
accomplishing a certain task, more flexible, generic
and transferable competences are needed to provide
the individual with a combination of skills,
knowledge and attitudes that are appropriate to
particular situations (European Commision, 2004).
In this new higher education conception, the
instructor’s role shifts from transmitting knowledge
to students to facilitate and guide their learning
process (Beltrán, 1999; Navaridas, 2004). Thus, the
teaching process must be organized in a more
learner-centered approach than classical lectures
offer.
This work presents a teaching framework that
aims to stimulate the learning of both technical and
human skills in project management. More
specifically, this study concentrates on the
relationship observed between four transversal
competences –teamwork, leadership, motivation and
results orientation- and the final project success.
The structure of the remaining part of the paper is as
follows. Section 2 presents a brief review on related
works. Section 3 provides an overview of the
learning experience and section 4 is dedicated to
present and discuss the relationships observed
between the four analysed competences and the final
project quality. Finally, the last section discusses
some general conclusions and presents future work.
2 BACKGROUND
Competences in project management are correlated
to performance on the job and can be confronted
against well-accepted standards and improved via
training and other development activities. The
underlying assumption is that a competency can be
broken down into dimensions of competence, as
Project Management Competency Development
(PMCD) Framework does. In this framework,
considered dimensions are Knowledge, Personal and
Performance (PMI, 2002). Furthermore, the
International Project Management Association
(IPMA) created the International Competence
Baseline (ICB) consisting of 46 elements for
knowledge and experience as well as personal
attitudes and abilities for general impression (IPMA,
2006). In addition, the Association for Project
Management (APM) developed the APM
Competence Framework providing the technical,
behavioural and contextual competence elements
needed for effective project management (APM,
34
González-Marcos A., Alba-Elías F., Ordieres-Meré J. and Navaridas-Nalda F..
Cross-analysis of Transversal Competences in Project Management.
DOI: 10.5220/0004847600340041
In Proceedings of the 6th International Conference on Computer Supported Education (CSEDU-2014), pages 34-41
ISBN: 978-989-758-021-5
Copyright
c
2014 SCITEPRESS (Science and Technology Publications, Lda.)

2008).
Even though human skills –communication,
teamwork, organizational effectiveness, leadership,
flexibility, creativity, etc.– are acknowledged as
important for project management, the education
offered in industrial engineering degrees
concentrates mainly on the control aspects of
projects, i.e., the technical skills. It is recently that
authors have started to discuss how to teach this
discipline in higher education. Thus, Pant and
Baroudi (2008) argue the necessity of a more
balanced approach between technical and human
concepts to enhance project management education.
Clark (2008) discusses the skills required for an
effective project manager, as well as the analysis of
four approaches at the M.Sc. level to develop these
skills. Barron (2005) discusses the difficulty of
learning effective project management skills and
suggests that there is a way to teach project
management through properly designed assessment.
In the same way, Sense (2007) emphasizes that
project learning and the learning of behaviours that
will lead to success are most appropriately pursued
through the creation of a suitable environment.
The teaching and learning of project
management has grown in interest and popularity
(Berggren and Söderlund, 2008; Ojiako et al., 2011;
Reif and Mitri, 2005) and there are some practical
approaches to the teaching of project management.
For instance, Abernethy et al. (2007) describe a
specific experimental approach for information
technology students. Authors argue that project
activities must mirror the real world for information
technology students to learn what needs to be done
in industry projects. More recently, Crespo et al.
(2011) advocated a combination of theoretical
content, individual applied tasks, use of software
systems and a strategy of learning by doing in
teaching project management. They formally
introduce negotiating and virtual team management
aspects to different teams from different universities
in different locations.
3 METHODOLOGY AND
IMPLEMENTATION
The Project and Portfolio Management Learning
(P2ML) framework presented in this work is based
on the experiential learning theory, i.e., learning
through action. The following is a list of the main
characteristics of the proposed model:
Students are involved in real-world
engineering projects, which provides
authenticity and require students to use
academic and technical knowledge.
Students are forced to adopt a more active role
since they are the ones who must develop a
project within given time and specifications.
Acquisition of teamwork abilities and human
skills, such as leadership, communication or
negotiation, are promoted.
Professional skills that should be deployed by
a project manager are implemented in scale.
In terms of the selected method for project
management, it was adopted PRINCE2
TM
(Projects
IN a Controlled Environment) (Office of
Government Commerce, 2009) as far as it is simple,
product oriented and easier to understand for
students without any previous experience in neither
projects nor project management.
The use of PRINCE2
TM
, even for academic
purposes is not new, as it has been frequently
reported (Hewagamage and Hewagamage, 2011;
Zhang et al., 2012). Authors preferred it instead of
the most common standard from the Project
Management Institute (PMI) –Project Management
Body of Knowledge, PMBoK (PMI, 2008)- because
of the students’ lack of previous experience. After
initial experiences (Ordieres et al., 2011), teachers
found that keeping the focus at the products to be
developed, instead of using an effort oriented
methodology help the most to the learning process,
as students always look at product level.
According to the chosen method a multiphase
lifecycle is accomplished. The meaning for all the
stages established by PRINCE2
TM
is learnt during
the first three weeks of the course.
For the student’s learning process, it is necessary
to make clear the difference between the different
roles of persons who work together on the same
project, but with very different responsibilities. In
order to do this, and because students from different
locations –Universidad Politécnica de Madrid
(UPM) and Universidad de La Rioja (UR)- and
different backgrounds are involved, they are exposed
to different participation experiences by playing
three different roles (all of them are the available
figures in PRINCE2
TM
):
PM: Project Manager, with management
responsibilities. Each project is managed by a
team of seven or eight PM. The number of
students playing the role of PM was
established according to the necessity that all
students perform management tasks. It must
be noted the short length of the course, just
120/150 hours of student’s work (4,8/6 ECTS
Cross-analysisofTransversalCompetencesinProjectManagement
35

assigned to the UPM and UR courses,
respectively), which becomes short time
considering the lack of experience of the
students (Warfvinge, 2008).
TMg: Team manager. A PM temporarily
assigned to manage Project Engineers (TM),
to produce what it was described into the
Work Package document (Managing Products
processes).
TM: Team member, with engineering tasks
development responsibilities. Each project is
composed of ten or twelve TM.
The projects provided are basically oriented to
learn about the project management methodology as
well as to develop key competences as they include
reports preparation, video presentation for the
project as a commercial product as well as an
individual presentation much more technical about
their position in the team, the tasks carried out and
their self-assessment as this tool is a beneficial for
the learning process too (Crook et al., 2012). It is
included the drawing preparation if required by the
project topic as well as the formal budget estimation,
not only for the project itself but also for its
implementation.
The authors have chosen the IPMA-ICB
framework (IPMA, 2006) as a reference model for
competences in project management because of its
flexibility and the taxonomy provided. IPMA (2006)
defines the four competences studied in this work as
follows:
Leadership involves providing direction and
motivating others in their role or task to fulfill
the project’s objectives.
Engagement & Motivation. Engagement is the
personal buy-in from the project manager
(PM) to the project and from the people inside
and associated with the project and
motivation. Motivation of the project team
depends on how well the individuals bond
together and their ability to deal with both the
high and low points of the project.
Results Orientation means to focus the team’s
attention on key objectives to obtain the
optimum outcome for all the parties involved.
The PM has to ensure that the project results
satisfy the relevant interested parties. To
deliver the results required by the relevant
interested parties, the PM has to find out what
the different participants in the project would
like to get out of it for themselves. This
competence in project management behaviour
is closely linked to project success
Teamwork covers the management and
leadership of team building, operating in
teams and group dynamics.
In order to support learning and monitoring,
information and communication technology (ICT)
tools were used. The provided ICT environment was
built by integrating some open source tools as it is
described in González-Marcos et al (2013).
Moreover, specific procedures about how to operate,
how to do things, how to communicate mandatory
information etc., have been developed and learning
them as well as the use of the ICT system is the goal
of the first module for the course, in parallel with
learning about PRINCE2
TM
.
Subsequently, students will develop a direct
relationship between PRINCE2
TM
theory and
operational procedure. This module consumes three
weeks and the last activity is an individual
assessment that is used as evidence for Project
Management Information Systems ability and
theoretical knowledge about the method of
management.
During the period where the project is being
developed, students realize how complex the project
management becomes because different effects such
as contradictions found between stakeholders,
misunderstandings, time pressure, particular
motivations, or lack of attention to details. Along
this period the students are still learning theoretical
concepts for the document structure to be delivered,
legal responsibilities, as well as specific techniques
useful in daily work. This procedure also shows how
increasing complexity and uncertainty call for a
more comprehensive inclusion of managerial and
leadership knowledge respective to our teaching of
advanced project management (Thomas and Mengel,
2008).
Obviously, most of the work needs to be carried
out by groups or teams; however, it is based on
individual knowledge. Sometimes this individual
knowledge is improved because of the discussions
about how to perform the work. Thus, students are
responsible for their learning as well as the learning
of others (Hughes, 2012).
Evaluating the learning process is an essential
issue not only for students but also for teachers as
they are responsible for the learning process.
Unfortunately, there is no agreement on how to
integrate different dimensions of learning,
knowledge, skills, etc. (Huang & Yang, 2009).
Therefore, authors have incorporated two different
assessment methods. The first one is a formal
knowledge based set of test in different period of
time. The second one is a continuous assessment
CSEDU2014-6thInternationalConferenceonComputerSupportedEducation
36

oriented to estimate the project management
performance and the contribution of each student to
it (Qureshi et al., 2009). This project performance is
based on the auditing processes carried out by the
Project Board and the Owner’s representatives (the
teachers) as well as on the competence level gained
during the daily work performed.
The auditing process has two different branches.
The first one is automatically performed by a web
tool developed by the authors. This application
collects real-time information about project and
students’ progress on the Enterprise Program
Management Office (ePMO) software used during
the simulation. It gathers relevant information about
each student’s performance in their project activities
(project planning activities, documents uploaded,
effort allocation, use of the provided communication
tools –blog, discussions, etc.). It also looks for
measurable mistakes, such as the absence of
relationships between tasks, the absence of links
between documents and deliverables, improper
effort allocations, wrong document codifications,
etc. Thus, instructors are able to make periodic
reports to better identify mistakes or inappropriate
behaviours. In this way, the teachers can more
objectively and efficiently monitor and evaluate
students continuously throughout the whole course.
Furthermore, students were given the right to order
an on-line self-audit based on the aforementioned
automatic checks.
The second branch asks for a more qualitative
but still evidence-based opinion about the products
being produced as well as about how the different
PRINCE2’s themes –risk, communication, quality
and configuration- are being managed by the team.
To determine the exhibited competence level the
answers to different questions are gathered from
different forms about products, processes and
behaviours. Most of them are Likert scale based and
opinions come not only from the producer of the
product or responsible for the process
implementation but also from different consumers of
those products or participants in the process.
The numeric assessment of the different
evidences considered as relevant to each competence
is carried out after considering, at least, four
different roles:
The self-assessment, as it is always a relevant
perception.
The auditor
The owner of the product being developed
User(s) of this particular configuration item or
product.
Thus, the competence assessment framework
uses some kind of 360-degree overview to different
activities inside the project and it collects all these
evidences in a weighted integration.
4 RESULTS AND DISCUSSION
Students from two different universities (UR and
UPM) were organized around eight projects (1301 to
1308). Each project was composed of seven or eight
PM and ten to twelve TM. At the end of the course,
more than 450 assessment forms were filled out.
The first step in any multivariate analysis is to
graphically represent the individual variables using a
histogram or boxplot. These graphic representations
are extremely useful for detecting asymmetries,
heterogeneity, outliers, etc.
In order to observe differences between
perceived PM competences within each project,
boxplots were used because they are a way of
summarizing a distribution, take up less space than
other graphical techniques and they are a quick way
of examining one or more sets of data graphically
(see Figure 1). The spacings between the different
parts of the box help indicate the degree of
dispersion (spread) and skewness in the data. A
boxplot (also known as a box and whisker plot) is
interpreted as follows:
The box itself contains the middle 50% of the
data. The left edge (hinge) of the box indicates
the 75th percentile of the data set, and the right
hinge indicates the 25th percentile. The range of
the middle two quartiles is known as the inter-
quartile range.
The dot in the box indicates the median value of
the data.
The ends of the horizontal lines or "whiskers"
indicate the minimum and maximum data values,
unless outliers are present in which case the
whiskers extend to a maximum of 1.5 times the
inter-quartile range.
The points outside the ends of the whiskers are
outliers or suspected outliers.
Comparing the boxplots across groups, a simple
summary is to say that the box area for one group is
higher or lower than that for another group. To the
extent that the boxes do not overlap, the groups are
quite different from one another.
Distributions shown in Figure 1 illustrate the
different opinion that each team project had about
the exhibited competences of their PMs. Thus, for
instance, PM team of project 1302 obtained opinions
varying from ‘strongly disagreement’ (Likert scale
Cross-analysisofTransversalCompetencesinProjectManagement
37
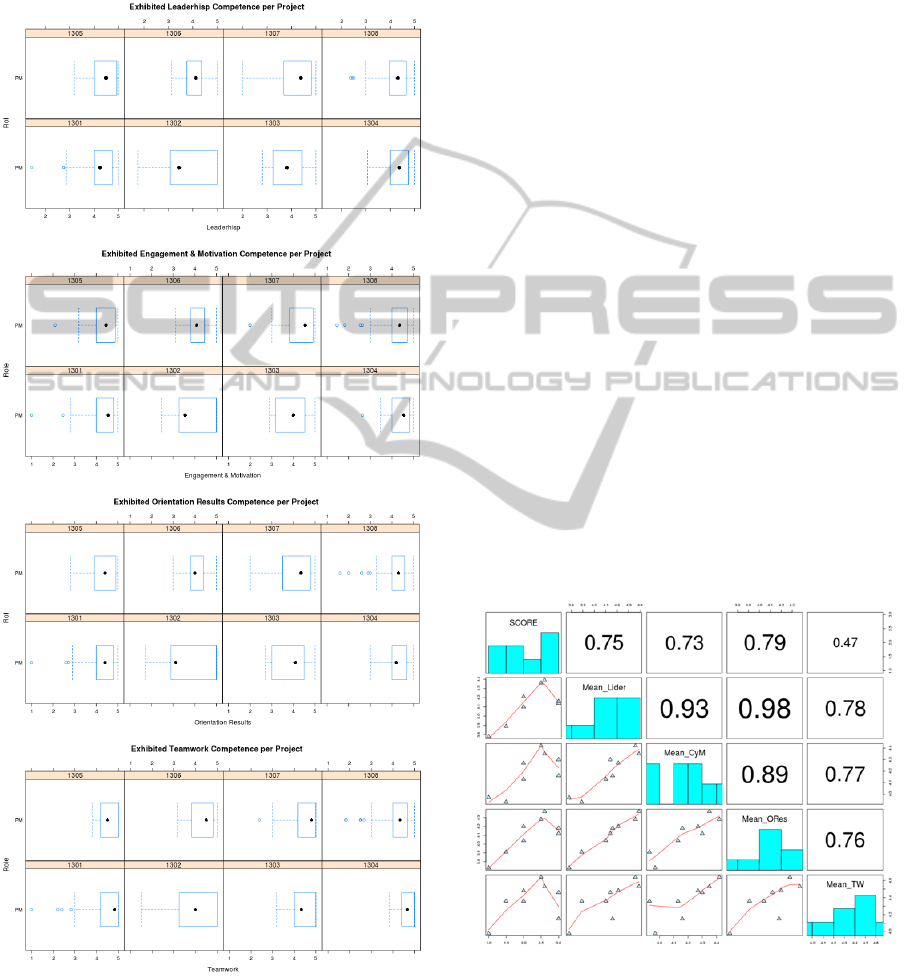
of 1) to ‘strongly agreement’ (Likert scale of 5),
whereas the other project teams introduced better
opinions on the competence level of their PMs (from
‘neither agree nor disagree’ –Likert scale of 3- to
‘strongly agreement’, with some exceptions).
Figure 1: Competence assessment results per project.
In general, teamwork (Figure 1, bottom) was the
competence with better assessments. In this case,
projects 1304 and 1305 exhibited the lowest
dispersions with highest assessments (between 3.8
and 5), whereas project 1302 had the highest
variability in the assessments (between 1.4 and 5).
It is worth to mention that the other three
competences analysed (leadership, engagement &
motivation and results orientation) had very similar
distributions per project. Since these three
competences were evaluated at the same time by
means of the same survey, it seems that the
evaluation of each person was based on a global
opinion that the assessor had about the assessed
person without making any distinction between
these competences.
The instructors team established the quality of
the project (SCORE) according to the content and
format of both management products (plans,
business case, project reports, etc.) and specialist
products (feasibility studies, engineering drawings,
calculations, etc.). In this case, a 5-point Likert scale
(from 1 for “very bad quality” to 5 for “very good
quality”) was used.
A visual inspection of all possible pairwise
scatterplots in the analysed variables helps to
understand the relationships between the variables.
If these scatterplots are arranged in matrix format,
the type of relationship existing between the pairs of
variables can be understood and the outliers in the
bivariate relationship identified. Such diagrams are
particularly important for identifying non-linear
relationships, in which case the covariant matrix
may not offer a good summary of the dependence
between variables (Peña, 2002).
Figure 2: Relationship between project quality (SCORE)
and transversal competences analysed.
Figure 2 summarizes all this information and
illustrates the relationships between the project
quality (SCORE) of each project and the mean value
of the assessed PM’s transversal competences. The
CSEDU2014-6thInternationalConferenceonComputerSupportedEducation
38
lower triangle of the matrix shows a scatterplot for
each pair of variables with a polynomial
approximation according to their relationship nature;
the histogram of each variable appears on the
diagonal; and the absolute value of the correlations
with a size proportional to their magnitude is
included in the top triangle. From this figure, the
following conclusions can be drawn:
The project quality (SCORE) is positively
correlated with the four transversal competences
analysed (Mean_Lider, Mean_CyM, Mean_Ores
and Mean_TW). However, as it can be seen from
the first column of the matrix, these relationships
are not perfect linear (red line). Although
projects 1304 and 1305 have the highest means
for the four transversal competences (points
located at the top of each scatterplot), projects
1307 and 1308 obtained the highest SCORES
(points located at the right of each scatterplot).
That is, large doses of leadership, engagement &
motivation, results orientation and teamwork are
important to ensure high quality of the project,
but they are not the only relevant variables.
The highest correlation between the project
quality (SCORE) and any of the PM’s
transversal competences analysed is found for
the competence named results orientation
(Mean_ORes). This result is consistent with the
importance that the International Project
Management Association (IPMA) gives to this
competence: results orientation in project
management behaviour is closely linked to
project success (IPMA, 2006). In summary,
higher quality projects were attained by PM
teams that were able to develop project teams
focused on results in changing environments.
Project quality (SCORE) and teamwork
(Mean_TW) have the lowest correlation (0.47).
Although there is a high correlation between the
four transversal competences analysed, the
strongest relationship is found between
leadership (Mean_Lider), engagement &
motivation (Mean_CyM) and results orientation
(Mean_ORes). This result is consistent with our
previous observation related to the evaluation of
these competences through the same survey:
each assessor evaluated these competences to
each person without making any distinction
between.
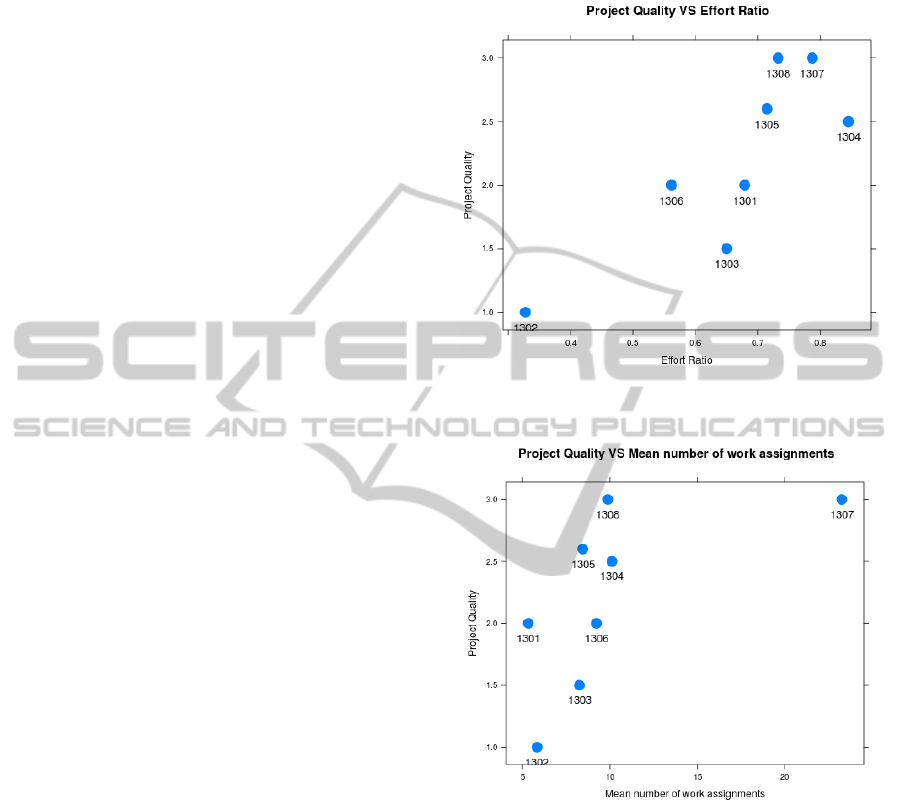
By defining the effort ratio as the relationship
between the total number of hours claimed by the
whole project team and the total number of planned
hours, it is observed a strong correlation (0.83)
between this variable and the project quality (see
Fig. 3). This result suggests that the lower deviations
between planned and actual activity of the project
team, the higher final quality of the project.
Figure 3: Relationship between project quality (SCORE)
and effort ratio.
Figure 4: Relationship between project quality (SCORE)
and results orientation competence.
Fig. 4 illustrates the relationship between the
mean number of work assignments and the final
project quality. In this case, the correlation between
the two variables analysed is lower. That is, a higher
number of work assignments do not necessary mean
a better project quality. For example, although the
number of work assignments defined in the project
1308 was half of the work assignments defined in
the project 1307 both projects had a similar project
quality.
Regarding the teamwork competence (Fig. 5 and
Fig. 6), it is highly related to both the effort ratio
Cross-analysisofTransversalCompetencesinProjectManagement
39
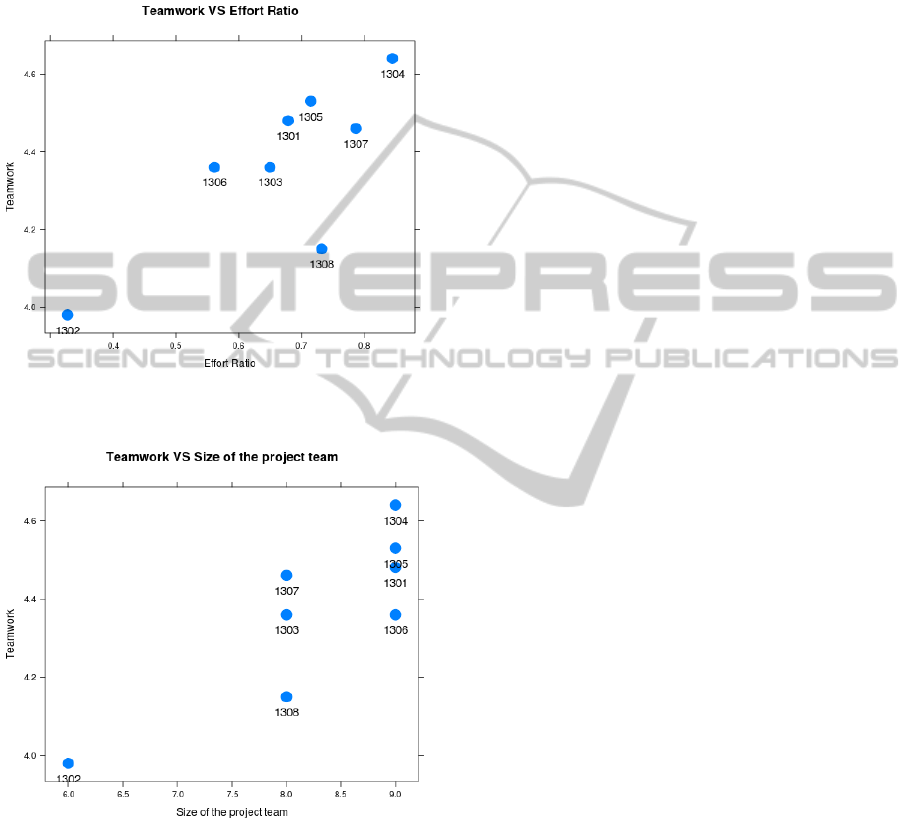
(correlation equal to 0.78) and the size of the project
team (correlation equal to 0.85). These results
illustrate how the teamwork feeling increases as the
estimated effort was close to the actual effort (Fig.
5). The same feeling was identified taking into
account the size of the project team (Fig. 6).
Figure 5: Relationship between teamwork competence and
effort ratio.
Figure 6: Relationship between teamwork competence and
size of the project team.
5 CONCLUSIONS
This paper has presented an integrated framework
that allows competence assessment in project
management by putting it into practice in a
simulation environment. The system is distinguished
by the assessment of individual competences by
means of a set of performance indicators. The
indicators are obtained from both analytical
evidence and the opinions of other participants in the
simulation in relation to the skills demonstrated by
the candidate’s specific actions. Furthermore, the
system allows obtaining information about the level
of demonstrated competences not by the
measurement of individual knowledge, but as the
result of their use in a simulation environment.
An analysis of the PM’s exhibited competences
demonstrated the relationship between some
transversal (‘human’) competences and the project
success. In the academic course analysed, the
strongest relationship was found between results
orientation and project success, whereas teamwork
did not seem to be correlated with the project
quality. The authors attribute the lowest relationship
between teamwork and project success to the lower
number of pieces of evidence used to assess this
competence.
Another interesting result is the strong
relationship found between leadership, engagement
& motivation and results orientation. Taking into
account that these competences were evaluated at
the same time by means of the same form, it seems
that each assessor used a global opinion about the
assessed person to fill out the form. That is, no
distinction between these competences was made.
For the future authors look to improve the
assessment of these competences by using more
pieces of evidence. Furthermore, authors will extend
the number of competences assessed by the
presented framework as well as to use the collected
data for early detection of problems inside the
project, and to improve the learning procedure by
means of the gathered data.
ACKNOWLEDGEMENTS
The authors wish to recognize the support of the
“Vicerrectorado de Profesorado, Planificación e
Innovación Docente” of the University of La Rioja,
through the “Dirección Académica de Formación e
Innovación Docente” as part of this work was
supported by its grant APIDUR 2013.
REFERENCES
Abernethy, K., Piegari, G., Reichgelt, H., 2007. Teaching
project management: an experiential approach,
Journal of Computing Sciences in Colleges, 22(3),
198-205.
CSEDU2014-6thInternationalConferenceonComputerSupportedEducation
40

APM, 2008. APM Competence Framework. Association
for Project Management.
Barron, S., 2005. Assessing project management learning
– how can it make a difference? In 2nd Project
Management Conference: Excellence in Teaching,
Learning and Assessment. Bournemouth, Sep. 15–16.
Beltrán, J. A., 1999. Aprender en la universidad, en Ruiz,
J. (Coord.). Aprender y enseñar en la universidad.
Iniciación a la docencia universitaria. Jaén:
Universidad de Jaén.
Berggren, C., Söderlund, J., 2008. Rethinking project
management education: Social twists and knowledge
co-production. International Journal of Project
Management, 26, 286-296.
Clark, R., 2008. Project Management: The Key to
Engineering Employability. In SEFI - 36th Annual
Conference. Aalborg, Denmark, 2 - 5 July.
Council of the European Union, 2004. “Education and
Training 2010”. The Success of the Lisbon Strategy
Hinges on Urgent Reforms [Online]. Council
document 6905/04 of 03 march 2004. Available:
http://ec.europa.eu/education/policies/2010/doc/jir_co
uncil_final.pdf.
Crespo, E., Alba-Elías, F., González-Marcos, A., Ordieres,
J. and Castejón-Limas, M., 2011. Project management
learning in a collaborative distant learning context –an
actual on-going experience. In 3rd International
Conference on Computer Supported Education, pages
105–110.
Crook, A., Mauchline, A., Maw, S., Lawson, C.,
Drinkwater, R., Lundqvist, K., Orsmond, P., Gomez,
S., Park, J., 2012. The use of video technology for
providing feedback to students: Can it enhance the
feedback experience for staff and students? Computers
and Education, 58 (1), 386-396.
European Commision, 2004. Implementacion of
“Education and Training 2010”. Key Competences
[Online]. Available: http://ec.europa.eu/education/
policies/2010/doc/basicframe.pdf.
González-Marcos, A., Alba-Elías, F. and Ordieres-Meré,
J., 2013. A Web-based Support System for Providing
Effective Monitoring, Feedback and Evaluation in
Project Management Education. In 5th International
Conference on Computer Supported Education, pages
254–257.
Hewagamage, C.; Hewagamage, K., 2011. Redesigned
framework and approach for it project management.
International Journal of Software Engineering and its
Applications, 5 (3), 89–106.
Huang, S., Yang, C., 2009. Designing a semantic bliki
system to support different types of knowledge and
adaptive learning. Computers & Education, 53 (3),
701-712.
Hughes, J., 2012. The role of teacher knowledge and
learning experiences in forming technology-integrated
pedagogy. Journal of Technology and Teacher
Education, 277-302.
IPMA, 2006. ICB: IPMA Competence Baseline. Version
3.0. International Project Management Association.
Navaridas, F., 2004. Estrategias didácticas en el aula
universitaria. Logroño: Universidad de La Rioja.
Office of Government Commerce, 2009. Managing
Successful Projects with PRINCE2
(TM)
. Office Of
Government Commerce.
Ojiako, U., Ashleigh, M., Chipulu, M., Maguire, S., 2011.
Learning and teaching challenges in project
management. International Journal of Project
Management, 29, 268–278.
Ordieres-Meré, J., González-Marcos, A., Alba-Elías, F.,
2011. The use of computers for graduate education in
project management. Improving the integration to the
industry. In the 2011 International Conference on
Frontiers in Education: Computer Science &
Computer Engineering, pages 233–238.
Pant, I., Baroudi, B., 2008. Project management education:
the human skills imperative, International Journal of
Project Management, 26, 124-128.
Peña, D., 2002, Análisis de datos multivariantes. McGraw
Hill.
PMI, 2002. Project Manager Competency Development
(PMCD) Framework. Project Management Institute.
PMI, 2008. A Guide to the Project Management Body of
Knowledge (PMBOK Guide), 4th Edition. Project
Management Institute.
Qureshi, T. M., Warraich, A. S., Hijazi, S. T., 2009.
Significance of project management performance
assessment (PMPA) model. International Journal of
Project Management, 27 (4), 378-388.
Reif, H. L., Mitri, M., 2005. How university professors
teach project management for information systems.
Commun. ACM, 48(8), 134-136.
Sense, A., 2007. Structuring the project environment for
learning, International Journal of Project
Management, 25, 405-412.
Thomas, J., Mengel, T., 2008. Preparing project managers
to deal with complexity –Advanced project
management education. International Journal of
Project Management, 26 (3), 304.
Warfvinge, P., 2008. A generic method for distribution
and transfer of ECTS and other norm-referenced
grades within student cohorts. European Journal of
Engineering Education. 33 (4), 453-462.
Zhang, L., He, J., Zhang, X., 2012. The project
management maturity model and application based on
PRINCE2. Procedia Engineering, 29, 3691–3697.
Cross-analysisofTransversalCompetencesinProjectManagement
41
