
The Strategic Organization of the Observation in a TEL System
Studies and First Formalizations
Mohand Akli Ouali, Sébastien Iksal and Pierre Laforcade
LUNAM Université, 19bis Rue La Noue Bras de Fer, 44200, Nantes, France
Université du Maine, LIUM (Laboratoire d’Informatique de l’Université du Maine),
Avenue Olivier Messiaen, 72085 Le Mans Cedex 9, France
Keywords: Technology Enhanced Learning, Observation, Observation Strategy, Observation Needs, Observation
Dashboard, Visualization of Indicators.
Abstract: The instructional designers may design learning sessions with tools offered by the Technology Enhanced
Learning systems. Any learning situation is designed to follow specific learning objectives. Instructional
designers examine the progress of these situations and evaluate the correlation between their deployment
and the objectives through an observation activity. We present in this article theoretical and practical studies
in order to understand the real needs of instructional designers in organizing their activity of observation.
We also present the concept of Observation Strategy to answer the needs of instructional designers for
organizing the observation of learning sessions deployed in the TEL systems.
1 INTRODUCTION
Our research activities focus on the observation of
learning situations and the perception (such as
visualization) of indicators when using a TEL
system (Technology Enhanced Learning system).
The observation is defined in (De Ketele, 1987) as a
process to gather facts in order to analyze them. It is
based on the processing of data collected during the
deployment of learning situations within the TEL
system.
We originally propose to consider the efficiency
of an observation activity as related to the a priori
definition and formalization of an observation
strategy. This efficiency mainly relies on the
relevance of various choices: the observation means
implemented and/or used, the visual widgets selected
for representing the calculated indicators, and so on.
This article aims at summarizing several
objectives according to the following three points:
To present and analyse the different studies we
have done in order to explicit the needs and
practices of instructional designers when specifying
observations activities;
To define and formalize the concept of observation
strategy;
To illustrate the proposition with a concrete
example from past experiments about the
observation in a TEL environment.
The organization of this paper was planned in
such a way to meet these goals. After this
introductory section, we focus on the observation in
the TEL systems in order to show the actors
concerned by this activity and their objectives
related to the observation of learning situations. In
the same section we present the context in which our
research is carried out to show continuity with the
research activity of our team and to summarize the
goals of our work. In the next section, we discuss the
theoretical and practical studies we have done to
understand the real needs of instructional designers
in terms of using pedagogical indicators. These two
studies, with complementary objectives, respectively
consist of a state of the art about the observation and
perception of indicators and a field investigation to
understand the needs of instructional designers.
Once these needs are identified, we present the
concept of observation strategy which is our answer
for identified needs. The definition of this concept
will be followed by its formalization as a meta-
model. To better illustrate the concept introduced,
we present a case study inspired by an experiment.
The conceptualization of the case study will be in
accordance with the proposed definition and the
meta-model will be used to formalize this case
study. To conclude, we present our current work.
317
Ouali M., Iksal S. and Laforcade P..
The Strategic Organization of the Observation in a TEL System - Studies and First Formalizations.
DOI: 10.5220/0004847703170324
In Proceedings of the 6th International Conference on Computer Supported Education (CSEDU-2014), pages 317-324
ISBN: 978-989-758-020-8
Copyright
c
2014 SCITEPRESS (Science and Technology Publications, Lda.)

2 CONTEXT
2.1 Observation in a TEL System
Any process delivering TEL learning situations
should include a specific phase about observation
and uses analysis in order to notify instructional
designers of the quality of the deployed situation
(Choquet and Iksal, 2007). By interpreting the
results of an observation, teachers, or tutors, can
guide the learning activity by trying to encompass
the potential dysfunctions related to the learning
scenario designed (Settouti and al., 2007). They can
then introduce personalized support and provide
educational materials adapted to the different
learners behaviours. An instructional designer can
also exploit the observation traces and indicators in
order to modify the learning scenario for upcoming
deployments (reengineering). Many researches
propose solutions requiring the intervention of an IT
expert to assist teachers in defining their observation
needs, or in the interpretation of the observation
results (for example in order to improve the initial
learning scenario (Pernin and Lejeune, 2006)). It
could also be interesting to provide learners, during
the learning session, with some specific visual tools
for representing some relevant information about
their progress or knowledge acquisition.
2.2 Current Research Context
Our research activity is part of an editorial chain
supporting the observation within a TEL system
proposed by (Iksal, 2011). In this context, the
instructional designer is considered as the most
appropriate actor to define and specify what is
required to observe during the learning situation.
This leads us to consider the design of the
observation activity as a specific phase into the
global instructional design process. To this aim, the
instructional designer has first to make explicit his
observation needs. Then, the learning scenario can be
analyzed, driven by the observation needs, which are
the description of what to observe, when observing it,
how tracking and calculating it, how representing the
result, for who and for what.
In previous team research works about the
reengineering of TEL systems, we proposed a formal
language for describing pedagogical indicators: the
UTL Language (Using Tracking Language)
(Choquet and Iksal, 2007). It allows the definition of
observation needs, and the specification of indicators
from raw data independently from the language used
for the definition of the related learning scenario and
independently from the tracks formats. Additionally,
we proposed another language (Pham Thi Ngoc,
2011), DCL4UTL (Data Combination Language for
UTL). It is an extension of UTL that adds the ability
to formally specify the automated calculation
methods to get the indicators from the collected
tracks and observation needs previously expressed
using UTL. Thanks to the formalization of indicators,
they can then be reused for other observations; the
DCL4UTL mappings between indicators and tracks
provide designers, for a same TEL system, a reusable
and calculable data.
Our specific research work aims at providing the
actors of a learning system (especially the
instructional designer), with a homogeneous set of
tools for 1/ defining observation strategies, 2/
calculating and displaying observation results with an
ergonomic and intuitive perception interface. These
tools should be used before, during and/or after the
learning session.
3 PRACTICAL AND
THEORETICAL STUDIES
ABOUT OBSERVATION
PRACTICES AND TOOLS
3.1 Practical Study
3.1.1 Presentation of the Survey
In the context of our research, instructional
designers are at the center of the observation
activity. Our goal is to support them when
organizing the observation in a strategic method by
adapting it to their objectives and to the
characteristics of their pedagogical scenarios.
Instructional designers must have the ability to
create observation strategies in order to capitalize
them for sharing and reusing purposes. They must
also have the ability to modify saved strategies for
example by adding or removing some indicators.
Our goal is also to provide instructional designers
with some dedicated tools dealing with the
restitution of the observation results, in an
understandable and appropriate format to help their
analyze. To meet these expectations, the next
challenge relies on:
Identifying instructional designers’
needs and practices about the
organization of observation activities.
We decided to conduct a confirmatory study
CSEDU2014-6thInternationalConferenceonComputerSupportedEducation
318
(Wilkinson, 1999) to validate our observations and
hypotheses with instructional designers using the
UMTice environment. It is an LMS (Learning
Management System) based on the Moodle
platform. It is used in the University of Maine
(France) either for distant online courses or for
blended learning in addition to presential courses.
The confirmatory nature of our study does not
prevent us from exploring other tracks (Le Roux and
al., 2004) on the practices of instructional designers
in terms of observation.
3.1.2 Assumptions
We stated different assumptions about the
instructional designers' needs and practices for
organizing the observation of their learning
situations. These hypotheses stipulate that
instructional designer’s objectives could vary from
one session to another. When designing the learning
situation, he defines some indicators. During the
deployment phase of the learning situation, he does
not systematically use all the indicators previously
defined. Set-up indicators may vary depending on
the activities performed or according to some
pedagogical aspects of the scenario that the
instructional designer wants to evaluate or validate.
These indicators can also depend on what he wants
to confirm or not with a particular group of learners.
We have also assumed that instructional
designers need to organize the observation according
to the restitution of the calculated indicators
(format): they have to be understood without being
an expert in computer languages.
The survey presented in the following sections
aims at verifying these hypotheses and highlighting
the elements of an observation strategy.
3.1.3 Methodology
To verify and collect the instructional designers'
needs concerning the observation of learning
situations they develop with the platform, we initiate
a process consisting of three steps. The first step of
this investigation consists in the realization of
individual interviews with instructional designers
from the multimedia department of the Technology
Institute of Laval, France. This step is motivated by
the fact that we have instructional designers
available to answer our questions and to give us their
feedback on the observation during their use of the
UMTice platform. This allows us to check, in a very
first time, some elements of our hypothesis. The
second step concerns the distribution of a
questionnaire for all the instructional designers using
UMTice. This questionnaire only proposes closed
questions (Droesbeke et al., 1997), mainly because
we aim to obtain some quantitative statistics to
validate and confirm the conclusions derived from
our previous interviews with a reduced community
of instructional designers. The choice of the
questionnaire is related to the availability of means
to conduct such an investigation, the access to a
target audience and the ability to have enough
answers. Once the information about needs and
practices in observation are collected from the first
community of practitioners, we realize a simulation
with the visualization prototype in which we
simulate a concrete example of a learning situation
with a strategic organization of observation and
indicators visualization. We present this simulation
to the instructional designers in order to check if our
approach could satisfy their needs. This allows us to
validate some aspects of the prototype and to collect
some comments and criticisms to improve the
functional and ergonomic aspects of the Human
Machine Interface.
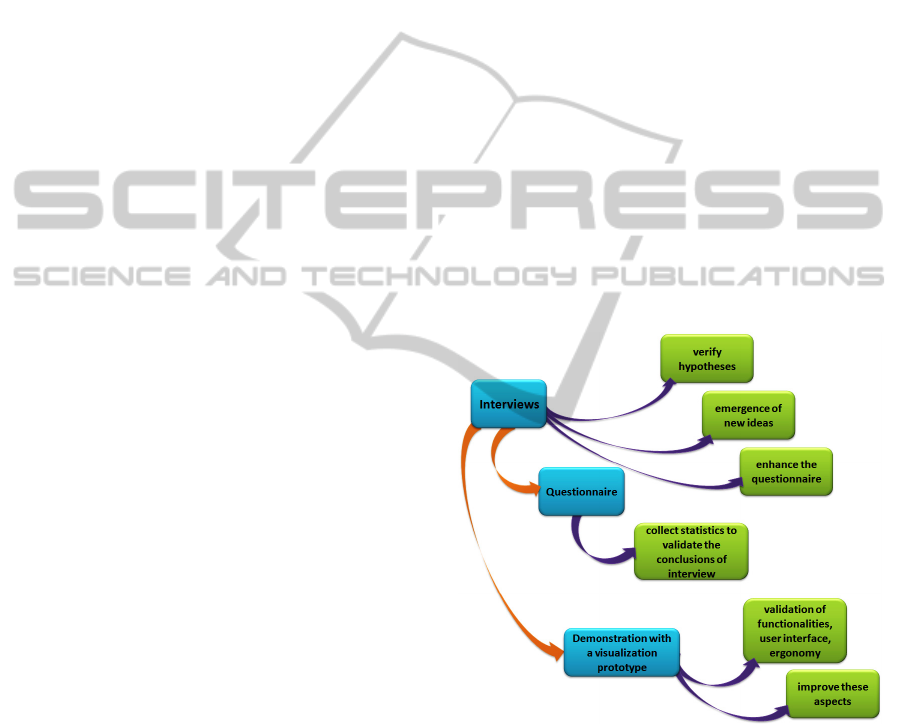
Figure 1 summarizes the different steps of the
investigation with their related objectives:
Figure 1: The investigation process.
3.1.4 The Interview Phase
Interview Process
The interviews we made took place individually.
Each meeting spent about one hour. The interviews
were introduced by the presentation of the research
work within which the study takes place. Questions
relating to the observation of learning situations
were discussed. Instructional designers spoke about
their observation activities. They presented the
TheStrategicOrganizationoftheObservationinaTELSystem-StudiesandFirstFormalizations
319

observation tools that the platform proposes to them
for monitoring the learning situations. Discussions
focused on the needs of organizing observation
(autonomy, choice of indicators, etc.), the way of
restitution of the results (moment, format, etc.) the
needs for broadcasting these results and the
possibility of reusing the same organization from a
pedagogical scenario execution (session) to another.
The interview has followed a roadmap to treat all
the points related to our hypothesis placing the
instructional designer at the center of the observation
activity. The interviews were, also, an opportunity to
test a first version of our questionnaire on the study
of needs and practices in observation.
First Analysis of Interviews
The analysis of the interviews made with
instructional designers of Multimedia Department of
the Technology Institute of Laval allowed us to
highlight three different categories of results:
a) Position Relatively to the Existing Devices
Regarding the existing tools, teachers we
interviewed indicated that the platform UMTice of
the University of Maine already provides tools to
observe learning situations: the Moodle activity
reports, histories, reports of participation or statistics
on the purposes. These tools allow them mainly to
identify the resources consulted, the users of a forum
and the consultation rate per student of educational
resources available online. Teachers said they used
this information to get an idea of learners who show
a real interest for resources to prepare activities that
require the information contained in these resources.
Due to poverty of visualization and indicators
perception tools, some teachers tried to use an
external tool to the platform UMTice, called Gismo
(Mazza and Milani, 2004). Instructional designers
find easier the analysis, understanding and use of
graphics and color codes of Gismo. The teachers
using Gismo do not say to be completely satisfied
with this tool because they find the number of
indicators viewed very small and these indicators
focus on the visualization of relational behavior
between learners (initiated discussions, participants,
exchanged messages, etc.) and not on activities or
productions made in solving exercises, for example.
Some instructional designers proceed in a different
way to consider indicators provided by UMTice.
They export them to an Excel file and then analyze
them. It appears that this additional activity is time
consuming and therefore, after a while of using this
method, they stopped to use it.
b) Desired Improvements
The improvements wanted by instructional designers
interviewed are many and it is important to mention
some of them. There is an unanimous wish to have
more structured forms of indicators restitution, such
as tables, graphs, and especially time lines and color
codes. Teachers interviewed are convinced that the
visualization of an indicator in different ways,
through different visualization structures increase
their understanding of the information carried by the
indicator. Teachers expressed the need to identify
the most active members through forums and who
participate the most in collaborative learning. Some
teachers have expressed their wish to go to a finer
grain in the visualization of consultations of the
resource base. They want, for example, to know the
indexes of pages consulted, consultation time,
current activity during the consultation, etc.
Teachers have also expressed their desire to have an
evolution in the time of the indicator values to verify
that the interventions made on pedagogical scenarios
have improved the learning activity.
c) Appreciation of the Proposed Solution
The analysis of the outcome of the interview also
shows that instructional designers are favorable to
the idea of having a tool that provides a rich choice
of indicators to be displayed, depending on the
activity carried out, and return them at the desired
time and in a more accessible and understandable
format without using an additional activity. It is
important also to note that the teachers interviewed
found interesting the possibility to use in their
observation activity, an editor to define
configurations of observation, to capitalize, share
and reuse them. It should be noted, too, that the need
for indicators in real time is not really expressed,
insofar as they are not faced with such a situation in
their use of the platform, but they find the idea
interesting. Instructional designers showed a real
interest in our proposal to provide them with a
graphical editor of observation strategies whose use
could be available to all teachers, whatever their
level in computer science.
3.2 Outcomes from Theoretical Studies
Many research works dealt with some observation
aspects. Some of them are focusing on the display of
the observation results to the right recipients. They
generally provide a set of visualization tools allowing
a better understanding and interpretation of the
results. The visualization of indicators can be
achieved by means of different views, supporting the
isolation of interesting phenomena, and allowing an
intuitive vision of what happened (Dyke and al.,
2009).
CSEDU2014-6thInternationalConferenceonComputerSupportedEducation
320
An overview of these works is presented in
(Ouali and al., 2013). These works have developed
specific tools for displaying the results of indicators.
Some of these tools allow the monitoring of learning
situations in real-time (France and al., 2006) (May,
2010). Other ones limit the visualization to the end of
the learning session (Mazza and Dimitrova, 2004)
(Heraud and al., 2005). Some tools combine several
viewing format for a same indicator (Greenhalgh and
al., 2007) (Morrison and al., 2006). Other works
propose the indicators visualization thanks to a
horizontal time axis (Van Diggelen and al., 2008), by
the means of contingency graphs (Heraud and al.,
2005), or by Chernoff Faces (France and al., 2006).
The tools from (Greenhalgh and al., 2007)
demonstrate the added value of a computer-assisted
traces analysis but they focus on very specific data
and require further developments to adapt their
techniques to TEL systems. Some tools specifically
address tutors in order to provide them with
monitoring elements for supervising some learning
sessions (Heraud and al., 2005). Most of calculated
and visualized indicators are exploiting traces from
communication activities between participants in a
session (May, 2010) (Mazza and Milani, 2004).
Some works are very TEL-system-dependent and
only focus on specific generated traces. It does not
allow the exploitation of their tools and techniques
on other platforms (Mazza and Milani, 2004) (Mazza
and Dimitrova, 2004). We also notice that the
majority of existent tools focused the visualization of
indicators on a very limited set of them, generally
calculated from traces of message exchanges. It is
also important to consider the lack of research works
taking into account the context of the pedagogical
scenario.
If we consider research activities in the field of
observation particularly concerning learning
situations and perception of educational indicators,
we are able to present some facts related to the
teacher or the instructional designer. The first
concerns the lack of results directly designed and
provided for the teacher: a majority of projects
focused on learner support activities (Van Diggelen
and al., 2008) and activities of researchers (Dyke and
al., 2009). The specific needs of the teacher or the
instructional designer, which may vary from one
session to another, are not taken into account. We
noticed, moreover, that the viewing covers on the
same indicators whatever the scenario of the learning
session. These indicators are often proposed directly
by the learning platform; they are not defined at a
sufficient abstract level that could improve the
understanding and the observation setting up for
instructional designers. So, it is not possible to decide
neither indicators to display, nor the time of viewing,
etc. We also notice that teachers often feel
constrained by the complexity of the technical
environment, so it is difficult for them to think about
and design the observational process of the learning
situation without technical considerations. In terms of
indicators restitution, the visualization means
available often require learning and training efforts to
use them.
The state-of-art we performed has highlighted a
real need for a strategic organization of the
observation activity. Several questions remain:
How to help the teacher or
instructional designer to organize his
activity of observation strategically?
How to take into account the
observation objectives of the teacher
or the instructional designer? In what
kind of form the results of the
observation should be returned?
4 THE PROPOSAL
4.1 The Overview of an Observation
Strategy
The concept of observation strategy is related to how
the observation is organized. Indeed, this
organization is concretely driven by various
observation needs for different actors and different
objectives. It is also intimately linked to how the
learning situation is organized, the learning scenario,
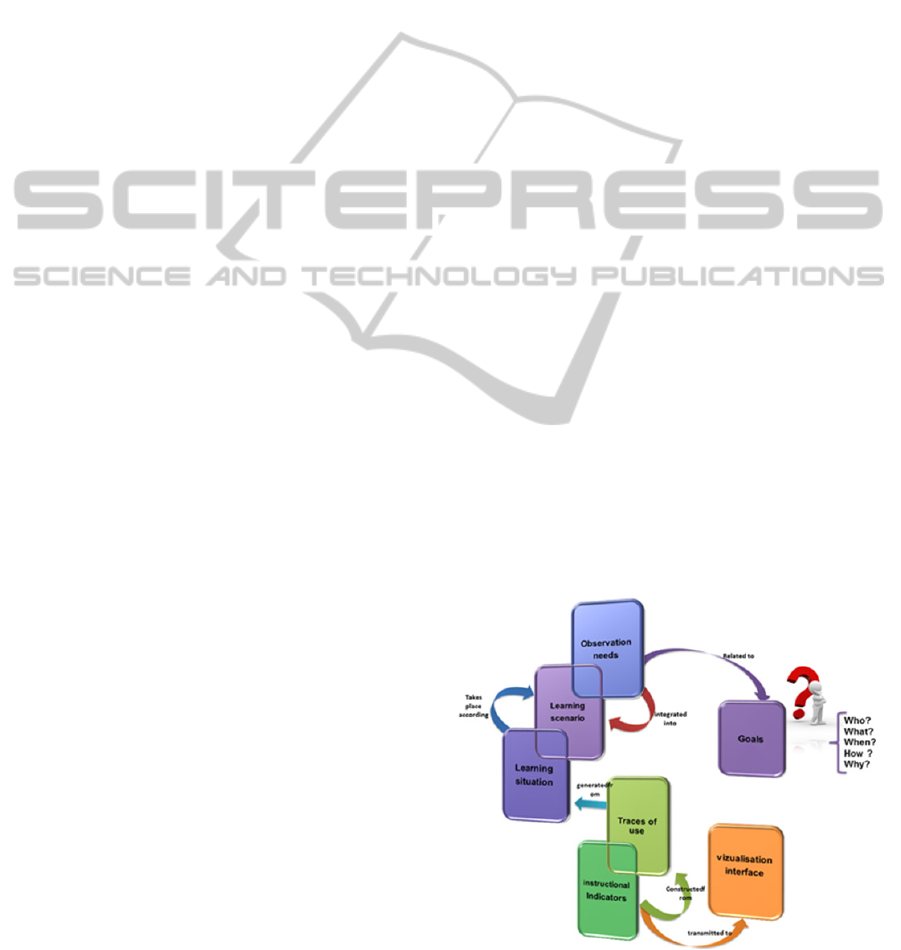
Figure 2: A general idea of our concept of observation
strategy.
TheStrategicOrganizationoftheObservationinaTELSystem-StudiesandFirstFormalizations
321
and its actors and pedagogical objectives. But for a
same learning situation, various strategies can be
defined according to the actors targeted; their
observation needs, the considered tracks, the elicited
indicators, the distribution and representations of the
results, and so on. Figure 2 draws this general
concept of observation strategy.
Such strategies should try to answer to these
questions: does the right actor observe the right
information? At the right time? With the right
format? Does it correspond to his observation needs?
Does the information presented (indicator) is at such
an abstract level from the TEL environment tracks to
be useful?
4.2 Definition of the Observation
Strategy
The observation strategy consists of a set of
indicators, their perception mechanisms (form of
restitution of these indicators) and the recipients of
these indicators. It is composed also of its context of
use (in connection with the pedagogical scenarios),
the objectives of the observation (learner assessment,
adaptation of the pedagogical scenario, monitoring
the learning session etc.) and time of observation
(during the session, after the session, the completion
of an action, etc.).
Although the strategy can evolve progressively
with uses, it must nevertheless be considered ahead
of the learning situation. It must be extensible by
adding new indicators. It must be capitalizable to be
reused. Observation Strategy must also be adaptive to
the context of learning scenario.
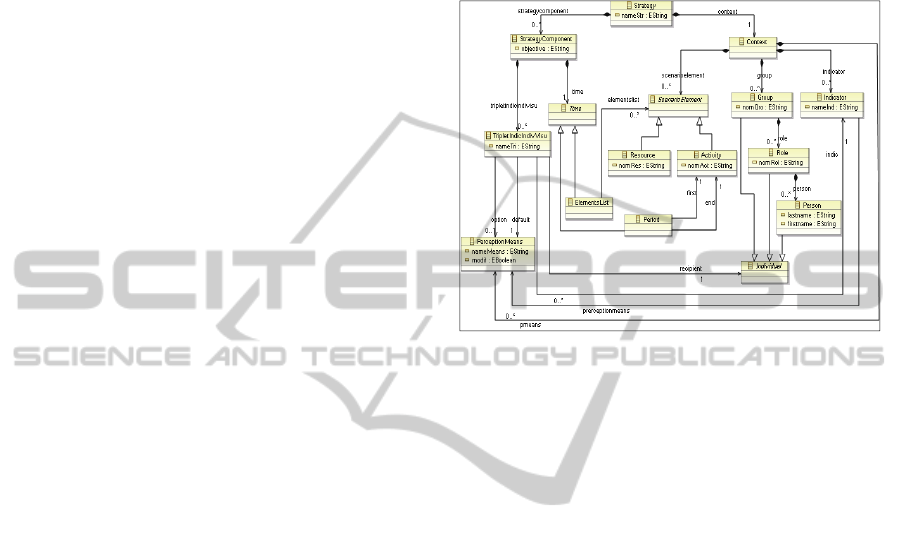
4.3 Formalization of the Strategy
Figure 3 shows the meta-model of an observation
strategy. In this meta-model, we find out the
composition of an observation strategy including a
specific context and multiple components. Defining
the context requires the definition of four elements:
the elements of the scenario, the groups of
individuals to observe, the indicators to watch and
the perception means available. The elements of the
scenarios can be resources or activities. The groups
are composed of individuals each having a specific
role during the course of the learning situation. A
monitoring component strategy consists of a set of
triplets "indicator, individual perceiving means" and
the time of observation. The triplet is set to be
displayed by a particular recipient. For each
indicator, at least one means of perception is
associated with the possibility or not to change for
each indicator the means by which it can be viewed.
The observation time can be defined in two ways: by
listing the elements of the educational scenario that
must be observed or by defining a period indicating
the activity by which the observation begins and the
activity by which it ends.
Figure 3: Meta-model of an observation strategy.
5 EXAMPLE OF DEFINING AN
OBSERVATION STRATEGY
5.1 Description of the Learning
Scenario
In this example, we want to illustrate the
specification of an observation strategy by a teacher
or instructional designer. The learning situation to
consider in this example comes from an experiment
performed in (Pham Thi Ngoc, 2011). This
experiment was performed in the Multimedia
department in the Laval Institute of Technology,
France. It involved 90 students in the first year of
DUT degree, over a practical session. These students
were divided into six groups. The educational
objective of the session is about object-oriented
programming in Java in the course "Basics of object-
oriented programming". For a period of three hours,
the student must answer twelve questions through a
programming environment called Hop3x (Lekira,
2011). Teachers have defined specific indicators for
each of the 12 questions
5.2 Definition of the Observation
Scenario
We want to observe the solving of the 12 questions
by the students participating to the practical session.
CSEDU2014-6thInternationalConferenceonComputerSupportedEducation
322
The indicators to consider are the transverse ones for
the 12 questions. To respond to observation
objectives related to the designer, tutors and
learners, the designer has defined the following
elements:
For each indicator, viewing default means are
defined, and other means are available to the
designer so that he can choose another way or
other means for the same indicator.
The designer defines the time of observation as the
time spread over all activities of the scenario.
Recipients of the observation are the designer, both
tutors and 90 learners.
The designer watches all the transverse indicators.
Tutors observed the indicators 1 to 5. Learners
observe the indicators 8 and 9.
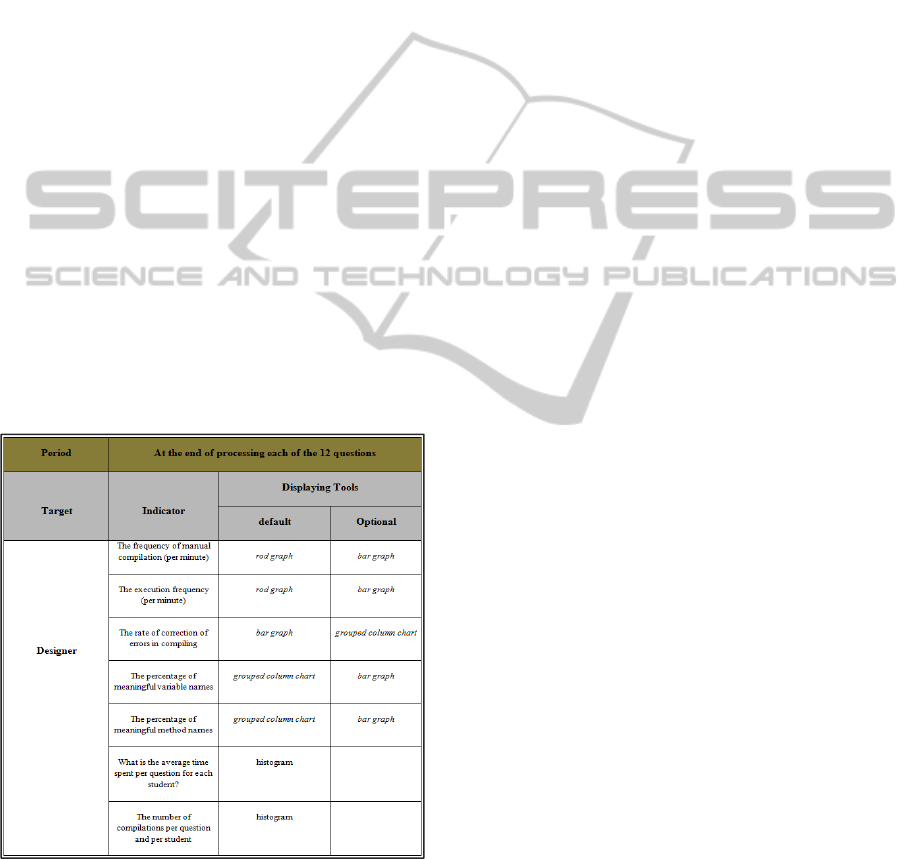
With information relating to the experiment’s
progress, we can define the strategy described in
Figure 4. In this figure, we find the defined triplets
and the period for viewing. For the triplets, the
individual considered is the designer, and for each of
the indicators to visualize, a perception means is set
by default. For some indicators, an optional means is
associated. The moment of the indicators displaying
is the end of processing each question, that is to say
the time of transition to the next question because in
Hop3x the calculation of the indicators s done in the
move to next question.
Figure 4: Example of a specified observation strategy.
5.3 Formalization using the Meta-
Model
Because we plan to use a homogeneous set of
Domain-Specific Modeling tools (Eclipse Modeling
Framework and Graphical Modeling Framework
(EMF & GMF)) in order to drive the development of
the observation strategy editor, we on purpose
propose to formalize the previous example by using
the Eclipse Metamodeling Framework. To this end,
we formalize the observation strategy meta-model as
an ecore meta-model and we use the tree-based
editor generated by EMF to build a formalized
instance of our example. Such approach certifies that
this instance is conformed to our meta-model-
conformance. It is also a relevant method to test the
meta-model semantics. According to the meta-
model, we have first to define all the elements
composing the context and then, secondly, we can
define the different triplets indicator /individual /
perception means and moments of observation.
6 CONCLUSIONS
We presented in this paper, the problem of
observation of learning situations and perception of
pedagogical indicators. We discussed in the first
instance, the notion of observation in a TEL
environment. We are interested in a second time to
the research context in which this work takes place.
We have presented and discussed thereafter, an
investigative process to understand the needs of
instructional designers, related to the organization of
the observation of learning situations. This
investigation provides three different phases. The
first one consisted in interviews with instructional
designers. During these interviews, designers
expressed their points of view on the observation
devices provided by the platform they use. They
were also able to express their expectations to
improve the existing system and their appreciation
for the functionalities we have presented them to
organize their observation activities strategically. The
next phases of the investigation will focus on the
distribution of a questionnaire to a higher number of
instructional designers to validate the results obtained
in the interviews, and on the development of a
demonstration with a visualization prototype in order
to verify if it meets their expectations and improve it,
taking into account their assessments. Thanks to that
study, we identified the need for a strategic
organization of observation. In response to this, we
have proposed the concept of observation strategy
which aims at performing the activity of observation
effectively. This concept was described using a meta-
model, and it was illustrated with an example of
defining an observation strategy, applied to an
TheStrategicOrganizationoftheObservationinaTELSystem-StudiesandFirstFormalizations
323

experiment. Currently we are working on developing
a prototype of a graphical editor of observation
strategies. The idea of this prototype comes from the
desire to provide an interface allowing the definition
of strategies by describing the context and the
strategy components. We are also working on the
development of a dashboard to display the indicators
in accordance with the defined strategies.
REFERENCES
Choquet C. and Iksal S.,2007. Modeling Tracks for the
Model Driven Reengineering of a TEL System. In
Journal of Interactive Learning Research (JILR),
edited by Chesapeake, VA:AACE, p.161-184.
De Ketele J. M., 1987. Méthodologie de l’observation. De
Boeck.
Droesbeke J. J., Fine J., Saporta G., 1997. Plans
d’expériences : Application à l’entreprise. Edition
TECHNIP.
Dyke G., Lund K., & Girardot J.-J., 2009. Tatiana: an
environment to support the CSCL analysis process.
CSCL 2009, Rhodes, Greece,58—67.
France L., J.-M. Heraud, J.-C. Marty, T. Carron, and J.
Heili., 2006. Monitoring virtual classroom:
Visualization techniques to observe student activities
in an e-learning system. In The 6
th
IEEE International
Conference on Advanced Learning Technologies
(ICALT2006), pages 716–720.
Greenhalgh C., A. French, J. Humble, P. Tennent, 2007.
"Engineering based replay application RDF and OWL
is "Online Proceedings of the UK e-Science All Hands
Meeting 2007, Nottingham: NESC / JISC.
Heraud J-M, Marty J-C, France F, and Carron T., 2005.
Helping the interpretation of web logs : Application to
learning scenario improvement. In The AIED05
Workshop on Usage Analysis in Learning Systems,
Amsterdam, Pays-bas.
Iksal S., 2011. Tracks Analysis in Learning Systems: A
Prescriptive Approach. In International Journal for e-
Learning Security (IJeLS), Volume 1, Issue 1.
Lekira A., Després C., Jacoboni P., 2011. An indicator-
based approach to support teachers’ activities. Use
case within the framework of learning object-oriented
programming with HOP3X, The 11th IEEE
International Conference on Advanced Learning
Technologies (ICALT'11), Athens-Georgia, USA.
May M., George S., Prévôt P., 2010. TrAVis to Enhance
Online Tutoring and Learning Activities: Real Time
Visualization of Students Tracking Data. IADIS
International Conference on E-learning (IADIS E-
learning), Freiburg, Germany.
Mazza, R.; Milani, C., 2004. GISMO: a Graphical
Interactive Student Monitoring Tool for Course
Management Systems. Communication in T.E.L.’04
Technology Enhanced Learning ’04 International
Conference. Milan.
Mazza, R.; Dimitrova,V., 2004. Visualising Student
Tracking Data to Support Instructors in Web-Based
Distance Education. In proceeding of the thirteenth
International World Wide Web Conference-
Educational Track, 154-161. New York, USA.
Morrison A., Tennent P., Chalmers M., 2006. «
Coordinated Visualization of Video and System Log
Data ». Proceedings of 4th International Conference
on Coordinated and Multiple Views in Exploratory
Visualization. London, 2006, 91-102.
Ouali, M.A., Iksal, S., Laforcade, P., 2013. "Models and
Tools for a Contextualized Observation Strategy in a
TEL Environment”, In The 13
th
IEEE International
Conference on Advanced Learning Technologies
(ICALT2013), pp.288, 290.
Pernin J. P. and Lejeune A., 2006. Models for the re-use of
learning scenarios. Proceedings of Imaging the future
in ICT in Education, Joint Conference, IFIP, Norway.
Pham Thi Ngoc Diem, 2011. Spécification et conception
de services d’analyse de l’utilisation d’un
environnement informatique pour l’apprentissage
humain. Doctoral thesis. Université du Maine.
Settouti L.-S., Prie Y., Mille A., Marty J –C., 2007. Vers
des Systèmes à Base de Traces modélisées pour les
EIAH. Rapport de recherche RR-LIRIS-2007-016.
Van Diggelen W., Jansen J., Overdijk M., 2008.«
Analyzing and Presenting Interaction Data : A
Teacher, Student and Researcher Perspective », ICLS
2008, Utrecht, The Netherlands.
Wilkinson L., 1999. "Statistical Methods in Psychology
Journals; Guidelines and Explanations". American
Psychologist 54 (8): 594–604.
CSEDU2014-6thInternationalConferenceonComputerSupportedEducation
324
