
Automatic Web Page Classification Using Visual Content
Ant
´
onio Videira and Nuno Gonc¸alves
Institute of Systems and Robotics, University of Coimbra, Coimbra, Portugal
Keywords:
Web Page Classification, Feature Extraction, Feature Selection, Machine Learning.
Abstract:
There is a constantly increasing requirement for automatic classification techniques with greater classification
accuracy. To automatically classify and process web pages, the current systems use the text content of those
pages. However, little work has been done on using the visual content of a web page. On this account, our
work is focused on performing web page classification using only their visual content. First a descriptor is
constructed, by extracting different features from each page. The features used are the simple color and edge
histograms, Gabor and Tamura features. Then two methods of feature selection, one based on the Chi-Square
criterion, the other on the Principal Components Analysis are applied to that descriptor, to select the top
discriminative attributes. Another approach involves using the Bag of Words (BoW) model to treat the SIFT
local features extracted from each image as words, allowing to construct a dictionary. Then we classify web
pages based on their aesthetic value, their recency and type of content. The machine learning methods used
in this work are the Na
¨
ıve Bayes, Support Vector Machine, Decision Tree and AdaBoost. Different tests are
performed to evaluate the performance of each classifier. Finally, we thus prove that the visual appearance of
a web page has rich content not explored by current web crawlers based only on text content.
1 INTRODUCTION
Over the last years, the world has witnessed a huge
growth on the internet, with millions of web pages on
every topic easily accessible through the web, making
the web a huge repository of information. Hence there
is need for categorizing web documents to facilitate
the indexing, searching and retrieving of pages. In or-
der to achieve web’s full potential as an information
resource, the vast amount of content available in the
internet has to be well described and organized. That
is why automation of web page classification (WPC)
is useful. WPC helps in focused crawling, assists
in the development and expanding of web directories
(for instance Yahoo), helps in the analysis of specific
web link topic, in the analysis of the content structure
of the web, improves the quality of web search (e.g.,
categories view, ranking view), web content filtering,
assisted web browsing and much more.
Since the first websites in the early 1990’s, design-
ers have been innovating the way websites look. The
visual appearance of a web page influences the way
the user will interact with it. The structural elements
of a web page (e.g. text blocks, tables, links, images)
and visual characteristics (e.g., color, size) are used
to determine the visual presentation and level of com-
plexity of a page. This visual presentation is known
as Look and Feel, which is one of the most impor-
tant properties of a web page. The visual appearance
(Look and Feel) of each website is constructed using
colors and color combinations, type fonts, images and
videos, and much more.
The aim of this work is to enable automatic anal-
ysis of this visual appearance of web pages by using
the web page as it appears to the user and evaluate the
performance of different classifiers in the classifica-
tion of web pages in several tasks.
The motivation behind our work is based on
(de Boer et al., 2010), where the authors proved
that by using generic visual features it was possible
to classify web pages for several different types of
tasks. They classify web pages based on their aes-
thetic value, their design recency and the type of web-
site. They concluded that by using low-level features
of web pages, it is possible to distinguish between
several classes that vary in their Look and Feel, in
particular aesthetically well designed vs. badly de-
signed, recent vs. old fashioned and different topics.
We extend their work by using and comparing sev-
eral features, testing new feature selection methods
and classifiers. We used the same binary variables
(aesthetic value and design recency) but extended the
type of webpage content for 8 classes instead of 4. We
also aim to obtain better accuracy in classification.
193
Videira A. and Goncalves N..
Automatic Web Page Classification Using Visual Content.
DOI: 10.5220/0004856201930204
In Proceedings of the 10th International Conference on Web Information Systems and Technologies (WEBIST-2014), pages 193-204
ISBN: 978-989-758-024-6
Copyright
c
2014 SCITEPRESS (Science and Technology Publications, Lda.)

2 RELATED WORK
The text content that is directly located on the page is
the most used feature. A WPC method presented by
Selamat and Omatu (Selamat and Omatu, 2004) used
a neural network with inputs based on the Principal
Component Analysis and class profile-based features.
By selecting the most regular words in each class and
weighted them, and with several methods of classifi-
cation, they were able to demonstrate an acceptable
accuracy. Chen and Hsieh (Chen and Hsieh, 2006)
proposed a WPC method using a SVM based on a
weighted voting scheme. This method uses Latent
semantic analysis to find relations between keywords
and documents, and text features extracted from the
web page content.Those two features are then sent to
the SVM model for training and testing respectively.
Then, based on the SVM output, a voting scheme is
used to determine the category of the web page.
There are few studies of WPC using the visual
content, because traditionally only text information
is used, achieving reasonable accuracy. It has been,
however, noticed (de Boer et al., 2010) that the visual
content can help in disambiguating the classification
based only on this text content. Additionally, another
factor in favor of using the visual content is the fact
that subjective variables as design recency and aes-
thetic value cannot be studied using text content con-
tained in the html code. These variables are increasing
in importance due to web marketing strategies.
A WPC approach based on the visual information
was implemented by Asirvatham et al. (Asirvatham
and Ravi, 2001), where a number of visual features,
as well as text features, were used. They proposed
a method for automatic categorization of web pages
into a few broad categories based on the structure of
the web documents and the images presented on it.
Another approach was proposed by Kovacevic et al.
(Kovacevic1 et al., 2004), where a page is represented
as a hierarchical structure - Visual Adjacency Multi-
graph, in which, nodes represent simple HTML ob-
jects, texts and images, while directed edges reflect
spatial relations on the browser screen.
As mentioned previously, Boer et al. (de Boer
et al., 2010) has successfully classified web pages us-
ing only visual features. They classified pages in two
binary variables: aesthetic value and design recency,
achieving good accuracy. The authors also applied the
same classification algorithm and methods to a multi-
class categorization of the website topic and although
the results obtained are reasonable, it was concluded
that this classification is more difficult to perform.
3 CLASSIFICATION PROCESS
This section presents the work methodology used to
fulfill the proposed objectives. Namely, how the pro-
cess of classification of new web pages is done. In
Fig. 1 it is possible to see the necessary steps to pre-
dict the class of new web pages. The algorithms were
developed in C/C++ using the OpenCV library (Brad-
ski, 2000), that runs under Windows, Linux and Mac
OS X.
The next subsections present an explanation of the
methods used to extract features from the images, and
the construction of the respective feature descriptors.
It is explained in detail the techniques used to perform
feature selection.
3.1 Feature Extraction
The concept of feature in computer vision and image
processing refers to a piece of information which is
relevant and distinctive. For each web page, differ-
ent feature descriptors (feature vector) are computed.
This section describes how a descriptor of low level
features which contains 166 attributes that character-
ize the page is obtained and how the SIFT descriptor
using Bag of Words model is built.
3.1.1 Low Level Descriptor
Visual descriptors are descriptions of visual features
of the content of an image. These descriptors describe
elementary characteristics such as shape, color, tex-
ture, motion, among others. To built this descriptor
the following features were extracted from each im-
age: color histogram, edge histogram, tamura features
and gabor features.
Color Histogram. It is a representation of the dis-
tribution of colors in an image. It can be built in
any color space, but the ones used in this work is the
HSV color space. It was selected because it reflects
human vision quite accurately and because it mainly
uses only one of its components (Hue) to describe the
main properties of color in the image. The Hue his-
togram is constructed by discretization of the colors
in the image into 32 bins. Each bin will represent an
intensity spectrum. This means that a histogram pro-
vides a compact summarization of the distribution of
data in an image.
Edge Histogram. An edge histogram will repre-
sent the frequency and directionality of the brightness
changes in the image. The Edge Histogram Descrip-
tor (EHD) describes the edge distribution in an image.
It is a descriptor that expresses only the local edge
WEBIST2014-InternationalConferenceonWebInformationSystemsandTechnologies
194
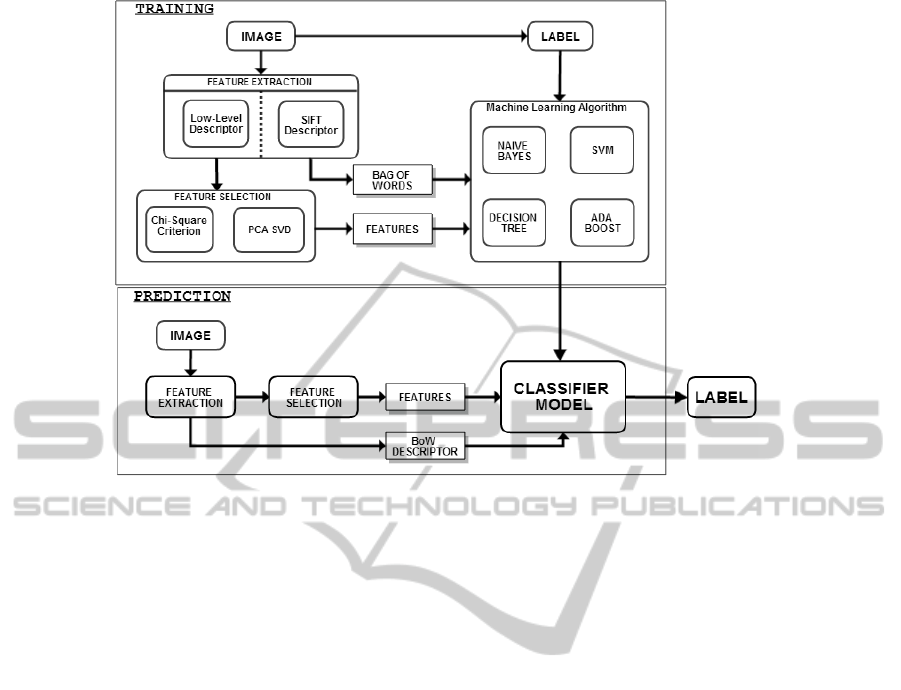
Figure 1: Classification Process diagram.
distribution in the image, describing the distribution
of non-directional edges and non-edge cases, as well
as four directional edges, and keeps the size of the de-
scriptor as compact as possible for an efficient storage
of the metadata. To extract the EHD, the image is di-
vided into a fixed number of sub-images (4x4) and the
local edge distribution for each sub image is represent
by a histogram. The edge extraction scheme is based
on an image block rather than on the pixel, i.e., each
sub-image space is divided into small square blocks.
For each image block it is determined which edge is
predominant, i.e., the image block is classified into
one of the 5 types of edge or a non edge block. Since
there are 16 sub images in the image, the final his-
togram is construct by 16x5 = 80 bins.
Tamura Features. Tamura et al. (Tamura et al.,
1978), on the basis of psychological experiments,
proposed six features corresponding to human visual
perception: coarseness, contrast, directionality, line-
likeness, regularity and roughness. After testing the
features, the first three attained very successful results
and they concluded those were the most significant
features corresponding to human visual perception.
The definition of these three features in (Deselaers,
2003) shows the preprocessing that is applied to the
images and the steps necessary to extract those three
features. The coarseness and contrast are scalar val-
ues, and the directionality is histogramized into a his-
togram of 16 bins.
Gabor Features. The interest about the Gabor func-
tions is that it acts as low-level oriented edge and
texture discriminators, sensitive to different frequen-
cies and scales, which motivated researchers to exten-
sively exploit the properties of the Gabor functions.
The Gabor filters have been shown to posses optimal
properties in both spatial and frequency domain, and
for this reason it is well suited for texture segmen-
tation problems. Zhang et al. (Zhang et al., 2000)
present an image retrieval method based on Gabor fil-
ter, where the texture features were found by comput-
ing the mean and variation of the Gabor filtered im-
age. The final descriptor is composed by 36 attributes.
3.1.2 SIFT Descriptor using Bag of Words
Model
In pattern recognition and machine learning,
keypoint-based image features are getting more
attention. Keypoints are salient image patches that
contain rich local information of an image. The Scale
Invariant Feature Transform was developed in 1999
by David Lowe. The SIFT features are one of the
most popular local image features for general images,
and was later refined and widely described in (Lowe,
2004). This approach transforms image data into
scale-invariant coordinates relative to local features.
On the other hand, the bag-of-words (BoW) model
(Liu, 2013) is a feature summarization technique that
can be defined as follows. Given a training dataset
D, that contains n images, where D = {d
1
, d
2
, ..., d
n
},
where d is the extracted features, a specific algorithm
is used to group D based on a fixed number of visual
AutomaticWebPageClassificationUsingVisualContent
195

words W represented by W = {w
1
, w
2
, ..., w
v
}, where
v is the number of clusters. Then, it is possible to
summarize the data in a n × v co occurrence table of
counts N
i j
= N(w
i
, d
j
), where N(w
i
, d
j
) denotes how
often the word w
i
occurred in an image d
j
.
To extract the BoW feature from images the fol-
lowing steps are required: i) detect the SIFT key-
points, ii) compute the local descriptors over those
keypoints, iii) quantize the descriptors into words to
form the visual vocabulary, and iv) to retrieve the
BoW feature, find the occurrences in the image of
each specific word in the vocabulary.
Using the SIFT image feature detector and de-
scriptor implemented in OpenCV, each image is ab-
stracted by several local keypoints. These vectors are
called feature descriptors and as explained above the
SIFT converts this keypoints into a 128-dimensional
vector. But once we extract such local descriptors
for each image, the total number of them would most
likely be of overwhelming size. In that case, BoW
solve this problem by quantizing descriptors into ”vi-
sual words”, which decreases the descriptors amount
dramatically. This is done by k-means clustering, an
iterative algorithm for finding clusters in data. This
will allow to find a limited number of feature vectors
that represent the feature space, allowing to construct
the dictionary.
Once the dictionary is constructed, it is ready to
be used to encode images. In the implementation of
this algorithm, different sizes of the dictionary (i.e.,
the number of cluster centers) were used, to analyze
the difference in the performance of the classifiers.
3.2 Feature Selection
An important component of both supervised and un-
supervised classification problems is feature selection
- a technique that selects a subset of the original at-
tributes by selecting a number of relevant features. By
choosing a better feature space, a number of problems
can be solved, e.g., avoid overfitting and achieve bet-
ter generalization ability, reduce the storage require-
ment and training time and allowing us to better un-
derstand the domain. Two algorithms for applying
feature selection are built. One is based on the Chi-
Square Criterion, the other uses the Principal Compo-
nents Analysis. In both methods a different number
R corresponding to the most relevant features is se-
lected. The different values of R used in this work are
1%, 2%, 5%, 10%, 20% and 50% of the total features.
3.2.1 Chi-Square Criterion
Feature Selection via chi square (χ
2
) test is a very
commonly used method (Liu and Setiono, 1995).
Chi-squared attribute evaluates the worth of a fea-
ture by computing the value of the chi-squared statis-
tic with respect to the class. The Feature Selection
method using the Chi-Squared criterion is represented
in algorithm 1.
Algorithm 1 : Feature Selection using Chi-Square
Criterion.
Input: Data Matrix (M×N) M represents the
number of samples, and N the number of features
Input: Number of classes C.
Output: Top R features
1: For each feature and class
Find the mean value corresponding to each feature.
2: For each feature
Compute the mean value of the classes mean val-
ues.
Compute the Expected and Observed Frequencies,
and calculate the chi-squared value.
χ
2
=
∑
(ExpectedFreq−ObservedFreq)
2
ExpectedFreq
;
3: Sort the chi-squared values and choose the R
features with the smallest sum of all values.
3.2.2 Principal Component Analysis using
Singular Value Decomposition
PCA was invented in 1901 by Karl Pearson as an
analogue of the principal axes theorem in mechanics.
This algorithm is based on (Song et al., 2010), that
proposed a method using PCA to perform feature se-
lection. They achieved feature selection by using the
PCA transform from a viewpoint of numerical anal-
ysis, allowing to select a number of M features com-
ponents from all the original samples. In algorithm 2
the Singular Value Decomposition (SVD) is used to
perform PCA. The SVD technique allows to reduce
dimensionality by obtaining a more compact repre-
sentation of the most significant elements of the data
set, and this enable to express the data set more com-
pactly.
4 WEB PAGES DATABASE
In this work, different web page classification experi-
ments are evaluated. There are two binary classifica-
tions and one multi-category classification. The two
binary classifications are: the aesthetic value of a web
WEBIST2014-InternationalConferenceonWebInformationSystemsandTechnologies
196

Algorithm 2: Feature Selection using PCA through
SVD.
Input: Data Matrix (M×N) M represents the
number of samples, and N the number of features
Output: Top R features
1: Perform mean normalization in the Data Matrix.
2: Calculate the SVD decomposition of the Data
Matrix.
3: Select the eigenvectors that correspond to the
first d largest singular values, and denote these vec-
tors as K
1
, ..., K
d
, respectively.
4: Calculate the contribution, of each feature com-
ponent as follows c
j
=
∑
d
p=1
|K
p j
|,
where K
p j
denotes the j entry of K
p
, j = 1, 2, ..., N,
p = 1, 2, ..., d. |K
p j
| stands for the absolute value of
K
p j
.
5: Sort c
j
in the descending order, and select the R
features corresponding to the R largest orders in c
j
.
page, i.e., if a web page is beautiful or ugly (a mea-
sure that depends on the notion of aesthetic of each
person), and the design recency of a web page, i.e.,
trying to distinguish between old fashioned and new
fashioned web pages. The multi category classifica-
tion involves classification on the web page topic.
Using the Fireshot plugin
1
for the Firefox web
browser, allows to retrieve a screen shot of a web page
and save it as a .PNG file. Different training sets of
30, 60 and 90 pages are built for each class of the clas-
sification experiment. For each site we only retrieved
the landing page which is generally the index page.
4.1 Aesthetic
The notion of aesthetic differs from person to person,
because what can be beautiful for someone, can be
ugly for another. That is why this classification de-
pends of each classifier and it is a subjective classi-
fication. Nevertheless, there is a generic notion of
the beautiful and of the ugly that is common to the
individuals of a certain culture. We emphasize that
this underlying notion of the aesthetic value is of ex-
tremely importance to marketing and psychological
explorations.
1
https://addons.mozilla.org/pt-pt/firefox/addon/fireshot/
In this classification experiment two classes are
then defined: ugly and beautiful web pages. Notice
that in Aesthetic, the important aspect is the visual
design (”Look and Feel”) of a web page, and not the
quality of information or popularity of the page.
The ugly pages were downloaded from two arti-
cles (Andrade, 2009) and (Shuey, 2013) and their cor-
responding comment section, and also from the web-
site World Worst Websites of the Year 2012 - 2005
(Flanders, 2012). The beautiful pages were retrieved,
consulting a design web log, listing the author’s selec-
tion of the most beautiful web pages of 2008, 2009,
2010, 2011 and 2012 (Crazyleafdesign.com, 2013).
After analyzing the web pages retrieved (Fig.2) ,
it was possible to notice that, in general, an ugly web
page don’t transmit a clear message, uses too much
powerful colors, lacks clarity and a consistent navi-
gation. While, on the opposite side, it was possible
to notice that a beautiful web page usually has an en-
gaging picture, an easy navigation, the colors compli-
ment each other and it is easy to find the information
needed. Obviously these are some directives observed
from the database and do not correspond to strict con-
clusions.
4.2 Design Recency
The objective of this classification is to be able to dis-
tinguish from old fashioned and new fashioned pages.
The principal differences between these pages (Fig.3)
is that nowadays the web design of a page has firmly
established itself as an irreplaceable component of ev-
ery good marketing strategy. Recent pages usually
have large background images, blended typography,
colorful and flat graphics, that is, every design ele-
ment brings relevant content to the user. In the past
the use of GIFs, very large comprised text and blind-
ing background were common in most sites.
The old web pages were retrieved consulting the
article (waxy.org, 2010), that shows the most popu-
lar pages in 1999, and using the Internet Archive web
site
2
allowed to retrieve the versions of those websites
in that year. To retrieve the new pages, the Alexa
3
web
page popularity rankings was used, selecting then the
2012 most popular pages.
4.3 Web Page Topic
In this classification eight classes are defined. These
classes are newspapers, hotels, celebrities, confer-
ences, classified advertisements, social networks,
gaming and video-sharing.
2
http://archive.org/web/web.php
3
http://www.alexa.com
AutomaticWebPageClassificationUsingVisualContent
197
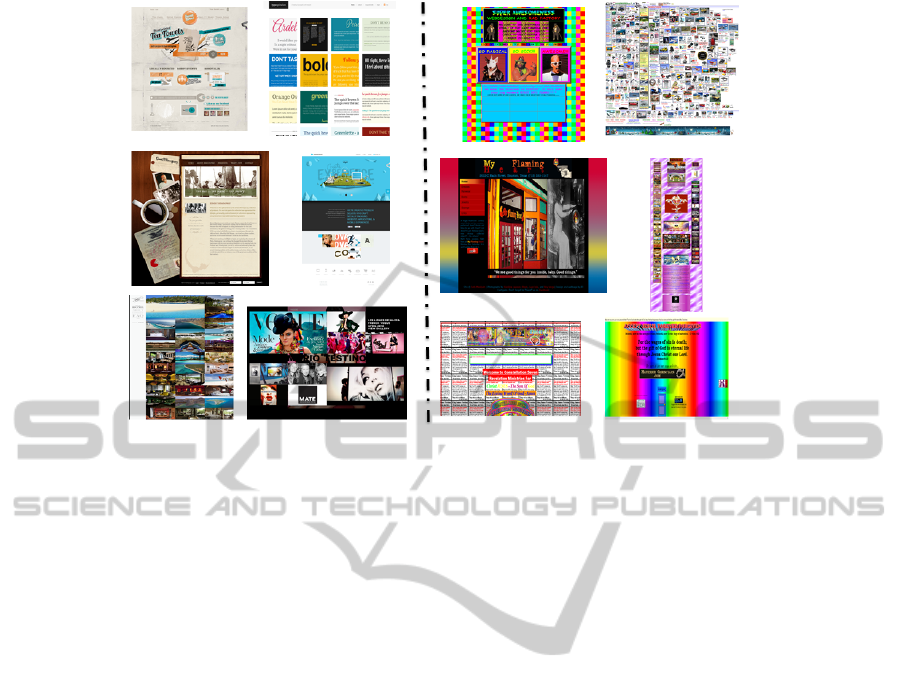
Figure 2: An example of the web pages retrieved for the Aesthetic classification. In the left, there are 6 beautiful web pages,
and in the right 6 ugly web pages.
For the newspaper and celebrity classes, the
Alexa.com was consulted, retrieving the most well-
known and popular newspapers and celebrity sites.
The celebrity sites also include popular fan sites.
The conferences class consist in the homepages of
the highest ranked Computer Science Conferences.
And for the hotel class, different sites from bed-and-
breakfast businesses are retrieved. The classes in-
clude different pages from different countries. The
classified advertisements sites were extracted using
also the Alexa.com, retrieving the most visited sites
of classifieds of all world (sections devoted to jobs,
housing, personals, for sale, items wanted, services,
community, gigs and discussion forums). The video-
sharing class and the gaming class (company gaming
websites and popular gaming online websites), were
extracted consulting the google search engine for the
most popular sites in this type of websites. Social
networks class consist in the major social networking
websites homepages (e.g., websites that allow people
to share interests, activities, backgrounds or real-life
connections).
A topic of a web site is a relevant area in the classi-
fication of web pages. Each topic has a relevant visual
characteristic that distinguishes them, being possible
to classify the web pages despite of their language or
country. Looking at the pages retrieved (Fig.4 and 5),
it is possible to perceive a distinct visual characteris-
tic in each class. The newspaper sites have a lot of
text followed with images, while celebrity sites have
more distinct colors and embedded videos. The con-
ferences sites usually consist in a banner in the top
of the page, and text information about the confer-
ence. Hotel sites have a more distinct background,
with more photographs. Classifieds sites consist al-
most in blue hyperlinks with images or text, with a
soft color background and banner. The body content
of a video-sharing site consist in video thumbnails.
The gaming sites have a distinct banner (an image or
huge letters), with a color background and embedded
videos. The social networks homepages, have a color
pattern that is persistent.
5 RESULTS AND DISCUSSION
By training our classifiers with different training data
sets, different comparisons can be made. Different
evaluations were made to analyze what features and
which classifiers are better for each classification task.
Each classifier was evaluated with the low feature
descriptor (containing 166 features), just the Color
Histogram, Edge Histogram, Tamura Features, Ga-
bor Features, and the descriptor containing the most
relevant features selected by the methods of feature
selection. Additionally the same data sets were used
to train the classifiers with the SIFT descriptor using
the bag of words model. The results for each classi-
fication task are shown in the next sections, as well
as a comparison with the results of (de Boer et al.,
2010). Different tests were performed using different
data size for the training of the classifiers.
To test all methods after the training phase, new
web pages were used to the prediction phase. Our re-
sults are based on the accuracy achieved by this pre-
diction phase.
WEBIST2014-InternationalConferenceonWebInformationSystemsandTechnologies
198

Figure 3: An example of the web pages retrieved for the Recency classification. In the left, there are 6 old fashioned web
pages from 1999, and in the right 6 new fashioned web pages from 2012.
Figure 4: Examples of web pages extracted for four web site topic classes.
5.1 Aesthetic Value Results
Boer et al. (de Boer et al., 2010) in this experiment
with the 166 features achieved an accuracy using the
Naive Bayes and a J48 Decision Tree of 68% and 80%
respectively. Using just the Simple Color Histogram
and Edge Histogram they correctly classified 68% and
70% respectively for the Naive Bayes, and 66% and
53% for the J48 Decision Tree classifier.
For this experiment, Fig.6 show the best rate pre-
diction for our classifiers, when used the SIFT de-
scriptor. Using different sizes for the dictionary, we
obtained good result for each classifier. The best re-
sults for the Na
¨
ıve Bayes, SVM and the Decision Tree
was of 80%, and for the AdaBoost we achieved a pre-
diction accuracy of 85%.
When trained the model using just the Color His-
togram attributes, the results show an accuracy of
65% for Naive Bayes, 85% in SVM, 70% for the De-
cision Tree and 85% using the AdaBoost when trained
with 90 images for each class. When we selected
the top discriminative attributes to train the classi-
AutomaticWebPageClassificationUsingVisualContent
199
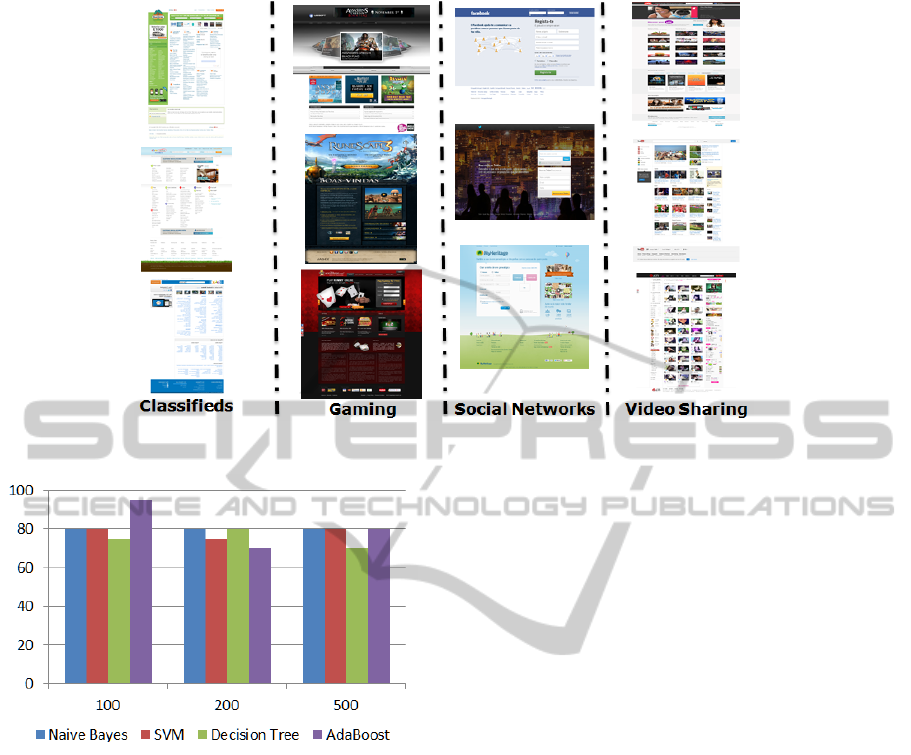
Figure 5: Examples of web pages extracted for the other four web site topic classes.
Figure 6: SIFT Descriptor using BoW Model prediction re-
sults with different dictionary sizes (100, 200 and 500) for
the Aesthetic Value.
fiers, the best results using the Chi-Squared method
was when the classifiers were trained with the top
50% attributes. The Naive Bayes and SVM achieved
an accuracy of 65%, the Decision Tree 80% and the
AdaBoost an accuracy of 75%. When trained with
the top 20% attributes by using the PCA method, the
Naive Bayes classifier achieved an accuracy of 75%,
the SVM classifier predicted 65% of corrected pages,
and finally, the Decision Tree and the AdaBoost clas-
sifiers both had an accuracy of 80%.
All the classifiers showed a high prediction accu-
racy, with different features. Since most of the fea-
tures chosen by the feature selection method are from
the Color Histogram, it is possible to achieve a good
prediction rate just by passing this simple descriptor.
The SIFT descriptor give the best results, proving that
the images from this two classes have distinctive key-
points.
5.2 Design Recency Results
In this experiment, Boer et al. (de Boer et al., 2010)
using the complete feature vector achieved an accu-
racy using the Na
¨
ıve Bayes and a J48 Decision Tree
of 82% and 85% respectively. Using just the Simple
Color Histogram the Na
¨
ıve Bayes performed slightly
worse than the baseline and the J48 Decision Tree
classifier sightly better. Using only the edge informa-
tion, both models correctly classified 72% and 78%
respectively for the Na
¨
ıve Bayes and J48 Decision
Tree classifier.
Our best results for this experiment, using the low-
level descriptor, are shown in Fig.7. The Na
¨
ıve Bayes,
SVM and Adaboost achieved an accuracy of 100%,
when the top 5% attributes were selected using the
chi-square method for the first one and the Gabor de-
scriptor for the other two. The Decision Tree best ac-
curacy (95%), was when the PCA method selected the
top 5% attributes.
Relatively to the SIFT descriptor, all the classifiers
obtain a good accuracy. Noteworthy that all the classi-
fiers obtain an accuracy of 90% when they used a dic-
tionary size of 500. The best accuracy result achieved
was for the Na
¨
ıve Bayes with a 95% rate of success,
with a dictionary size of 200 words.
These results proves that the classifiers can learn
just by using simple visual features. All the classi-
fiers obtained good accuracy around 85%, using just
the top 1% attributes selected by both methods. In-
stead of using a more complex method like BoW, the
use of simple visual features allows to decrease the
computational cost for larger databases.
WEBIST2014-InternationalConferenceonWebInformationSystemsandTechnologies
200
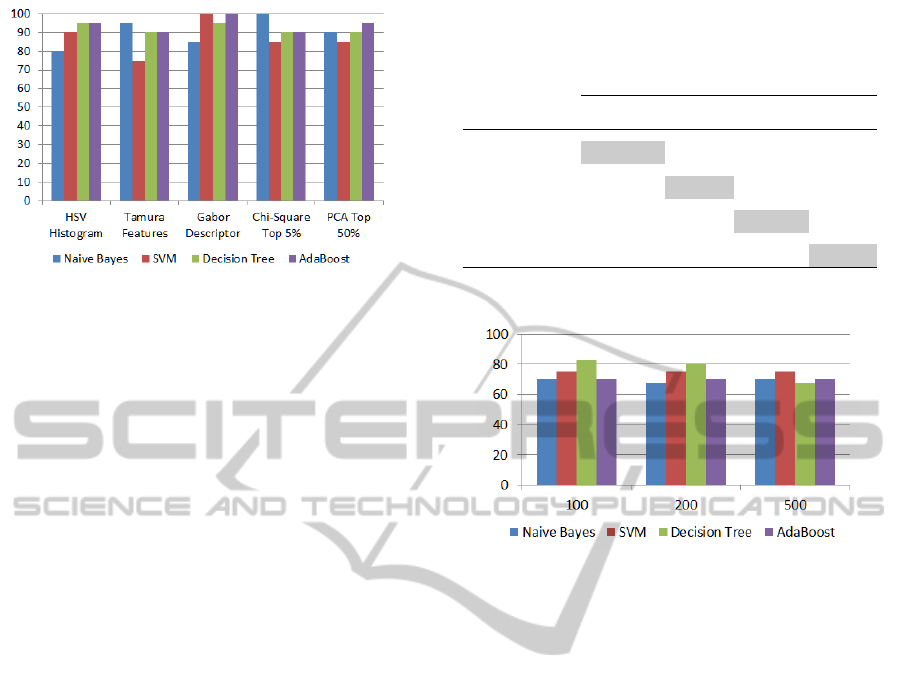
Figure 7: Best prediction results for the Recency value for
four different classifiers, using the low-level descriptor. All
these predictions values, were obtained by training the clas-
sifiers using 90 images for each class.
5.3 Web Page Topic Results
5.3.1 Experiment 1 - Four Classes
(de Boer et al., 2010) define the following four
classes for the topic: newspapers, hotel, celebrities
and conference sites. The classification results
obtained were the following: when all features are
used, an accuracy of 54% and 56% for the Na
¨
ıve
Bayes and the J48 respectively. Using the Color
Histogram subset result in much worse accuracy.
Using only the Edge Histogram attributes, the Na
¨
ıve
Bayes predict with an accuracy of 58%, whereas the
J48 predicts with an accuracy of 43%. When they
performed feature selection they show that the best
predicting attributes are all from the Tamura and
Gabor feature vectors. Using the top 10 attributes a
prediction accuracy of 43% for both classifiers was
obtained.
Using the same low-level descriptor that they
used, all our classifiers obtained better results. The
Na
¨
ıve bayes achieved an accuracy of 62,5% using
the Tamura Features. The SVM and Decision Tree
achieved an accuracy rate of 72,5%, when used the
selected top 20% attributes using the PCA method
and using the whole descriptor, respectively. While
the AdaBoost classifier achieved an accuracy of
70% using the PCA method selecting the top 50%
attributes.
Furthermore, the results showed in Fig. 8 are
an improvement of the accuracy of approximately
22% using the BoW model. Every classifier have an
acceptable accuracy, where the best accuracy result
is as high as 82,5% for the Decision Tree using just
100 words to construct the dictionary. In fact all the
classifiers have accuracy higher than or equal to 70%
when used just 100 words in the dictionary.
Table 1: Confusion Matrix for 4 classes each with 10 web
pages, for the best prediction result of the Na
¨
ıve Bayes clas-
sifier, using the SIFT descriptor.
Actual
Newsp. Conf. Celeb. Hotel
Predicted
Newsp. 7 0 0 0
Conf. 2 7 2 2
Celeb. 0 0 8 2
Hotel 1 3 0 6
Figure 8: SIFT Descriptor using BoW Model best predic-
tion results with different dictionary sizes (100, 200 and
500). Experiment with 4 classes.
Examining the results of the confusion matrices
(Table 1, 2, 3 and 4) corresponding to the best pre-
dictions of each classifier using the SIFT with BoW
model (Fig. 8), it was verified, when analyzing the
accuracy by class, that the Na
¨
ıve Bayes, Decision
Tree and AdaBoost perform much worse for the Ho-
tel class. The Na
¨
ıve Bayes and AdaBoost classifiers
reports false positives for the Hotel class as Confer-
ence or Celebrity pages. While the Decision Tree re-
turns false positives for Celebrities web pages as Ho-
tel web pages, and vice versa. By his hand, the SVM
classifiers perform much worse for the Celebrity web
pages where most of the instances are erroneously
classified as Hotel pages. Since the Newspapers and
Conference classes have simpler designs, when com-
pared with the other classes, they are easier to distin-
guish. On the other hand, it is harder to distinguish
between more complex and sophisticated classes like
Hotel and Celebrity.
Although the results obtained for this multi-class
categorization are worse than those obtained for
aesthetic value and design recency, generally good
accuracy was obtained with best values usually near
or above 80%. Additionally, our results are better
than those obtained by Boer et al. (de Boer et al.,
2010), mainly if SIFT with BoW is used.
AutomaticWebPageClassificationUsingVisualContent
201
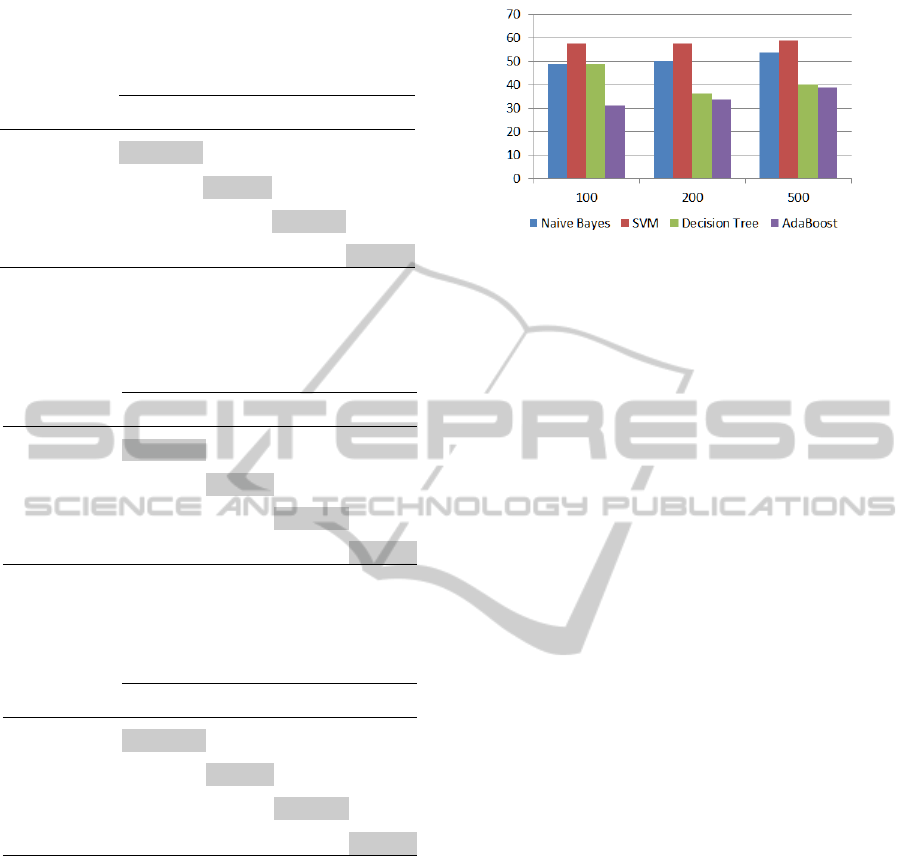
Table 2: Confusion Matrix for 4 classes each with 10 web
pages, for the best prediction result of the SVM classifier,
using the SIFT descriptor.
Actual
Newsp. Conf. Celeb. Hotel
Predicted
Newsp. 10 1 1 0
Conf. 0 8 1 0
Celeb. 0 0 4 2
Hotel 0 1 4 8
Table 3: Confusion Matrix for 4 classes each with 10 web
pages, for the best prediction result of the Decision Tree
classifier, using the SIFT descriptor.
Actual
Newsp. Conf. Celeb. Hotel
Predicted
Newsp. 10 0 1 0
Conf. 0 9 0 1
Celeb. 0 1 7 2
Hotel 0 0 2 7
Table 4: Confusion Matrix for 4 classes each with 10 web
pages, for the best prediction result of the AdaBoost classi-
fier, using the SIFT descriptor.
Actual
Newsp. Conf. Celeb. Hotel
Predicted
Newsp. 10 0 1 0
Conf. 0 6 1 3
Celeb. 0 1 8 3
Hotel 0 2 0 4
5.3.2 Experiment 2 - Eight Classes
Along with the four classes defined in the experiment
1, four additional classes were added to this classifi-
cation: classified advertisements sites, gaming sites,
social networks sites and video-sharing sites.
Using the low-level descriptor the Na
¨
ıve Bayes
had the best accuracy with 47,5%, while the SVM
achieved an accuracy of 41,25% using the Tamura
descriptor. The Decision Tree and AdaBoost classi-
fiers had a poor performance, where the best accuracy
was 37,5% and 33,75%, respectively. When we used
the Chi-Squared and PCA method to select the top
attributes the classifiers performance didn’t improve.
We conclude that for this type of classification more
complex features or a bigger database are necessary.
Figure 9: SIFT Descriptor using BoW Model best predic-
tion results with different dictionary sizes (100, 200 and
500). All these predictions values, were obtained by train-
ing the classifiers using 30 and 60 images for each class.
When we used the SIFT descriptor (Fig. 9) all
the classifiers had a better accuracy relatively to the
results obtained using the low-level descriptor. The
SVM achieved an accuracy of 58,75%, and the Na
¨
ıve
Bayes 63,75%. The Decision Tree best accuracy was
48,75% , while the Adaboost only predict the correct
class in 38,75% of the predictions.
When examining the confusion matrices (Table 5
and 6) of Na
¨
ıve Bayes and SVM classifiers (which
achieved accuracy over 50% when using the SIFT de-
scriptor), it is possible to verify that both classifiers
have problems distinguishing celebrities web pages.
The Na
¨
ıve Bayes also struggles in identify Video-
Sharing pages (only 3 correct predictions), while the
SVM have troubles in identifying Social Networks
web pages (only 2 correct predictions). The body of
video-sharing web pages that consist mostly in video
thumbnails are easily mistaken as newspapers web
page (mostly images followed by text). In both meth-
ods some classifieds advertisements web pages are
also predicted as newspapers (most classifieds adver-
tisement websites use a simple color background with
a lot of images). To overcome this drawbacks a bigger
database is necessary.
5.4 Discussion
The results show that based on aesthetic value and de-
sign recency, simple features such as color histogram
and edges provide quite good results, where in some
cases an accuracy of 100% is achieved (average best
accuracy of 85%). For the topic classification, the use
of a SIFT with BoW provide much better results.
As expected when more website topics are added
to topic classification, the classification gets harder
and the classifiers accuracy decreases to an average
accuracy of around 60%. This indicates that even if
the pages have visual characteristics that distinguishes
them, they also have some attributes or characteris-
WEBIST2014-InternationalConferenceonWebInformationSystemsandTechnologies
202

Table 5: Confusion Matrix for 8 classes, for the best prediction result of the Na
¨
ıve Bayes classifier, using the SIFT descriptor.
Actual
Newsp. Conf. Celeb. Hotel Classif. Gaming Social N. Video
Predicted
Newsp. 9 0 1 1 3 1 0 4
Conf. 1 5 0 0 1 0 0 0
Celeb. 0 0 3 2 0 2 2 1
Hotel 0 1 0 5 0 1 1 0
Classif. 0 1 1 1 6 0 0 1
Gaming 0 0 5 0 0 6 0 0
Social N. 0 1 0 1 0 0 6 1
Video 0 0 0 0 0 0 1
3
Table 6: Confusion Matrix for 8 classes, for the best prediction result of the SVM classifier, using the SIFT descriptor.
Actual
Newsp. Conf. Celeb. Hotel Classif. Gaming Social N. Video
Predicted
Newsp. 9 1 1 1 4 0 1 2
Conf. 1 8 0 0 0 0 0 0
Celeb. 0 0 4 2 0 3 2 1
Hotel 0 0 0 7 0 1 1 1
Classif. 0 0 1 0 6 1 0 0
Gaming 0 0 4 0 0 5 2 0
Social N. 0 1 0 0 0 0 2 0
Video 0 0 0 0 0 0 2 6
tics in common. To overcome this setbacks a bigger
database is necessary. Nevertheless, the aim of this
work was to demonstrate that it is possible to classify
web pages in different topics with reasonable accu-
racy and to prove that this visual content is very rich
and can be successfully used to complement, not to
substitute, the current classification by crawlers that
use only text information. Notice too, that in the de-
sign of web pages, there is a growing tendency to
include content in the images used, preventing text-
based crawlers to get to this rich content (mainly in
titles, separators and banners).
Classification using the visual features has how-
ever some limitations: if the image of the web page
has poor quality, the accuracy in the classification
will drastically be reduced. Other disadvantage is that
many web page topics have very common patterns in
their design, making very hard to the classifier to dis-
tinguish between them. We intend to enhance these
classifiers in the future to improve its accuracy.
6 CONCLUSION
In this work we described an approach for the auto-
matic web page classification by exploring the visual
content ”Look and feel” of web pages, as they are ren-
dered by the web browser. The results obtained are
quite encouraging, proving that the visual content of
a web page should not be ignored, when performing
classification. This implementation uses a method for
categorization based on low-level features.
In the future, in order to improve the classification
accuracy we can also follow some additional paths.
The integration of these visual features with other fea-
tures of web pages can thus boost the accuracy in the
classifiers. The analysis of the visual appearance of a
web page can be combined with the well-established
AutomaticWebPageClassificationUsingVisualContent
203

analysis based on text content, URL, the underlying
HTML, or others. In this case associate this visual
features with the text content may give rise to a pow-
erful classification system. Additionally, we also in-
tend to mix the classification using visual features
with a semantic analysis of them. We expect to im-
prove the results by integrating the semantic content
of a webpage image not only in the classification of
the aesthetic or recency value but also for the classi-
fication of the topic. Another approach is the extrac-
tion of more sophisticated features that can analyze
their dynamic elements (animated gifs, flash, adver-
tisement content, and so on).
As for the applications of the visual classification
of web pages, the methods studied may be applied to
an advice system that assist the design and rating of
web sites that can be applied to content filtering. In
a research perspective, the fact that the aesthetic and
design recency value are such a subjective measures,
also make of great interest studies of the consumer
profile for the field of digital marketing.
ACKNOWLEDGEMENTS
The authors acknowledge the support of the Por-
tuguese Science Foundation through project PEst-
C/EEI/UI0048/2013.
REFERENCES
Andrade, L. (2009). The worlds ugli-
est websites!!! retrieved october 2009:
http://www.nikibrown.com/designoblog/2009/03/03/
theworlds-ugliest-websites/.
Asirvatham, A. P. and Ravi, K. K. (2001). Web page clas-
sification based on document structure. In IEEE Na-
tional Convention.
Bradski, G. (2000). The OpenCV Library. Dr. Dobb’s Jour-
nal of Software Tools.
Chen, R. C. and Hsieh, C. H. (2006). Web page classi-
fication based on a support vector machine using a
weighted vote schema. Expert Syst. Appl., 31(2):427–
435.
Crazyleafdesign.com (2013). Most beautiful and inspira-
tional website designs.
de Boer, V., van Someren, M., and Lupascu, T. (2010). Clas-
sifying web pages with visual features. In WEBIST
(2010), pages 245–252.
Deselaers, T. (2003). Features for image retrieval (thesis).
Master’s thesis, RWTH Aachen University, Aachen,
Germany.
Flanders, V. (2012). Worst websites of the year 2012
- 2005: http://www.webpagesthatsuck.com/worst-
websites-of-the-year.html.
Kovacevic1, M., Diligenti, M., Gori, M., and Milutinovic1,
V. (2004). Visual adjacency multigraphs, a novel ap-
proach for a web page classification. Workshop on
Statistical Approaches to Web Mining (SAWM), pages
38–49.
Liu, H. and Setiono, R. (1995). Chi2: Feature selection and
discretization of numeric attributes. In Proceedings
of the Seventh International Conference on Tools with
Artificial Intelligence, TAI ’95.
Liu, J. (2013). Image retrieval based on bag-of-words
model. arXiv preprint arXiv:1304.5168.
Lowe, D. G. (2004). Distinctive image features from scale-
invariant keypoints. IJCV, 60(2):91–110.
Selamat, A. and Omatu, S. (2004). Web page feature selec-
tion and classification using neural networks. Inf. Sci.
Inf. Comput. Sci., pages 69–88.
Shuey, M. (2013). 10-worst-websites-for-2013:
http://www.globalwebfx.com/10-worst-websites-
for-2013/.
Song, F., Guo, Z., and Mei, D. (2010). Feature selection us-
ing principal component analysis. In System Science,
Engineering Design and Manufacturing Informatiza-
tion (ICSEM), 2010 International Conference on, vol-
ume 1, pages 27–30.
Tamura, H., Mori, S., and Yamawaki, T. (1978). Tex-
tural features corresponding to visual perception.
IEEE Transaction on Systems, Man, and Cybernetics,
8:460–472.
waxy.org (2010). Den.net and the top 100 websites of 1999:
http://waxy.org/2010/02/dennet
and the top 100 web-
sites of 1999/.
Zhang, D., Wong, A., Indrawan, M., and Lu, G. (2000).
Content-based image retrieval using gabor texture fea-
tures. In IEEE Pacific-Rim Conference on Multimedia,
University of Sydney, Australia.
WEBIST2014-InternationalConferenceonWebInformationSystemsandTechnologies
204
