
Energy Consumption Model and Charging Station Placement for
Electric Vehicles
Zonggen Yi and Peter H. Bauer
Department of Electrical Engineering, University of Notre Dame, Notre Dame, IN, U.S.A.
Keywords:
Electric Vehicle(EV), Energy Consumption Model, Charging Station Placement, Reachable Range Estima-
tion, Energy Constraint, Google Maps Api.
Abstract:
A detailed energy consumption model is introduced for electric vehicles (EVs), that takes into account all
tractive effort components, regenerative braking, and parasitic power users. Based on this model a software
tool for EV reachable range estimation (EVRE) is developed and implemented. This software tool uses real
driving distances and elevation data from Google Maps and can therefore much more accurate predict the
reachable range of a given EV than the typical Euclidean distance models. Furthermore, an optimization
model for the placement of charging stations to maximize the number of reachable households under energy
constraints is established using EVRE. These results are illustrated by a number of examples involving the
cities of New York City, Boulder Colorado, and South Bend, Indiana. The developed methodology can eas-
ily incorporate additional constraints such as popular destinations, preferred parking, driver habits, available
power infrastructure, etc. to initially reduce the search space for optimal charging station placement.
1 INTRODUCTION
Advances in battery technology have already put a
significant number of electric vehicles on the road
(Dickerman and Harrison, 2010). Innovative tech-
nologies to reduce manufacturing costs and increase
battery capacity are needed to make such vehicles
more appealing to the public. Allowing EV users to
reach charging stations conveniently is crucial for the
popularization of electric vehicles.
For accurately predicting and simulating vehicle
range, an accurate energy consumption model based
on the tractive effort is needed. Simplified EV power
train models were developed for new and existing pro-
duction vehicles(Hayes et al., 2011). An energy usage
model based on tractive effort has been constructed
for electrically powered utility vehicles traveling a
route with significant elevation variations(Prins et al.,
2012). In our energy consumption model, a more
detailed tractive effort model is provided. The driv-
ing distances and elevation data for routes on Google
Maps are used in an infrastructure model for in-
creased accuracy.
The problem of charging station placement has
been investigated by many researchers. A maxi-
mal coverage model to optimize the demand covered
within an acceptable level of service has been investi-
gated in (Frade et al., 2011). An optimization model
was developed to maximize total fleet-wide charging
levels for the location of a public EV charging in-
frastructure (Xi et al., 2013). In (Ge et al., 2011),
a grid partition method has been investigated for lo-
cating, sizing and service area division of the charg-
ing stations. A two-step clustering process was pro-
posed in (Ip et al., 2010) for optimizing the alloca-
tion of fast charging stations. A coordinated clus-
tering algorithms was programmed for mapping the
charging infrastructures in (Momtazpour et al., 2012).
(Andrews et al., 2013) studied how EV would per-
form in meeting the driving needs of vehicle owners
and then proposed an optimization model based on
a user charging model to find locations for charging
stations. In (Lam et al., 2013), the electric vehicle
charging station placement problem was formulated
to minimize the total construction cost subject to the
constraints for the charging station coverage and the
convenience of the drivers for EV charging. The NP-
hardness property of the problem was studied and an
efficient greedy algorithm to tackle this problem was
proposed. In (Wang et al., 2013) a location model
of charging stations is established based on electric-
ity consumption along the roads among cities. Fur-
thermore a quantitative model of charging stations
was presented based on the conversion of oil sales
150
Yi Z. and H. Bauer P..
Energy Consumption Model and Charging Station Placement for Electric Vehicles.
DOI: 10.5220/0004859601500156
In Proceedings of the 3rd International Conference on Smart Grids and Green IT Systems (SMARTGREENS-2014), pages 150-156
ISBN: 978-989-758-025-3
Copyright
c
2014 SCITEPRESS (Science and Technology Publications, Lda.)

in a certain area. Driving patterns have been widely
used to optimize the charging station placement. An
agent-based decision support system was presented
for identifying patterns in residential EV ownership
and driving activities to enable strategic deployment
of new charging infrastructure(Sweda and Klabjan,
2011). An improved charging station location solu-
tion was developed by providing behavioral models
to predict when and where vehicles are likely to be
parked (Chen et al., 2013). An optimization model
based on driving patterns was proposed to find loca-
tions for charging stations needed to support EV us-
age (John et al., ). Another important method is based
on the Voronoi diagram. In(Koyanagi and Yokoyama,
2010) and (Koyanagi et al., 2001), the candidates of
charging facilities for EVs were analyzed by using
Voronoi diagrams for the equilibrium arrangement in
Musashino city. In (Feng et al., 2012), a weighted
Voronoi diagram was used for the research of locat-
ing, sizing and service area division of the charging
stations. The problem with Voronoi diagrams is that
Euclidean distance is used instead of the real driving
distance.
The placement of charging stations can be ap-
proached from a number of different angles, that may
for example include the energy deficit of EVs, the
available power infrastructure, popular parking loca-
tions and stay times, minimizing overall energy, min-
imizing congestion, etc. We address the problem of
optimal charging station placement from the view-
point of reaching the most customers or households,
i.e. something a private charging station owner would
typically consider. On the other hand, this problem is
also of interest for municipalities, power companies,
and federal agencies such as the environmental pro-
tection agency and the department of transportation.
The developed concept can easily be used in conjunc-
tion with the other above mentioned criteria, if the
placement methods based on these criteria can nar-
row down the number of possible locations for charg-
ing station placement a priori. Therefore, these crite-
ria would be used in form of location constraints. In
this paper, the optimization problem for charging sta-
tion placement is investigated based on an EV energy
consumption model including driving distance and el-
evation. Given an energy bound, the corresponding
reachable contures in Google Maps for different pos-
sible charging station centers are determined. Maxi-
mizing the number of households in this range is dis-
cussed subsequently.
This paper is organized as follows. In Section 2,
the energy model for EVs is presented. In Section 3,
an optimization model for charging station placement
is provided. The simulation results are discussed in
Section 4. Conclusions are provided in Section 5.
2 ENERGY MODELS FOR
ELECTRIC VEHICLES
In this section we will introduce a detailed energy
consumption model that has two main components: a
tractive effort model with air drag, rolling resistance,
acceleration, and hill climbing components, and a
lumped loss model for the mechanical and electric
powertrain, that is described by individual efficien-
cies of powertrain components. Together, both com-
ponents provide a fairly accurate description of the
energy usage of an EV in almost any driving situa-
tion.
The air drag power component is modeled by:
P
air
(t) =
1
2
ρC
d
A(
ds(t)
dt
)
3
(1)
where A is frontal cross sectional area, ρ the den-
sity of air, C
d
is the drag coefficient, s(t) is the driving
distance,
ds(t)
dt
is the corresponding velocity at time t.
The rolling resistance power component is mod-
eled by:
P
roll
(t) = f
r
Mg
ds(t)
dt
(2)
where f
r
is the coefficient of rolling resistance, M
is the mass of the EV, g is the gravitational accelera-
tion, which is 9.81 m/s
2
.
The hill climbing power component is given by:
P
hill
(t) = Mg
dh(t)
dt
(3)
where h(t) is the elevation at t,
dh(t)
dt
is the vertical
velocity component.
The acceleration power component is given by:
P
ac
(t) = M
d
2
s(t)
dt
2
ds(t)
dt
(4)
where
d
2
s(t)
dt
2
is the acceleration at time t.
The efficiencies of battery, power converter, e-
motor controller, e-motor and mechanical powertrain
are denoted by η
bat
, η
conv
, η
contr
, η
m
, η
mp
respec-
tively.
Therefore, the overall propulsion power balance
equation can be written as:
P
bat
(t)η
bat
η
conv
η
contr
η
m
η
mp
= P
air
(t) + P
roll
(t) + P
hill
(t) + P
ac
(t)
(5)
EnergyConsumptionModelandChargingStationPlacementforElectricVehicles
151

Now denoting parasitic power losses at the battery
(lights, heater, stereo, etc.) as P
para
, we obtain:
(P
bat
(t) − P
para
(t))η
bat
η
conv
η
contr
η
m
η
mp
= P
air
(t) + P
roll
(t) + P
hill
(t) + P
ac
(t)
(6)
In the case of regenerative braking we need to
reverse the powerflow and hence use the following
modification of the above equation:
P
bat
(t) −P
para
(t)
= (P
air
(t) +P
roll
(t) +P
hill
(t) +P
ac
(t))η
bat
η
conv
η
contr
η
m
η
mp
(7)
with η
bat
, η
conv
, η
contr
, η
m
, η
mp
being the efficien-
cies of the respective components for reversed power-
flow.
3 OPTIMIZATION FOR
CHARGING STATION
PLACEMENT
The optimal placement of charging stations has been
intensely researched and many methods have been de-
veloped((Xi et al., 2013),(Chen et al., 2013),(Feng
et al., 2012),(Frade et al., 2011),(Sweda and Klab-
jan, 2011),(Koyanagi and Yokoyama, 2010)). This
method is based on the energy consumption model of
electric vehicles. We focus on maximizing the reach-
able households with a given battery energy bound.
Given this constraint, the reachable range can be de-
rived on Google Maps. To get the amount of covered
population in the reachable range, the population dis-
tribution for the considered area must be known. A
reasonable way is to divide the city by ZIP code zones
and then use the population in each ZIP code area.
Suppose there are N possible positions
X = {x
1
,...,x
N
} for charging station placement.
There are M ZIP code zones Y = {y
1
,...,y
M
}. The
model for a ZIP code zone is y
j
= (ycp
j
,ypop
j
),
where ycp
j
is the center position of y
j
and ypop
j
is the population number of y
j
. For each possible
position x
i
, function Range(x
i
,E
bound
) is used to get
its reachable range R
i
, where E
bound
is the energy
bound constraint. This range can be obtained by
the software tool EVRE, which is implemented
based on Google Maps Javascript API. Define
Z
ik
= (Z pos
ik
,Z pop
ik
) as the kth ZIP code zone
covered by range R
i
, where Z pos
ik
is the center
position and Z pop
ik
is the population number. Then
we can get the following optimization model for
maximizing reachable households.
0 200 400 600 800 1000 1200 1400 1600 1800 2000
0
10
20
30
40
50
60
Time(s)
Velocity(mph)
Figure 1: FTP-75 Driving Cycle.
Maximize
Z
i
∑
k
Z pop
ik
subject to x
i
∈ X = {x
1
,...,x
N
}
y
j
∈ Y = {y
1
,...,y
M
}
R
i
= Range(x
i
, E
bound
)
Z
i
= {Z
ik
|Z
ik
∈ Y and Z pos
ik
∈ R
i
}
i = 1,...,N; j = 1, . . . , M; 1 ≤ k ≤ M
(8)
Model (8) is easy to implement, but only the cen-
ter position is used to represent the whole ZIP code
zone, which may cause errors when the center lies
near the boundary of the range. To obtain a more ac-
curate, implementable and computable optimization
model, each ZIP code zone can be further divided into
subareas.
4 SIMULATION RESULTS
4.1 Reachable Range Estimation
The electric vehicle reachable range estima-
tion(EVRE) software tool is implemented based on
the Google Maps API (Google, ) by applying the
energy model we constructed.
To estimate the reachable range, the driving dis-
tance, elevation data and velocity information are
needed. The driving distance and elevation data along
the route between two positions on Google Maps can
be obtained directly using the corresponding APIs.
FTP-75 driving cycle in Figure 1 is used to mimic the
driving velocity for EVs in the urban area, which are a
series of tests defined by the US Environmental Pro-
tection Agency (EPA). It consists of starting with a
cold engine and making 23 stops over a period of 31
minutes for an average speed of 20 mph and with a
top speed of 56 mph. The average velocity derived
from the driving distance and duration information is
used for the suburban area. With this data, the energy
consumption can be calculated by applying the energy
model.
Given the energy constraint, the reachable range
is represented by a polygon and a breadth-first search
SMARTGREENS2014-3rdInternationalConferenceonSmartGridsandGreenITSystems
152
method is used to estimate it by determining its ver-
tices. In each search step, a set of positions on one cir-
cle serves as the possible origins and the charging sta-
tion position is the destination. Each pair (origin and
destination) has its corresponding energy consump-
tion value. Comparing them with the energy con-
straint is done to judge whether these positions can be
the vertices of the reachable range polygon. Differ-
ent radii of the circles for these possible positions are
used in different steps. Once all the vertices are found,
the searching process is complete and the reachable
range is determined.
Tesla Model S is selected as the electric vehicle
prototype. Its mass is 2108 kg, frontal area is 2 m
2
,
drag coefficient is 0.24, rolling resistance coefficient
is 0.01, battery capacity is 85 kWh and nominal range
is 265 mile.
Boulder, Co and New York City are selected as the
example areas. These two cities have different ter-
rains. Boulder is a small city with many mountains
on the westside with drastic elevation changes. New
York City is a metropolis with a complicated street
system and less elevation changes. Since our model
considers the real driving distance and elevation, the
reachable range is expected to be totally different.
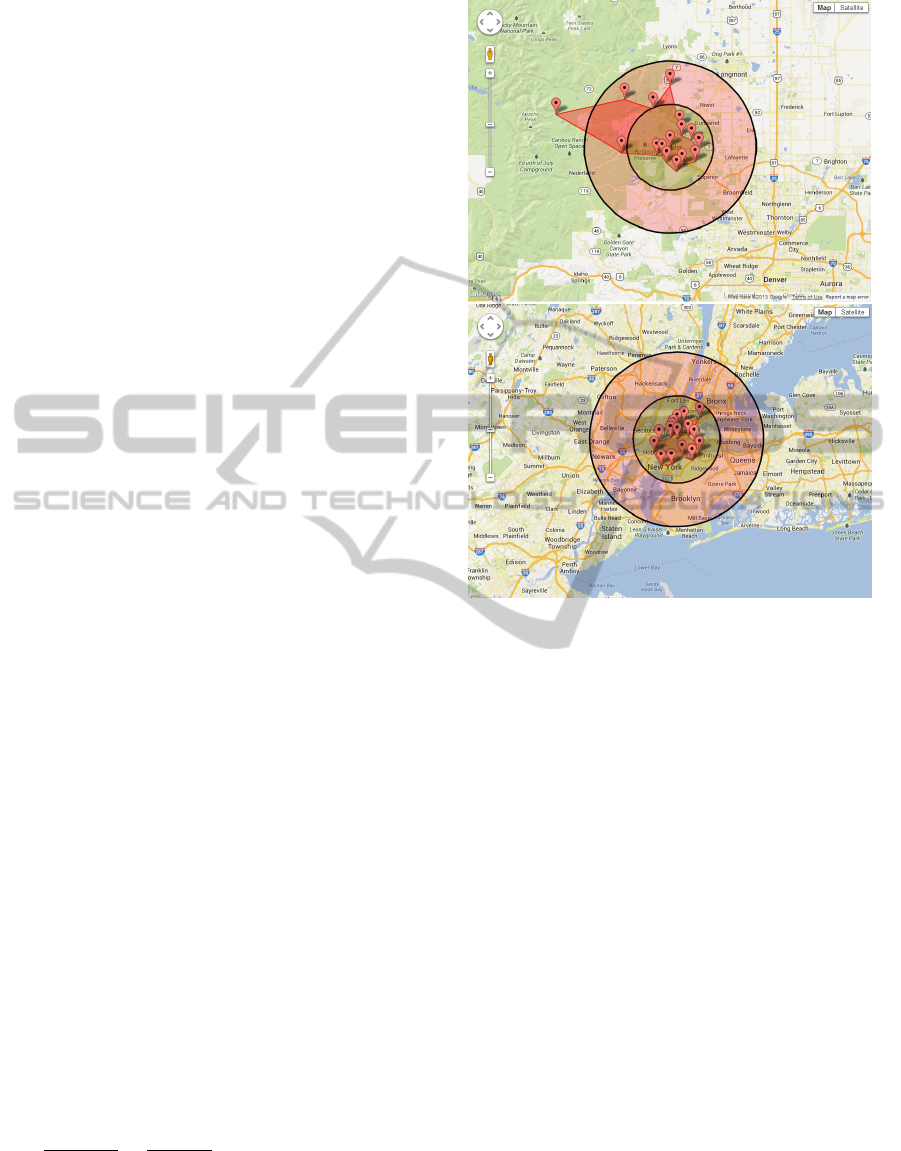
Given the battery energy bound 2 kWh, the reach-
able range (charging station is marked as the center
and serves as destination) in Figure 2 is derived using
EVRE. Both of the ranges are unsymmetric, because
different driving directions have different routes and
elevation in both cities. Figure 2 shows that the reach-
able range in Boulder is much larger than in New York
City. There are at least two reasons for it. First, the
driving direction is from positions outside of the city
center. In Boulder, there are many downhill routes,
which casuses the EVs to have a larger driving range,
because the EV’s regenerative braking plays a dom-
inant roll. While in New York City, there is less
potential energy reused with little elevation change.
Second, New York City’s complicated street system
makes the EV’s velocity more like the FTP-75 cy-
cle. There are many accelerations and decelerations,
which will be a large energy cost. Hence, under the
same energy bound constraint, the reachable range in
New York is much smaller than in Boulder.
Figure 2 also shows the comparison results with
the Euclidean model. The Euclidean model is typi-
cally calculated using the following method.
Range
Capacity
=
265mile
85kW h
= 3.12mile/kWh
Two concentric circles are set in Fig. 2, one with
radius 3.12 miles, the other with radius 6.24 miles
for a energy bound of 2 kWh. The reachable range
Figure 2: Top:Reachable range estimation(2kWh)in Boul-
der Bottom:Reachable range estimation(2kWh)in New
York.
derived from EVRE is significantly different from
the range created by the Euclidean model. Because
driving distance and elevation data are considered,
our model and software can provide a more accurate
range for EVs than the Euclidean model.
The intersection area is shown in Figure 3, the
red coverage is obtained by traveling from the subur-
ban area to the charging station center in the city; the
blue coverage is obtained by traveling in the opposite
direction. The elevation is changed when the route
direction is reversed, which makes the energy con-
sumption unsymmetric with regard to direction, espe-
cially in Boulder. There are many other factors that
change, for example, the route choice(there are many
one-ways in New York.) Hence we can get two differ-
ent coverage areas. From Figure 3, we can see that the
difference in Boulder is much larger than that in New
York. This shows the elevation change is responsible
for the energy consumption difference when reversing
the driving direction. The intersection for these two
coverage areas is where EVs can commute between
its position and the charging station by using up to 2
kWh energy. The intersection area should be the real
coverage range for the corresponding charging station
EnergyConsumptionModelandChargingStationPlacementforElectricVehicles
153
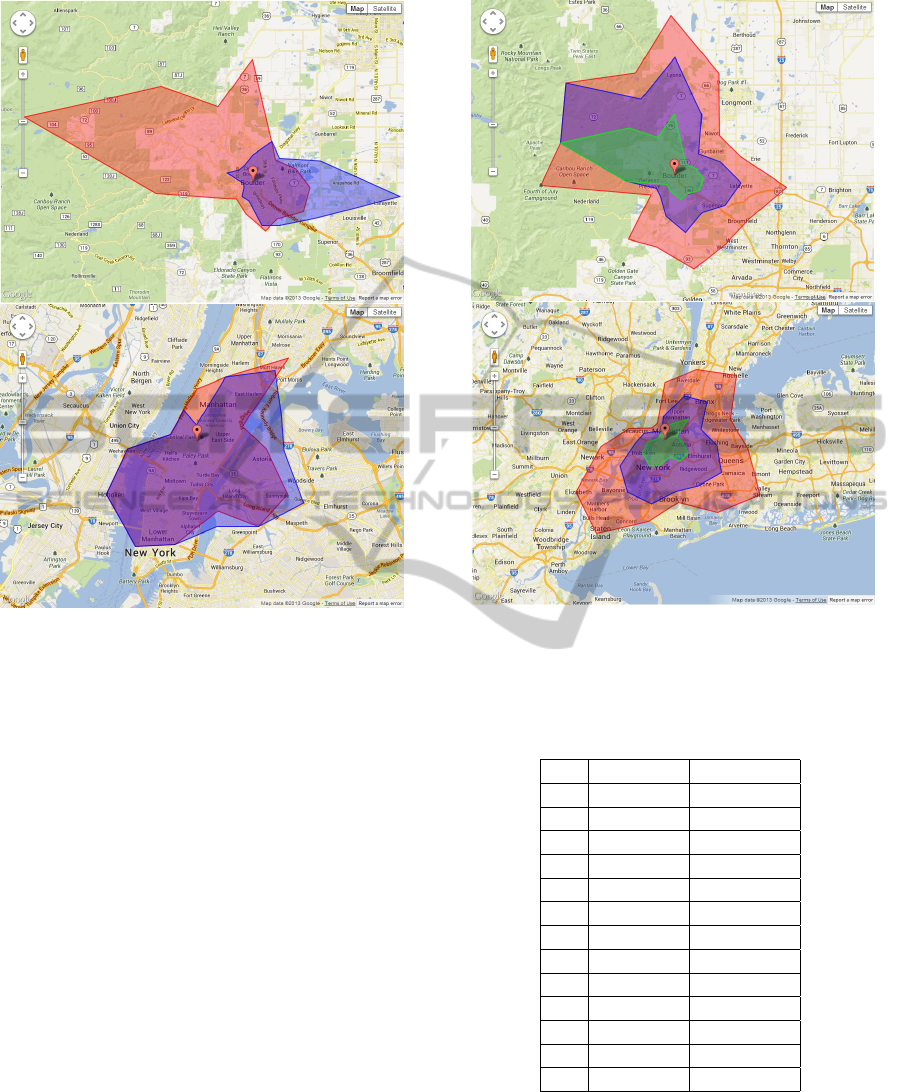
Figure 3: Top:Intersection Area in Boulder(2kWh) Bottom:
Intersection Area in New York(2kWh).
considered by the EV owner.
Figure 4 shows the results with different energy
radii for these two cities. Each coverage area repre-
sents a reachable range with the given amount of en-
ergy. Three kinds of energy radii are considered: 2
kWh, 3 kWh and 4 kWh. Figure 4 shows that these
coverage areas are no longer concentric circles, they
become irregular and the resulting polygons are not
similar for the different energy levels.
4.2 Charging Station Placement for
South Bend
South Bend, IN, a midsize city in the US, is selected
as a showcase area. As stated in the optimization
model (8) , to model the population distribution, the
area can be divided according to ZIP codes. There
are 13 ZIP codes in South Bend area, which means
M = 13. Table 1 includes the ZIP codes and their
corresponding population information. For possible
charging station positions, five possible places are se-
lected as examples, which means N = 5. They are
listed in Table 2. We need to choose one for these five
possible positions to maximize the reachable popula-
Figure 4: Top: Energy radius in Boulder, Bottom: En-
ergy radius in New York (Green: 2kWh, Blue: 3kWh, Red:
4kWh).
tion.
Table 1: Population Distribution in South Bend.
Y ZIP Code Population
y
1
46544 30695
y
2
46545 28445
y
3
46556 7424
y
4
46601 8460
y
5
46613 11526
y
6
46614 27041
y
7
46615 16905
y
8
46616 6431
y
9
46617 11644
y
10
46619 22489
y
11
46628 25319
y
12
46635 4172
y
13
46637 13829
With these ZIP codes and their population infor-
mation, EVRE is used to calculate the covered popu-
lation for each possible position. The energy bound
E
bound
for the reachable range is 2 kWh. Figure 5
shows the coverage of two possible charging station
positions, one is the Century Center and the other is
SMARTGREENS2014-3rdInternationalConferenceonSmartGridsandGreenITSystems
154
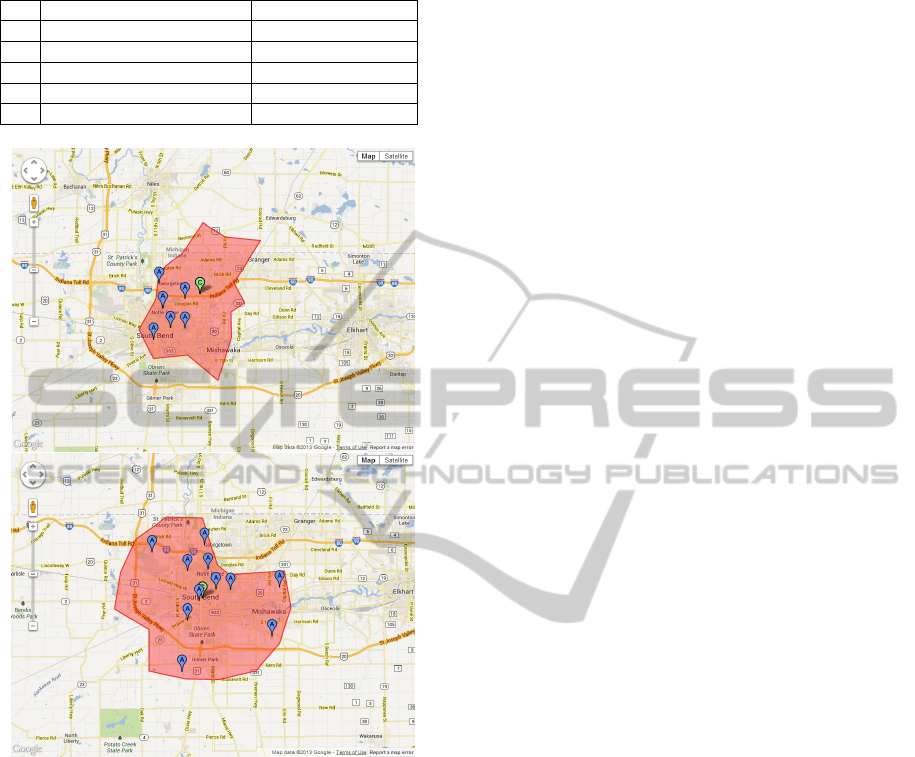
Table 2: Charging Station Placement in South Bend.
X Possible Position Covered Population
x
1
Century Center 187719
x
2
University of Notre Dame 97310
x
3
McKinley Town Center 125702
x
4
University Park Mall 62434
x
5
South Bend Airport 74225
Figure 5: Coverage Range in South Bend, IN. Top: Univer-
sity Park Mall, Bottom: Century Center
the University Park Mall. The Blue markers are the
centers of the covered ZIP code zones, and the green
markers are the charging station positions. From Fig-
ure 5, we can see that they have different reachable
ranges and will cover different ZIP code zones. After
we know the covered ZIP code zones, we can calcu-
late the corresponding covered population. The cov-
ered population is listed in Table 2.
From the results in Table 2, we can see that Cen-
tury Center has the largest covered population, which
means that under this gain function and the 2 kWh
battery energy bound constraint, it is the best position
to place the charging station among these five possible
positions.
5 CONCLUSION
In this paper, a detailed energy consumption model
for EVs has been introduced. It includes a vehicle
as well as an infrastructure model aided by Google
Maps. The combination of these two models allows
to predict vehicle driving range in any geographic lo-
cation supported by google maps. A software tool
(EVRE) was developed that accurately predicts this
driving range from a specified starting point or to a
specified destination. In a second step, this software
tool was used to solve the problem of optimally plac-
ing charging stations, with the goal to reach the max-
imum number of households. EVRE allows to solve
this problem efficiently. In addition, the developed
concept allows to perform other types of charging sta-
tion optimizations and can take a number of practical
constraints into account. In fact constraints such as
power infrastucture, popular parking destinations, en-
ergy constraints, etc. can easily be incorporated to
narrow down the initial search space for candidate lo-
cations of charging stations.
ACKNOWLEDGEMENTS
We acknowledge gratefully the support of NSF grant
# 1239224.
REFERENCES
Andrews, M., Dogru, M. K., Hobby, J. D., Jin, Y., and
Tucci, G. H. (2013). Modeling and optimization for
electric vehicle charging infrastructure.
Chen, T. D., Kockelman, K. M., Khan, M., and Modeler,
T. (2013). The electric vehicle charging station lo-
cation problem: A parking-based assignment method
for seattle. In Transportation Research Board 92nd
Annual Meeting, number 13-1254.
Dickerman, L. and Harrison, J. (2010). A new car, a new
grid. Power and Energy Magazine, IEEE, 8(2):55–61.
Feng, L., Ge, S., and Liu, H. (2012). Electric vehicle charg-
ing station planning based on weighted voronoi dia-
gram. In Power and Energy Engineering Conference
(APPEEC), 2012 Asia-Pacific, pages 1–5. IEEE.
Frade, I., Ribeiro, A., Gonc¸alves, G., and Antunes, A. P.
(2011). Optimal location of charging stations for
electric vehicles in a neighborhood in lisbon, portu-
gal. Transportation Research Record: Journal of the
Transportation Research Board, 2252(1):91–98.
Ge, S., Feng, L., and Liu, H. (2011). The planning of
electric vehicle charging station based on grid parti-
tion method. In Electrical and Control Engineering
(ICECE), 2011 International Conference on, pages
2726–2730. IEEE.
EnergyConsumptionModelandChargingStationPlacementforElectricVehicles
155

Google. Google maps javascript api v3.
https://developers.google.com/maps/documentation
/javascript/tutorial.
Hayes, J. G., de Oliveira, R. P. R., Vaughan, S., and Egan,
M. G. (2011). Simplified electric vehicle power train
models and range estimation. In Vehicle Power and
Propulsion Conference (VPPC), 2011 IEEE, pages 1–
5. IEEE.
Ip, A., Fong, S., and Liu, E. (2010). Optimization for
allocating bev recharging stations in urban areas by
using hierarchical clustering. In Advanced Informa-
tion Management and Service (IMS), 2010 6th Inter-
national Conference on, pages 460–465. IEEE.
John, M. A. M. K. D., Tucci, D. H. G. H., and Jin, Y. Mod-
eling and optimization for electric vehicle charging in-
frastructure.
Koyanagi, F., Uriu, Y., and Yokoyama, R. (2001). Possibil-
ity of fuel cell fast charger and its arrangement prob-
lem for the infrastructure of electric vehicles. In Power
Tech Proceedings, 2001 IEEE Porto, volume 4, pages
6–pp. IEEE.
Koyanagi, F. and Yokoyama, R. (2010). A priority order so-
lution of ev recharger installation by domain division
approach. In Universities Power Engineering Con-
ference (UPEC), 2010 45th International, pages 1–8.
IEEE.
Lam, A., Leung, Y.-W., and Chu, X. (2013). Electric vehicle
charging station placement. In Smart Grid Communi-
cations (SmartGridComm), 2013 IEEE International
Conference on, pages 510–515. IEEE.
Momtazpour, M., Butler, P., Hossain, M. S., Bozchalui,
M. C., Ramakrishnan, N., and Sharma, R. (2012).
Coordinated clustering algorithms to support charging
infrastructure design for electric vehicles. In Proceed-
ings of the ACM SIGKDD International Workshop on
Urban Computing, pages 126–133. ACM.
Prins, R., Hurlbrink, R., and Winslow, L. (2012). Electric
vehicle energy usage modeling and measurement. In-
ternational Journal of Modern Engineering, 13(1):5–
12.
Sweda, T. and Klabjan, D. (2011). An agent-based decision
support system for electric vehicle charging infras-
tructure deployment. In Vehicle Power and Propulsion
Conference (VPPC), 2011 IEEE, pages 1–5. IEEE.
Wang, Z., Liu, P., Cui, J., Xi, Y., and Zhang, L. (2013).
Research on quantitative models of electric vehicle
charging stations based on principle of energy equiva-
lence. Mathematical Problems in Engineering, 2013.
Xi, X., Sioshansi, R., and Marano, V. (2013). Simulation–
optimization model for location of a public electric
vehicle charging infrastructure. Transportation Re-
search Part D: Transport and Environment, 22:60–69.
SMARTGREENS2014-3rdInternationalConferenceonSmartGridsandGreenITSystems
156
