
Energy Monitoring and Management Methodology for the
Banking Sector
Portuguese Case Study
A. M. Carreiro
1,2
, J. Estima
1
and A. Bernardes
1
1
Institute of Systems Engineering and Computer at Coimbra – INESCC, Coimbra, Portugal
2
ISA – Intelligent Sensing Anywhere, S.A., Coimbra, Portugal
Keywords: Energy Efficiency, Smart Buildings, Monitoring & Control.
Abstract: This paper addresses the problem of the worldwide electricity consumption increase, namely in the building
sector, with the focus on the office (banking) market segment. Buildings are dynamic entities, with
constantly changing needs and occupancy. An energy audit shows only a snapshot of the building profile
because it is driven at a specific time, and utility bills can be viewed as “rear-view mirror” since they only
show past consumptions and not real-time consumptions. In this way, this paper presents an energy
monitoring and remote management methodology for the banking sector and the case study accomplished in
one of the most well established Portuguese banks. The presented methodology reached measured annual
savings of 18,5% of the total consumption of the 19 central buildings and the 358 branches involved in the
project.
1 INTRODUCTION
The Kyoto Protocol to the United Nations
Framework Convention on Climate Change
(UNFCCC) was an environmental treaty with the
goal of preventing "dangerous" anthropogenic (i.e.,
human-induced) interference of the climate system.
As part of the Kyoto Protocol, many developed
countries agreed to legally binding
limitations/reductions in their emissions of
greenhouse gases (Walker et al., 2007).
Cities play a crucial role in sustainable
development. According to the United Nations,
global population will reach 9 billion in 2050, of
which majority will live in cities. The majority of
European cities have already been acting to increase
their energy efficiency. Continuing improvements
will require strong actions, in particular through
improving the existing building stock.
According to IEA’s World Energy Outlook
2008, 67% of global energy is used in urban areas,
and cities are responsible for 76% of energy related
CO2 emissions. Furthermore, cities play an essential
part in sustainable development; with UN estimates
of global population reaching 9 billion from 2050, of
which the majority will live in urban areas. The
majority of European cities have already been acting
to raise their energy efficiency. Ongoing
developments will require solid actions, in particular
through tracking the current building stock
(International Energy Agency, 2008).
According to Eurostat, the annual energy
consumption in EU27 countries is about 3 400 TWh
of electricity and 2 600 000 TJ of heat. Of these,
about 25% of electricity and 10% of heat is
consumed in the Commercial and Public Service
sector, mostly in buildings (Eurostat, 2009). A
saving potential estimated in nearly 28% of Europe’s
total energy consumption has been recognized as
being accessible through increasing in energy
efficiency (Eurostat, 2009). The European Union has
specified that Public Building must lead the way in
cultivating energy efficiency habits which have an
unquestionable role in motivating savings.
Bank facilities – both buildings and branches –
are nowadays subject to intense energy usage,
because they operate many hours a day, and include
an increasing number of equipment and systems.
Bank branches can be responsible for up to 50% of
total consumption in a retail bank since they are
attended by multiple users, with different habits and
customs, different terms of services in facilities and
inefficient behaviors in energy usage users
(characteristic user that don’t pay the electricity bill)
(Evo-world).
157
M. Carreiro A., Estima J. and Bernardes A..
Energy Monitoring and Management Methodology for the Banking Sector - Portuguese Case Study.
DOI: 10.5220/0004860501570162
In Proceedings of the 3rd International Conference on Smart Grids and Green IT Systems (SMARTGREENS-2014), pages 157-162
ISBN: 978-989-758-025-3
Copyright
c
2014 SCITEPRESS (Science and Technology Publications, Lda.)
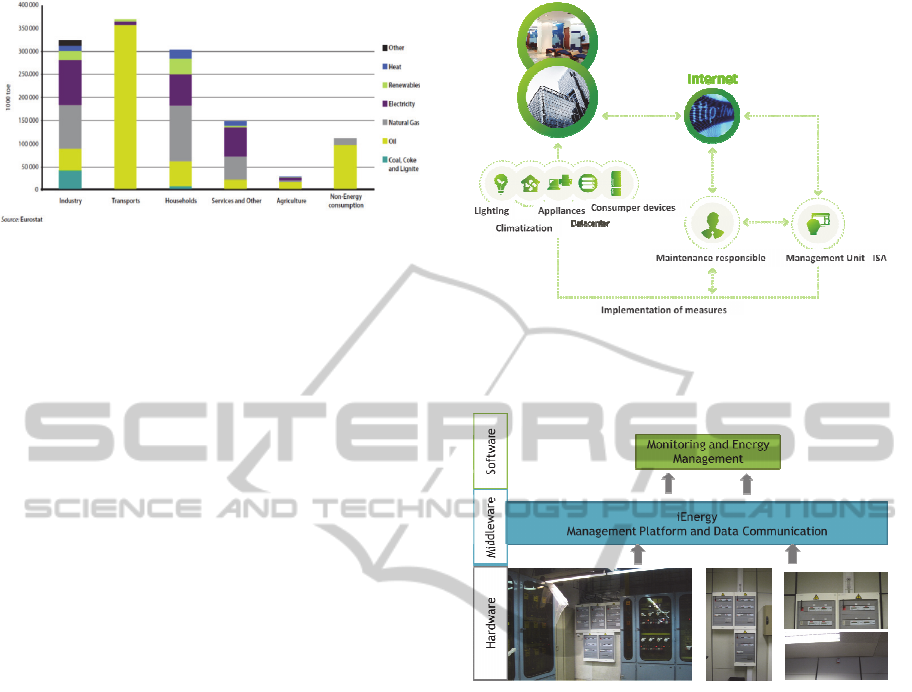
Figure 1: Europe’s energy consumption by fuel and end-
use sector (CEC, 2010).
Banks can seek in this reality an opportunity to
reduce thei0r energy consumptions and respective
costs. Advanced metering and management
solutions can enable banks to identify energy, cost
and carbon savings by providing detailed
information about the way in which they use their
energy.
In this way, and under a policy of continual
sustainability, was designed a project and developed
a real-time energy monitoring and management
methodology for an international Portuguese bank,
which covered 19 buildings and 358 selected
branches in a total of 830 facilities. The main
objectives were:
Reduce energy consumption in office buildings
and branches;
Centralize the energy management information;
Introduce and establish policies of energy
consumption;
Change employees behavior for proper use of
energy resources at their disposal;
This paper will present in section 2, the global
architecture, the energy monitoring and management
solution developed for the banking sector. In section
3 will be presented the methodology of the project,
following by the section 4 where will be presented
the case study results, and finally in section 5 the
main conclusions.
2 GLOBAL ARCHITECTURE
This section will show the global solution
architecture, as well as, the main components that
constitute, as can be seen in Figure 2 and 3. This
solution methodology allows gathering detailed
information, realize where energy is being consumed
(remotely and in real time), and identify anomalous
situations of energy consumption is shown in the
figure below:
Figure 2: Scheme of the methodology implemented in the
bank facilities, the flow of the information and the relation
between the components
Figure 3: Global solution architecture.
The solution is divided in three main
components: Hardware, Middleware and Software.
Hardware. The iHub is multifunctional data logger
and gateway equipment used in energy monitoring
and management solutions, which enables to collect
data and remotely manage other equipment. One of
the main advantages of this device is that it doesn’t
require permanent connection to the internet. The
iHub has the ability to store collected data during a
variable time period and send it to server when at
programmed time frames our when network is
available. This gateway receives data from two
different protocols:
- RS 485 MHz (Modbus RTU) - from the iMeter
Rail, which enables awareness in consumption,
since it includes a LCD display providing the
consumer with power status and the reading
regarding specific circuits within an electrical
switchboard. The single phase and three-phase
mounted meters are integrated in a standard
meter and are widely used in small enclosure and
switch gears.
SMARTGREENS2014-3rdInternationalConferenceonSmartGridsandGreenITSystems
158

- RF 868 MHz – from the iPoint, a comfort sensor
that measures different environmental variables,
such as, temperature and relative humidity, and
communicate using wireless technologies to the
iHub.
Middleware. The middleware is a management and
communication platform (iEnergy). iEnergy is a
middleware platform that can be used to remotely
monitor electrical consumptions. The platform is
able to receive data readings from thousands of units
of hardware placed in several different geographical
locations. The kinds of readings that are received
vary from device to device. For example in the case
of electricity one could expect to receive readings
regarding the energy consumed (kW) among others.
iEnergy receives these data, stores it and processes it
providing its clients with higher level analytics.
Besides calculating and storing these analytics, the
platform also provides a web interface that allows
other systems to import these data into their domain.
Software. The end-user software, KiSense, is
monitoring software for energy management,
designed to help companies reduce energy
consumption and associated costs. It consists of an
integration platform for all energy consumption data,
with a simple and intuitive interface. Accessible
anywhere, KiSense supplies and analyses energy
consumption, in real time, offering to end-users
relevant information and knowledge for appropriate
decision-making regarding energy consumption in
the bank, in order to influence energy behaviour
transformation.
Some of the main functionalities of KiSense are:
Data explorer – Analyse and perform operation
on energy consumption data, knowing when,
how and where energy is consumed. It is
possible to compare consumption of different
areas and installations.
Alarms – Define when and how to be warned of
anomalous occurrences, such as excessive
consumption, consumption out of defined
timetable and consumption exceeding defined
objectives.
Events – Signal the key moments of energy
consumption by scheduling relevant behaviours.
Savings – Define saving goals and permanently
keep up with its evolution, using alerts when
they are not being achieved and it is possible to
visualize the gains obtained through specific
implemented measures.
Reports – Obtain periodic reports for a better
monitoring of energy consumption.
Tariff rates - Analyses consumption patterns by
periods of time and obtain fundamental data, in
order to choose the best tariff plan, reports of
consumption according to period of time.
Control – Remotely control equipment and
circuits, scheduling periods and parameters,
switching on and off remotely.
3 METHODOLOGY
To meet the needs and challenges of the bank, it was
developed an energy efficiency project focused on
the architecture explained above which enabled the
maintenance responsible of the bank to:
Know when, where and how energy is
consumed;
Define KPI (Key Performance Indicators)
regarding their business;
Estimate energy costs;
Analyse consumption values;
Define measures and actions in order to achieve
savings;
Check the effects of implemented measures;
Compare areas and facilities;
Define alarm mechanisms for anomalous
situations, excessive consumption or
underachievement of reduction goals;
Remotely control equipment (in real time or
scheduled);
Integrate systems installed in a single energy
management platform (HVAC, GTC, BMS,
etc.);
In this way the project was developed in six main
stages:
1st Stage – Detailed specification of the EMS
(Energy Management System)
2nd Stage - Installation of the monitoring and
management solution
In this stage the monitoring and management
solution was installed in all 19 office buildings and
358 selected branches. The solution was composed
by:
Meters and sensors to monitor the energy
consumption and environment parameters
(temperature and humidity), with the capacity to
control and actuate remotely over the equipment;
3rd Stage – Energy Auditing. In this stage an energy
survey was executed for all office buildings and
representative branches. The energy survey resulted
EnergyMonitoringandManagementMethodologyfortheBankingSector-PortugueseCaseStudy
159
in audit reports, with conclusions to reduce energy
consumption, carbon footprint and costs.
4th Stage – Design of the best practices guide and
the communication program to the bank employees
5rd Stage – Energy Data analysis. In this stage, the
data collected by the energy monitoring system were
analyzed, in order to, identify opportunities for
energy savings based on the electricity bill provided
by EDP – Energias de Portugal.
6rd Stage – Energy Management. The
implementation of the actions indicated in the audit
reports were implemented, managed and supervised,
and mensal reports of activities and energy savings
and cost saving were delivered.
Besides that, training was given to the maintenance
responsible of each building and branches, and a
behavior campaign was created in order to promote
energy behavior changing in each user of the
building and branches.
4 RESULTS
Before the project and in order to define this
baseline, the meter of the power distribution
company was used as a start point. The use of this
meter is a requirement of the IPMVP – EVO
(International Performance Measurement and
Verification Protocol), once in the reference period
is the only existing meter (Evo-world).
The International Performance Measurement and
Verification Protocol (IPMVP) is the widely
referenced framework for measurement and
verification (M&V). M&V activities include site
surveys, energy metering, monitoring of independent
variable(s), calculation, and reporting.
During the 5rd and 6rd stage of the project, it
was possible to conclude that simple measures, such
as, remote control in HVAC system allowed energy
savings of 32% in this circuit, and approximately 7%
in the total consumption. Measures related to good
practices, energy behaviour, allowed to achieve
average savings of around 15%.
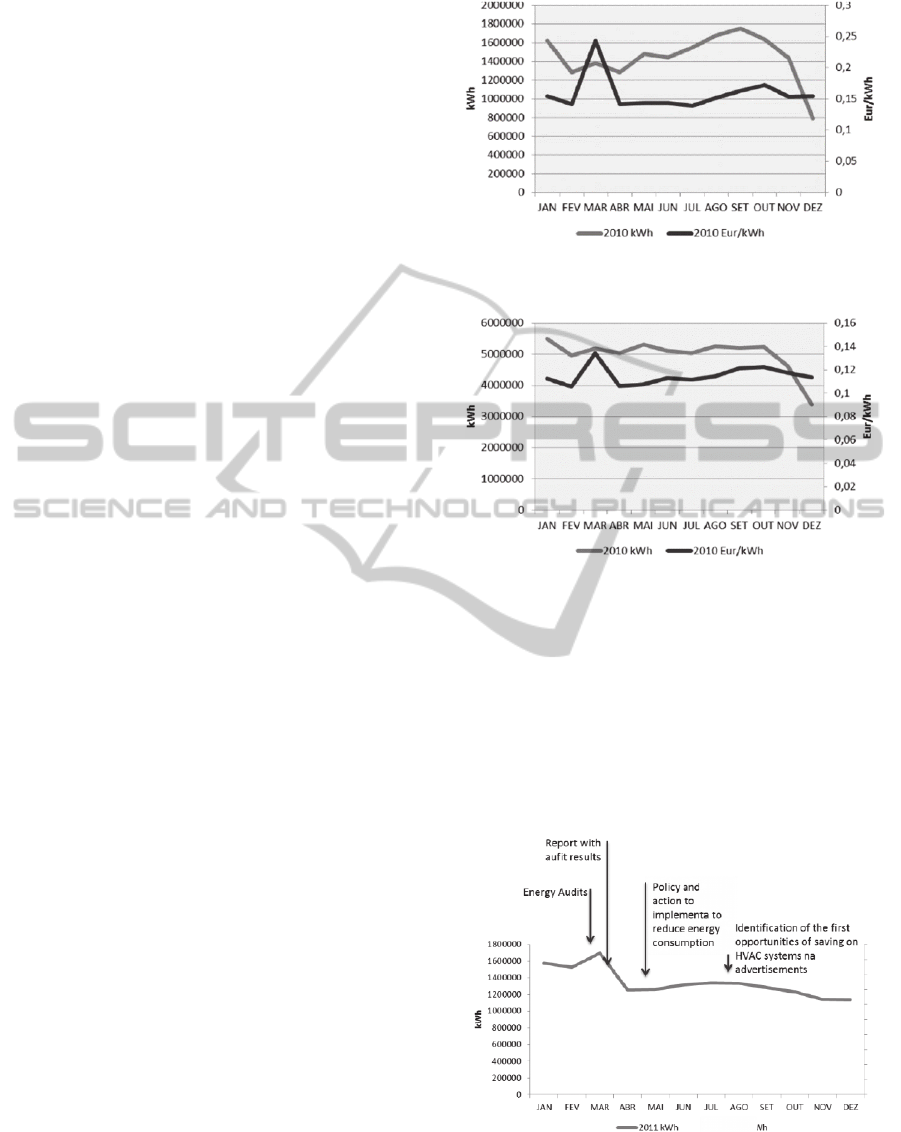
The baseline of 2010 (year before the project),
based on the energy bills, for the 345 branches, can
be seen in Figure 4, and in central buildings, can be
seen in Figure 5.
The total annual consumption of the branches of
the bank in the year of 2012 was 17.325.406 kWh,
with a total cost of 2.746.514 €. The average
consumption per branches was 50.219 kWh with a
cost of 0,16 €/kWh.
Figure 4: Energy consumption and energy cost –
Branches.
Figure 5: Energy consumption and energy cost – Central
Buildings.
The total annual consumption of the central
buildings of the bank in the year of 2010 was
59.794.853 kWh, with a total cost of 6.877.587 €.
The average consumption per central building was
3.321.936 kWh with a cost of 0,11 €/kWh.
In the year of 2011, after the 3st stage of the
project, it can be seen a reduction of the energy
consumption equivalent to 26%:
Figure 6: Energy consumption of branches in 2011.
The total annual consumption of the branches of
the bank in the year of 2011 was 16.085.602 kWh,
with a total cost of 2.643.174 €. The average
SMARTGREENS2014-3rdInternationalConferenceonSmartGridsandGreenITSystems
160
consumption per branches was 3.885kWh with a
cost of 0,16€/kWh.
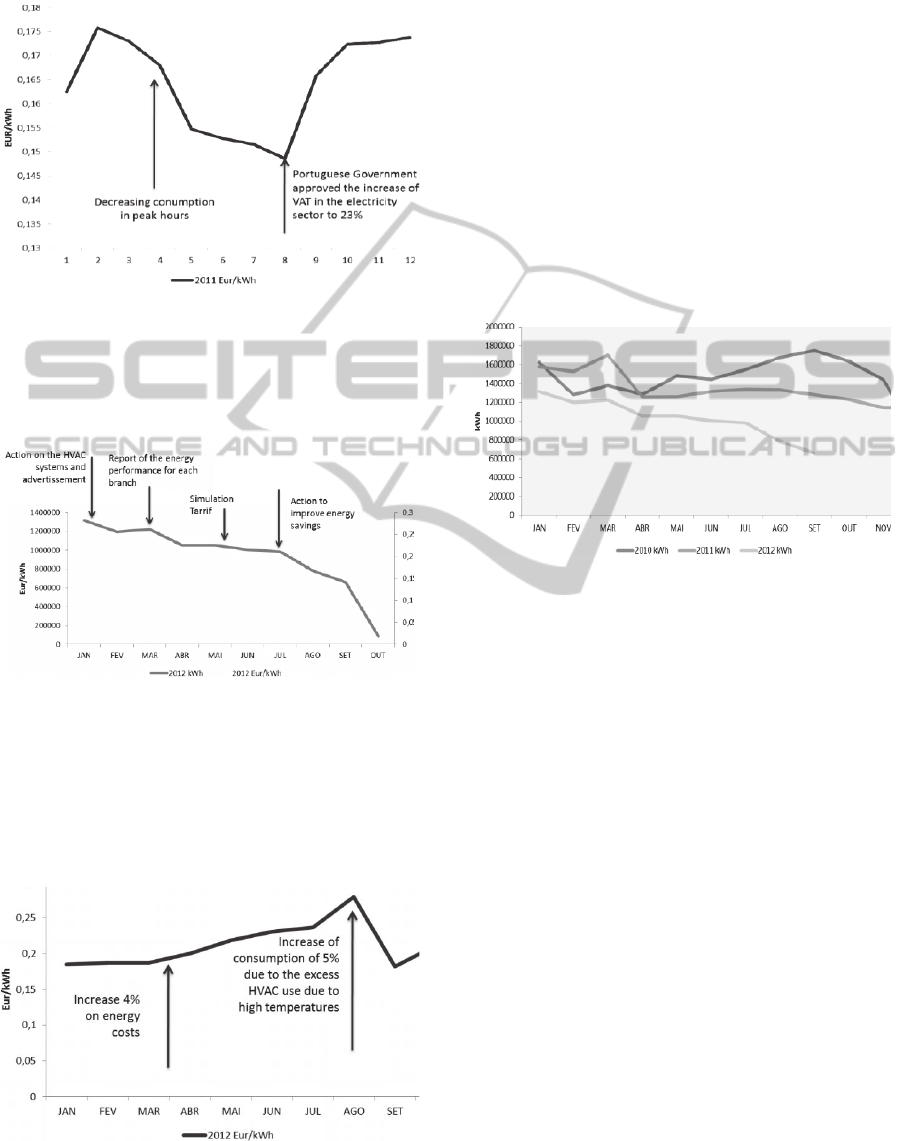
Figure 7: Cost of energy spent in branches in the year of
2011.
In the year of 2012 (until September) was clearly
identified the consumption reduction, as can be seen
below:
Figure 8: Energy consumption on branches in 2012 (until
September).
The total annual consumption of the branches of
the bank in the year of 2012 was 9.271.562 kWh,
with a total cost of 1.939.632 €. The average
consumption per branches was 2.986kWh with a
cost of 0,18 €/kWh.
Figure 9: Cost of the electricity bill for branches in 2012.
At the end of March 2012 the Portuguese
regulator for the energy services approved a gradual
increase of 4% in costs with active energy
consumption. This is the reason for the increasing
average cost of the energy despite of the
consumption reduction.
The Figure 10 represents the reduction on the
energy consumption along the three-year project.
Comparing 2010 to 2011 the energy saving was
1.239.804 kWh (7,16%) with a cost saving of
103.341 €, equivalent to 3,76%, including the
increase of VAT on the electricity tariffs.
Comparing 2 years, from 2010 to 2012 the
energy saving was 4.192.089 kWh (31%) with a cost
saving of 183.062 €, equivalent to 8,6%, including
the increase of VAT on the electricity tariffs.
Figure 10: Energy consumption of the branches in 2010,
2011, 2012.
With the implementation of this solution it’s
possible to achieve direct benefits and indirect
benefits.
The direct benefits are:
Energy cost reduction;
Central management of all facilities;
Greater efficiency in management of
maintenance equipment, and consequent increase
of its lifetime;
Definition of energy regulations, according to
consumption profiles;
Reinforcement of sectors sustainability policies
along energy efficiently and carbon footprint
reduction
The indirect benefits are:
Improved corporate image with stakeholders –
corporate sustainability and eco brand;
Improve working conditions for staff: air quality,
lighting conditions, etc;
Improve ecological awareness of staff.
EnergyMonitoringandManagementMethodologyfortheBankingSector-PortugueseCaseStudy
161

5 CONCLUSIONS
Monitoring energy use can provide up-to-date
information on energy use and carbon emissions so
companies can identify energy conservation
measures, adjusts usage quickly, and reallocate
savings where needed. The solution for energy
monitoring and remote management presented in
this paper can monitor building energy efficiency
and actively look for opportunities to further energy
saving opportunities.
Evaluate and measure continuously the energy
consumption in the banking sector to know how
much, where and how energy is consumed, it is
essential to evaluate waste properly, the
inefficiencies and priorities, in order to reduction the
energy consumption.
The geographical dispersion and diversity of
bank facilities was a pressing concern. It prevented a
correct vision of reality, whether in branches,
whether in headquarters, particularly regarding the
value of energy consumption, the terms of supply
contracts, disparities in consumption patterns, peaks
of consumption, etc.
In order to meet the different needs identified,
ISA installed equipment’s network and energy
consumption monitoring and management software.
The results obtained increased efficiency
significantly and enabled the implementation of
measures that, without further investments, led to a
major reduction in consumption and an investment
payback of less than 2 years.
ACKNOWLEDGEMENTS
This work has been partially supported by FCT
under project grants PEst-OE/EEI/UI0308/2014 and
MIT/SET/0018/2009. Also, it has been framed under
the Energy for Sustainability Initiative of the
University of Coimbra and supported by Energy and
Mobility for Sustainable Regions Project CENTRO-
07-0224-FEDER-002004.
REFERENCES
Walker, S.; Hipel, K. W.; Inohara, T., "Strategic analysis
of the Kyoto Protocol," Systems, Man and
Cybernetics, 2007. ISIC. IEEE International
Conference on , vol., no., pp.1806,1811, 7-10 Oct.
2007 doi: 10.1109/ICSMC.2007.4413880
International Energy Agency (2008). World Energy
Outlook. Paris, France. ISBPN: 97892 6404560-6.
Eurostat – European Communities, Energy Balance Sheet
2006-2007 (2009), Luxembourg, ISSN: 1830 7558.
Commission of the Europe Communities, Action Plan for
Energy Efficiency: Realising the Potential
(19.10.2006) and Security (CIS), 2010 International
Conference on, vol., no., pp.566,569, 11-14 Dec. 2010
http://www.evo-world.org/index.php?lang=en
SMARTGREENS2014-3rdInternationalConferenceonSmartGridsandGreenITSystems
162
