
The Experiment Has Shown
Set Your Own Goal and save Electricity!
Jurek Pyrko and Magdalena Uggmark
Department of Energy Sciences, Lund University, Lund, Sweden
Keywords: Electricity Saving, Energy Feedback, Energy Visualization, Smart Energy Use.
Abstract: This study describes the final results from so-called “The Experiment - Swedish largest energy saving
experiment” carried out by E.ON Sweden. The purpose of the Experiment was to investigate whether
visualization of electricity consumption in real time would lead to a reduced electricity use. Almost 10,000
customers participated in the project and received displays where they could observe their electricity use.
Over 50% of the participants made an actual electricity saving; for these customers the mean electricity
saving became 8%. At the beginning of the Experiment, participants could set a saving goal and about 22%
of the customers managed to achieve the target. This group saved about 15% of electricity. All the
participants in total had made a saving of 0.7% compared to a control group that had increased their use by
1.5% during the same period. The impact of different factors on the final result was investigated in four
segmentations after space heating type, family composition, level of education and bidding area. Four
surveys were sent out to all participants to investigate their opinions and views on the Experiment. The
interest for possible changes in the service and the willingness to pay for it was also investigated.
1 INTRODUCTION
Power company E.ON Sweden launched, as they
called, “The Experiment - Swedish largest energy
saving experiment” where 10,000 customers partici-
pated and tried on energy feedback technique called
100Koll. The main question of this experiment was
weather the involved households could save
electricity by getting their usage visualized and by
setting up clear saving goals, which was a new way
that has never before been tested in an experiment
on the same scale. Furthermore, this experiment
covered a full year, which is also rare for this type of
investigations.
The Experiment started on February 1st, 2012
and lasted a whole year until January 31st, 2013.
10,000 grid customers of E.ON used home displays
retrieving data from smart meters, giving possibility
to follow household electricity consumption in real-
time. Participants of the Experiment could also log
into a website "My Account" and download a mobile
application to monitor their daily electricity
consumption.
A control group of 2,000 households was
randomly chosen by the energy company among all
the customers in the country (besides bidding area 1
in Northern Sweden - as for the experiment group),
not participating in the Experiment and not being
aware that they were included in the control group in
order to evaluate their energy consumption change
and compare it with the results from households
participating in the Experiment.
1.1 Motivation Events
In order to increase participants' motivation to
change their habits and achieve reduction of
electricity use, five so-called “motivation events”
were planned during the Experiment (E.ON, 2013).
The aim of these actions was to generate interest in
savings, in various ways, and to encourage partici-
pants to try to save even more electricity. Some of
them were connected to TV-commercials, billboards
and advertisements in newspapers all over the
country. The results of these campaigns were
evaluated in two surveys during the Experiment.
The first period started with the motivation case
called "Balance". The participants could download
an application to their smart phones to track the
electricity usage of the households visualized in
Swedish currency instead of kWh, see Figure 1.
179
Pyrko J. and Uggmark M..
The Experiment Has Shown - Set Your Own Goal and save Electricity!.
DOI: 10.5220/0004861401790184
In Proceedings of the 3rd International Conference on Smart Grids and Green IT Systems (SMARTGREENS-2014), pages 179-184
ISBN: 978-989-758-025-3
Copyright
c
2014 SCITEPRESS (Science and Technology Publications, Lda.)
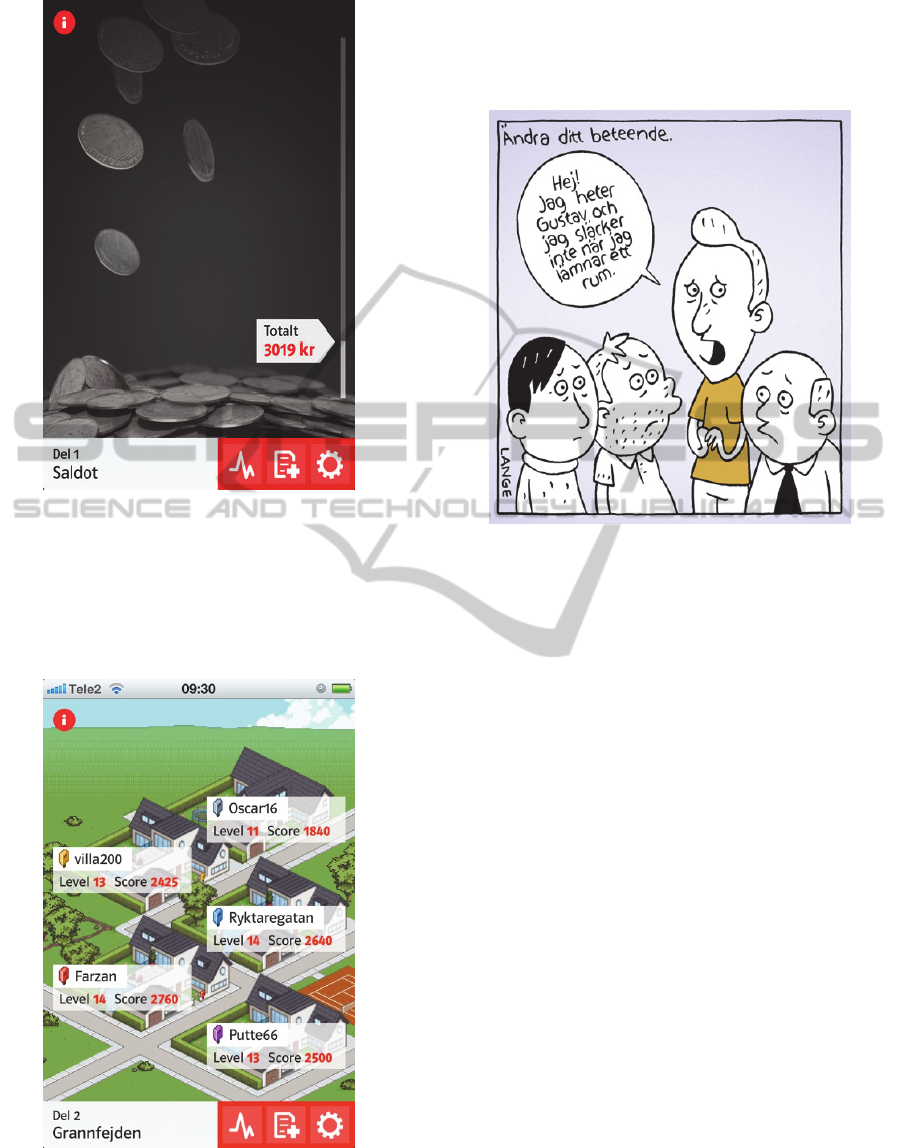
Figure 1: Visualization of the Balance.
Second period was called "Neighbour Feud" and
was a game between neighbours. 5 families in the
neighbourhood could compete with each other to see
who was able to save the most of electricity during
the game, see Figure 2.
Figure 2: The “Neighbour Feud” on a smart phone display.
Then, the "Carrot" was a period during the
Experiment where the households could send in their
saving tips. The best of them were later rewarded
with prizes and some saving tips were illustrated in a
playful manner by cartoonist Henrik Lange (see
Figure 3) and in humoristic TV-advertisements.
Figure 3: Example of energy saving tips from the
motivation booster Carrot - The Anonymous Energy-
holics. (Text: Change your behaviour! “Hej! My name is
Gustav and I don’t turn the light off when I leave a
room.”)
After that, during the autumn 2012, the fourth
motivation case called “General” started. Through a
special app, downloaded from the Experiment’s
website, daily reminders were sent of things possible
to do and with inspiration and challenge to do even
more savings - much like a personal “energy coach”,
see Figure 4.
Finally came the "Bongo", a small creature who
appealed to the Experiment participants’ empathy
being very sad and feeling sick if the family
members did not save electricity, see Figure 5.
The boosting period that was most appreciated
by the participants was the "Balance". They felt that
it helped them the most with their electricity saving
efforts.
The overall interest was quite low for all the
motivation cases. During the interviews it was
revealed that some people felt that motivation cases
were a bit bizarre in an otherwise so important and
serious subject as energy saving. One participant
also pointed out the contradiction in messages in the
game "Neighbour Feud". The more the family saved,
the greater became the house and at last it could end
up with a helipad on the roof of this already very
spectacular building.
SMARTGREENS2014-3rdInternationalConferenceonSmartGridsandGreenITSystems
180
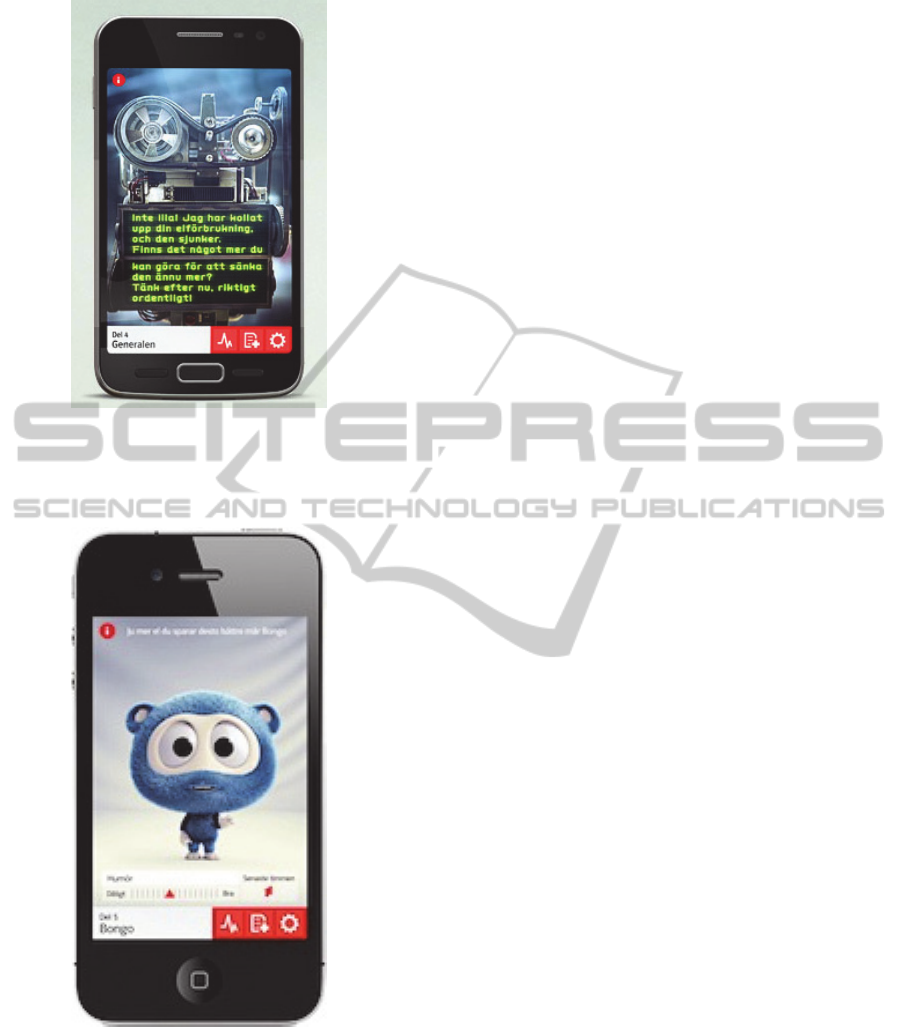
Figure 4: Motivation booster ”The General”. (Text on the
display says: “Not bad! I’ve checked your electricity use
and it’s sinking. Is there something more you can do to
lower it further? Think really carefully now!”).
Figure 5: “Bongo” on a smart phone display.
2 METHODS OF EVALUATION
The scientific evaluation of the whole Experiment
was carried out at the Department of Energy
Sciences at the Lund University and reported in
three publications (Andersson and Larsson, 2012),
(Taimor and Hols, 2013), (Uggmark, 2013).
Electricity consumption during one calendar year
(Feb 1, 2012 - Jan 31, 2013) was compared with
equivalent period 2011-2012. Monthly electricity
consumption data was collected and analysed for
each household showing how the electricity
consumption had changed compared to previous
year. For electrically heated households the data was
corrected for outdoor temperature variations.
A particular methodology was developed by the
authors to calculate electricity savings. The
percentage of electricity used for space heating was
calculated as a difference between electricity use
during winter (October -April) and summer (June-
August) months. Degree-days values were obtained
from the energy company and processed before they
were allotted to the households.
Four web-based surveys and an interview study
with limited amount of households were conducted
during the Experiment in order to examine how the
participants experienced different aspects of the
Experiment - from technology to engagement. The
content and structure of each survey was designed in
cooperation with representatives from the energy
company. The responses from the questionnaires and
the facts about participants of the Experiment were
put together to enable the segmentation of different
test groups. Statistical tests were then performed to
ensure that any differences between groups were
significant and not just a coincidence.
Some specific conditions for participation in the
Experiment were required:
1. the household should be a customer of E.ON;
2. the participants lived in single-family houses;
3. the electricity use was at least 10,000 kWh per
year (which usually means for Swedish
conditions that electricity is used both for space
heating and household needs).
4. the household should decide an electricity saving
target for the coming year (from 1 to 25%).
Totally, over 8.000 households participated actively
in the Experiment. Unfortunately, as the analyses
showed later, about 800 of them had electricity use
below 10,000 kWh per year.
Annual electricity consumption (between Febru-
ary 1, 2012 and January 31, 2013) was compared
with equivalent period year before (February 2011 -
January 2012).
Because of the weather-related changes in heat
demand, the evaluation of electricity savings from
one year to another has to consider how the outdoor
temperature differ between the two years. The space
heating data was corrected for outdoor temperature
TheExperimentHasShown-SetYourOwnGoalandsaveElectricity
181

variations for all electrically heated households
(direct resistive heating, electric furnaces or heat
pumps).
In this way, the electricity savings were defined
as temperature corrected difference between the year
of the Experiment and the year before.
The methodology used for temperature correc-
tion was developed by one of the authors and is
presented in detail in the final report (Uggmark,
2013).
The method used was based on degree-days for
each geographical location and on the assumption
that the electricity use during the summer months
(June to August) might represent the use of
electricity for household purposes and tap hot water
preparation. This electricity was assumed as constant
over the year. In this way the energy consumption
was only adjusted for the part of electricity used for
space heating.
Four web-based surveys were conducted during
the Experiment with responses according to a 6-
grade Likert´s scale. The content and structure of
each survey was designed in cooperation with the
staff from the energy company. The responses from
the questionnaires and the facts about households
were put together to enable the segmentation of
different experiment groups. Each question was
evaluated and the level of “belief” or “scepticism”
was calculated.
Statistical tests were then performed to ensure
that any differences between groups were significant
and not just a coincidence. Kruskal-Wallis test and
Chi2-test were used to examine the significance of
the response results (significance level 0.05).
3 RESULTS
3.1 Electricity Savings
The final result of the Experiment is based on 8,040
participating households. At the beginning of the
Experiment, the participants were asked to decide
the electricity saving target during the coming year.
Of these who actively participated, about 23%
achieved or exceeded their stated energy saving
targets. This group saved about 15% of electricity.
Of the remaining active households, about 34%
saved electricity but stayed below their saving
targets. About 43% of the households even raised
their consumption, in some cases as much as by
70%.
Somewhat over 50% of the households who
participated in the Experiment made some electricity
savings (>0) compared to the year before. Their
average savings were of 8%.
The group “Active households” comprises
households participating actively in the Experiment
by answering surveys (3985 households). This group
as a whole saved 1.68% of power. In this group,
totally 2,203 households saved 8.40% of the
electricity. Those who reached their targets within
this “active” group (886 households) saved 14.88%,
see Table 1.
The analysis made with the same criteria for the
Control group (2,000 households) showed that this
group, on average, increased its use of electricity by
1.50% during the same period.
The fairly similar result was identified for those
participants of the Experiment who did not put up
the saving targets (about 4,000 households) in the
beginning of the Experiment. This group had also
increased the electricity consumption by 0.2%.
Table 1: The final energy savings in the Experiment
(Uggmark, 2013).
Total electricity saving
(+values = saving)
Experiment
group
Control group
All households
0.74%
-1.50%
‘Active’ households
1.68%
-1.50%
‘Active hh’ who
’Saved power’
8.40% 8.33%
‘Active hh’ who
’Reached saving
target’
14.88%
NA
To investigate closer whether different groups
among the participants had better (or worse) electri-
city saving results compared to the others, four
segmentations after “space heating type”, “family
composition”, “level of education” and “bidding
area” (there are 4 such areas in Sweden) were made.
The most noticeable result from the segmen-
tations was that bidding area 4 (Malmö) in the south
of Sweden, usually having higher electricity prices,
had the highest saving of 2% and that bidding area 3
(Stockholm) made a significantly lower savings.
Households within bidding area 2 (Sundsvall)
actually increased their use of electricity with
approximately 0.6%.
3.2 The Participants' Experiences
To collect and evaluate participants' opinions on the
Experiment, four surveys and an interview study
was made. Surveys were sent out to all participants
to investigate their own opinions on for example the
SMARTGREENS2014-3rdInternationalConferenceonSmartGridsandGreenITSystems
182

motivation cases and to study their views on the
Experiment. The interest for possible changes was
also investigated to see what could make the service
more attractive and so was also the willingness to
pay for the service. The survey ended with a
question whether the respondents could consider
participating in an interview. 18 respondents were
later contacted for a short interview so that some
questions could be investigated further.
It appeared that many participants were very
positive about the Experiment. Most of the
households felt that they would benefit from the
equipment in the future and would be very
disappointed if the service disappeared.
In addition, slightly more than half of the
households were willing to pay for the service.
Families with children and those who had reached
their saving target were in slightly higher extent
willing to pay. Not surprisingly - those who reached
their electricity saving target probably had a more
clear view of the benefits.
However, it was quite noticeable that many
households participated in the Experiment not
because of a possibility to save electricity and
money. Many of them were also very interested in
keeping an eye on their own everyday electricity
use. For many households it was the most important
argument. Another example of the reason to partici-
pate in the Experiment was the possibility to be able
to see that the electricity bills were correct. Yet
another one was, for example, the possibility to
remotely watch that everything worked properly in
the summerhouse.
The interest in the motivation cases was proved
not to be very large however “The Balance” was
considered to be the motivation case that had helped
most participants to save electricity.
Finally, an inquiry was made to see how
Facebook had been used during the Experiment and
what kind of saving tips that had been submitted
during the motivation case period “Saving tips”.
Most of all Facebook was used for technical support
and other questions but the interest for this platform
soon declined.
Technical Measures. The Experiment had
influenced many participants to make small changes
in their homes like switching lighting to more
energy efficient but several families had also made
major changes, such as changing heating systems or
installing new white goods.
Approximately 66% of the participants answered
that they had carried out different technical measures
during the Experiment in order to save energy
(Taimor and Hols, 2013).
The responses also indicated that performing
technical measures was preferred rather than change
of the behaviour. Participants also seemed to use the
real-time display 100Koll a lot to ensure that the
measures they had undertaken really resulted in
energy savings.
Behavioural Changes. About 73% of the
participants said in the surveys that they had
changed their behaviour as a way of achieving
energy savings during the Experiment (Taimor &
Hols, 2013).
Again, the answers indicated that the participants
made bigger steps in behavioural adaptation than
they would if they were not involved in the
Experiment.
The survey answers indicated also that the
behavioural changes in the households did not affect
the indoor comfort or family’s living standard. Some
respondents mentioned however that the most
negative impact of the measures was reduction of
the indoor temperature.
Respondents also indicated that both their
partners and children often changed their energy
related behaviour during the Experiment.
Usability of the System. Although one-third of
survey respondents strongly agreed with the
statement that they only had few problems with the
feedback system during the Experiment, many
households used the opportunity to submit open
answers about the problems they experienced. At
least one-third of these comments indicated that the
equipment did not work correctly. Sensors reading
electricity consumption often lost contact with the
display. This means that nearly 20% of the
households had this problem. This might also have
affected the results of electricity savings shown on
the website because the estimation of electricity
consumption made by the company was based on
these readings.
Many participants stated that their knowledge
about household electricity consumption increased
due to the visualization and feedback.
Possible Improvements. Some improvements and
new options added to the service would, according
to the participants, additionally increase the value of
the service:
better contact between devices,
automatic updating of electricity price,
more smart plugs for measuring individual
outlets,
possibility of measuring the consumption of
fixed appliances e.g. heat pump,
TheExperimentHasShown-SetYourOwnGoalandsaveElectricity
183

better information about possible functions,
comparison with ‘normal’ values,
lighting of the display,
warning system for the temperature level - too
high or too low,
possibility of deciding saving targets
warning system for if the consumption is too
high for the goal to be achieved.
3.3 Future
There is a clear possibility that the participants
discovered some "electricity thieves" during the
Experiment and have started some major invest-
ments to reduce their electricity consumption during
the next heating season (2013-2014).
Many households were very interested to keep
the equipment after the end of the Experiment,
which promises well. Whether the participants will
continue to save electricity or will return to their old
habits, remains to be seen. A possible follow-up
after the winter 2013-2014 might give some
indication of the duration of electricity savings for
each group.
4 CONCLUSIONS
The following conslusions have been drawn from
the study:
Just over 50% of the participants made electricity
savings during the experiment compared with the
previous year; this group of customers saved an
average of 8% electricity.
Just over 22% of participants with a set energy
saving goal managed to reach the target; this
group saved an average of 15% electricity.
All the participants together made a saving of
0.7%.
All the customers from the control group
increased electricity consumption by 1.5 %.
30% of the households believed they had reached
their goals, while 55% did not know if they done
it or not.
Most people would benefit from the equipment
and the service in the future and would be
disappointed if it disappeared.
Most people were not afraid that it would be a
problem of privacy or integrity with company’s
access to the information about their electricity
consumption.
Slightly more than half of the households would
be willing to pay for a similar service in the
future.
Families with children were more willing to pay
for the service and more than others used the
consumption data to check the situation at home.
Those who achieved their electricity saving
target were willing to pay more for the service
than the others.
Many of the participants interviewed had made
some smaller or bigger modifications of the
heating systems.
Many of the participants interviewed had made
some small changes at homes like converting
light bulbs to more energy efficient.
Participants used Facebook but focused on
technical problems and issues.
E.ON used Facebook primarily to spread out
information about the Experiment and its
homepage.
The number of posts from participants dropped
sharply during the Experiment.
Almost 70% of the saving tips sent by the
participants were serious.
ACKNOWLEDGEMENTS
The authors would like to thank the staff of the
energy company E.ON Sweden for all their help and
support during the Experiment.
REFERENCES
Andersson, J., Larsson, P., 2012. Energy use and energy
feedback - Evaluation of the largest energy-saving
experiment at E.ON - Phase 1. Report LUTMDN/
/TMHP--12/5255--SE, Lund University, Lund. (in
Swedish)
Taimor, A., Hols, D., 2013. Energy use and energy
feedback - Evaluation of the largest energy-saving
experiment at E.ON - Phase 2. Report LUTMDN/
/TMHP--13/5267--SE, Lund University, Lund. (in
Swedish)
Uggmark, M., 2013. Scientific evaluation of the largest
energy-saving experiment at E.ON - Results. Report
LUTMDN/TMHP--13/5278--SE, Lund University,
Lund. (in Swedish)
E.ON, 2013. Website of the Experiment. Available at
http://experimentet.eon.se, December 15th, 2013.
SMARTGREENS2014-3rdInternationalConferenceonSmartGridsandGreenITSystems
184
