
QoS-aware Service Composition Based on Sequences of Services
Sylvain D’Hondt and Shingo Takada
Grad. School of Science for Open and Environmental Systems, Keio University, Yokohama, Japan
Keywords:
Service Composition, Service Selection, Quality of Service.
Abstract:
Service composition is an important part of developing Service-oriented Systems. There are two basic ap-
proaches for service composition. First, the developer identifies and searches for individual services that can
be composed. In the second approach, the developer identifies the global input(s) and output(s) of the entire
composition and searches for a composition with the best match. We propose a “middle of the road” approach,
where we identify and search for “sequences of services”, each of which is a consecutively executed service
that appears within an existing composition stored in a database. Our approach utilizes a database containing
Service-oriented Systems. The developer specifies a query containing functional and non-functional require-
ments in XML format. Then the query is used to search within the database for a sequence of services that
matches the requirements. We show the results of an experiment that indicates our approach enabled subjects
to find more executable compositions than a tool that searches for services individually.
1 INTRODUCTION
Service-Oriented Architecture (SOA) and its promise
of more flexible, adaptive and evolutionary systems is
a hot topic. However, it remains complex to design
and to implement. Service composition and selection
are important aspects of SOA, and present some crit-
ical issues such as real-time composition and Quality
of Service (QoS).
Services can be defined as business functionalities
built as software components that can be reused for
different purposes. Services are independent, loosely
coupled units of functionality that have no calls to
each other embedded in them. Each service imple-
ments one action, such as submitting an online appli-
cation for an account, or viewing an online bank state-
ment, or placing an online booking or airline ticket
order. Basically, a service requester sends a message
to the interface of a service, which will eventually re-
spond with another message. Web service is the most
widely used technology for implementing a service.
Although each service may be simple, a large and
complex system (Service-oriented System; SoS) can
be created by composing them. The basic steps to
build a SoS normally consists of first designing the
SoS by specifying the tasks to be performed, includ-
ing constraints such as QoS, and their organization.
Diagrams similar to UML activity diagram are often
used. Then a search is performed to retrieve candidate
services. These candidates are filtered according to
various criteria, and finally the developer “connects”
them using technology such as BPEL or ESB.
The search for candidate services normally takes
one of the following two approaches:
• Individual service selection: For each task in the
design, the developer searches for one service.
QoS constraints may be used to choose among
multiple candidates.
• Global service composition: The entire composi-
tion is searched for. QoS constraints are consid-
ered for the entire composition. If no such com-
position can be found, then services are searched
for individually.
We propose an approach that searches for se-
quence of services. We consider QoS and focus our
implementation on SoS that use Mule ESB (Mule-
Soft, 2013). A “sequence of services” is any consec-
utively executed services that have already been used.
Figure 1 shows an example of how a task composition
can be achieved with sequences of services: instead
of only having a one-to-one correspondence between
task and service, some tasks are achieved with a se-
quence of several services. Figure 1 (a) shows the
composition specification using tasks, while Figure 1
(b) shows the implementation of the composition us-
ing sequences of services. Task A is implemented by
the sequence of services Sequence A, which consists
of three services.
In the rest of this paper, Section 2 reviews related
548
D’Hondt S. and Takada S..
QoS-aware Service Composition Based on Sequences of Services.
DOI: 10.5220/0004864205480555
In Proceedings of the 16th International Conference on Enterprise Information Systems (ICEIS-2014), pages 548-555
ISBN: 978-989-758-028-4
Copyright
c
2014 SCITEPRESS (Science and Technology Publications, Lda.)
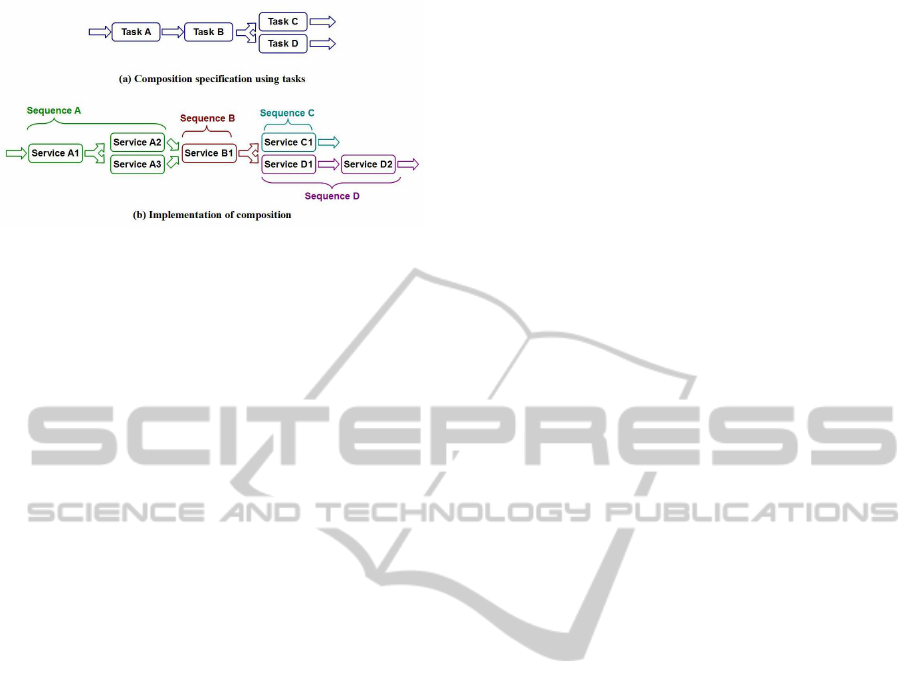
Figure 1: Composition achieved with sequences of services.
work. Section 3 describes our proposed approach to
service composition, and our implementation. Sec-
tion 4 evaluates our approach. Section 5 gives con-
cluding remarks.
2 RELATED WORK
UDDI (OASIS, 2013) is a registry that was originally
proposed as a central part of the Web service standard.
Since then, there has been a wide range of work done
on searching for Web services (Mukhopadhyay and
Chougule, 2012).
Keywords, service function, input/output of ser-
vice are the pillars of searching for services. Differ-
ent approaches exist to determine the similarity of a
query to the service information. For example, Ding
(Ding and Jutla, 2011) used Google Distance to com-
pute how close two terms are.
QoS is another piece of information that has re-
cently been considered. Strunk (Strunk, 2010) listed
several different QoS metrics aggregation formulas,
optimization models for composition problems and
their solutions. The goal is to select the services for
each task that maximize the end-to-end QoS of the
service composition. Rosenberg, et al. (Rosenberg
et al., 2009) proposed the Vienna Runtime Environ-
ment for Service-Oriented Computing (VRESCo). Its
goal is to find an optimal solution within the QoS con-
straint boundaries given by the user.
Much work has also been done on finding combi-
nations of services to reuse. Granell, et al. (Granell
et al., 2005) proposed a methodology for composing
services based on workflow patterns and incremen-
tally reusing existing services. However, their work
focuses on the design process and not necessarily au-
tomatic composition of the existing services. Thus,
the developer would need to find one-to-one corre-
spondence between the lowest level task and service.
Kono et al. (Kono et al., 2004) proposed a tool,
which given an activity (or task), would automatically
search for a combination of services that would match
that activity. However, their work was limited in that
their tool can only automatically handle combinations
of one or two services. If an activity corresponds to
three or more activities, then the developer will need
to manually refine the activity.
Takada proposed an approach that searches for
BPEL fragments (Takada, 2011). A BPEL docu-
ment describes a SoS, and the developer searches for
any consecutive parts of previous BPEL documents
that can be reused in the SoS under development.
However, the developer needs to accurately spec-
ify/breakdown the task into activities as the matching
process is based on a one-to-one correspondence be-
tween each activity and service. The search process
will not retrieve any BPEL fragments if there is no
corresponding service to the specified activity.
AI planning is another approach to finding com-
binations of services. SHOP2 (Sirin et al., 2004) is
a Hierarchical Task Network (HTN) planner which
tries to produce a sequence of actions that will per-
form some activity or task. OWLS-Xplan (Klusch
et al., 2005) combines HTN planning with a Fast-
Forward planner. Haley (Zhao and Doshi, 2009) is
also based on a hierarchical framework, but it is also
based on semi-Markov decision process. All three ap-
proaches require domain knowledge to be prepared
in advance, such as how a task can be decomposed
into subtasks. This is not easy, as developers may not
know how much detailed domain knowledge should
be prepared. Another issue is possible mismatches
between the output of a Web service which is to be
used as input to the next Web service.
One way to avoid the above issue of finding com-
binations of services is to prepare combinations of
services in advance and exposing them as singular
composite services. Ma, et al. (Ma and Leymann,
2009) proposed constructs to explicitly define frag-
ments of BPEL processes. Such an approach would
enable developers to use conventional methods to
search for such composite services as if they were
one service. However, this would require that the de-
veloper can define “useful” composite services in ad-
vance. But this in itself is a difficult task requiring
developers to predict which composite services may
be useful (Holmes and Walker, 2012).
3 SEQUENCE OF SERVICES
BASED COMPOSITION
We propose a QoS-aware approach to service compo-
sition based on sequence of services.
QoS-awareServiceCompositionBasedonSequencesofServices
549
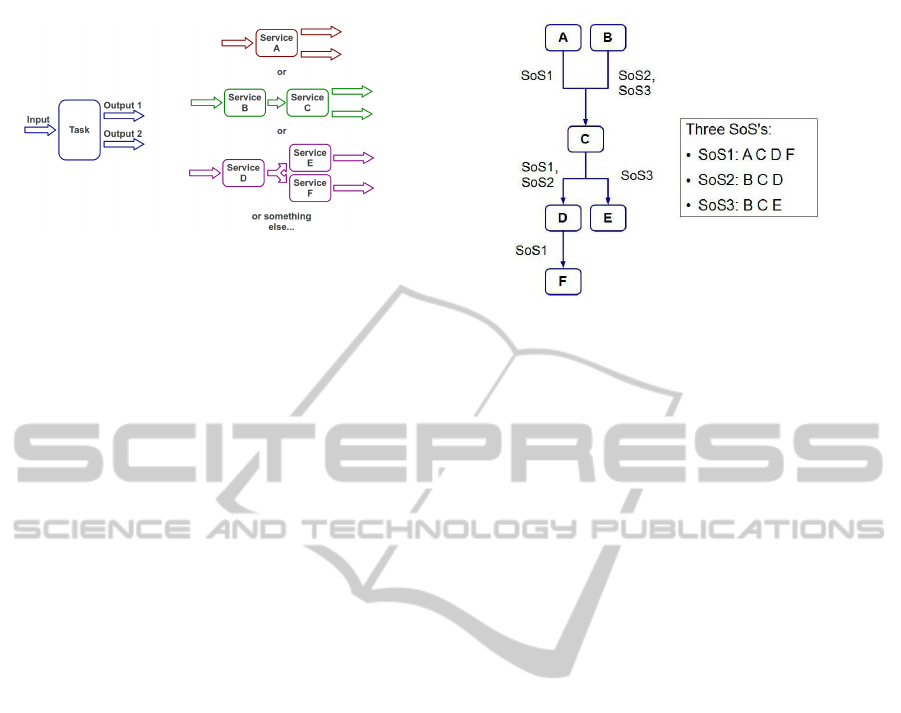
Figure 2: One task can be achieved by one or several ser-
vices.
3.1 Key Idea: Sequence of Services
A “sequence of services” is any consecutively exe-
cuted services that have already been used in an exist-
ing composition. For each task described by the user,
we try to find one service or one sequence of service
to implement the functionality (Figure 2).
This offers three advantages. First, there are no
dependency problems or conflicts inside a sequence
since services have already been used together. Sec-
ond, there are more alternatives for the task composi-
tion since one task can be achieved with several ser-
vices. Finally, we can assume that existing sequences
have, at least, “not bad” QoS since someone has al-
ready used them in a previous composition.
3.2 Database of Services
Since our approach is based on finding sequence of
services which may be any part of an existing SoS, we
use a graph database instead of a conventional SQL-
based database. This enables all services to be stored
in a graph structure so that the existing relationships
between services of a same sequence are kept. We
also believe that this will lead to better scalability and
be more efficient compared to using SQL.
Each node in the graph corresponds to a service,
and stores information such as the following: Name,
Type, Input (keywordand type), Output (keywordand
type), description (used for the functionality), specific
properties related to the type, and QoS values.
QoS values are currently limited to response time,
availability, and throughput. We do not consider non-
measurable QoS such as security and interoperability
because they cannot be known nor quantified in most
cases. However, our tool can be extended to handle
other measurable metrics as desired.
Links between nodes, i.e. services, indicate that
those services belong to the same sequence. and thus
have already been used in a previously developed sys-
tem. Note that links are directed since there is an or-
der to how the services are called. Also, links contain
Figure 3: Multiple SoS as a graph.
information to clarify which SoS it belongs to.
For example, Figure 3 shows how three separate
SoS’s can be represented within a graph database.
Service C appears in all three SoS’s but only appears
once in the database. Links make clear which ser-
vices are used together in which SoS. Thus, SoS1 is
composed of services A, C, D, and F, while SoS2 is
composed of services B, C, D.
3.3 Searching for Sequence of Services
Sequence of services are found by querying the
database. The query is based on three types of in-
formation: input/output, functionality, and QoS.
Input/Output. The basic matching scheme is based
on input and output, i.e., the input/output that are
specified in the query match the input/output of a se-
quence of services, as follows:
1. Search in the graph database for all possible
“start” nodes that have the required input.
2. Do the same for “end” nodes that have the re-
quired output.
3. Find all paths between all “start” and “end” nodes
where each node in the path belongs to the same
SoS.
For example, suppose that in Figure 3 nodes A
and B take input that are specified in the query, while
nodes E and F have outputs that match the output
specified in the query. There are four possible paths
that start with either A or B, and ends with either E or
F: ACDF, ACE, BCDF, and BCE. However, since the
link between A and C is SoS1 and the link between C
and E is SoS3, the path ACE is not a valid sequence
of services, i.e., this combination does not belong to
a single SoS. Similarly, BCDF is also an invalid se-
quence of services. As a result, ACDF and BCE are
considered as the candidate sequence of services.
ICEIS2014-16thInternationalConferenceonEnterpriseInformationSystems
550
Functionality. Searching with only input/output
can lead to many unnecessary paths. To make the
query more specific, the user can specify a keyword
in the query. This keyword is used to restrict the re-
sults to the sequence of services that contain a service
(i.e., node) with the keyword in the name or descrip-
tion.
QoS Aggregation. QoS is also an important part of
the search process. After finding candidate sequences
of services based on input/output and function, the
global QoS values for each of the candidates are com-
puted. The user can then be notified whether or not
the QoS values for each candidate sequence of ser-
vices meets the requirements specified by the user.
The global QoS values can be computed based on
formulas given in (Strunk, 2010). Specifically, the
three types of QoS values are computed as follows:
ResponseTime =
n
∑
i=1
Time(S
i
)
Availability =
n
∏
i=1
Avail(S
i
)
Throughput = Min(Throughput(S
i
))
Note that S
i
corresponds to the ith service in the se-
quence of services. Response time is the sum of the
response time of each service in the sequence. Avail-
ability is the product of the availability of each service
in the sequence. Throughput is the minimum value of
the throughput for all services in the sequence.
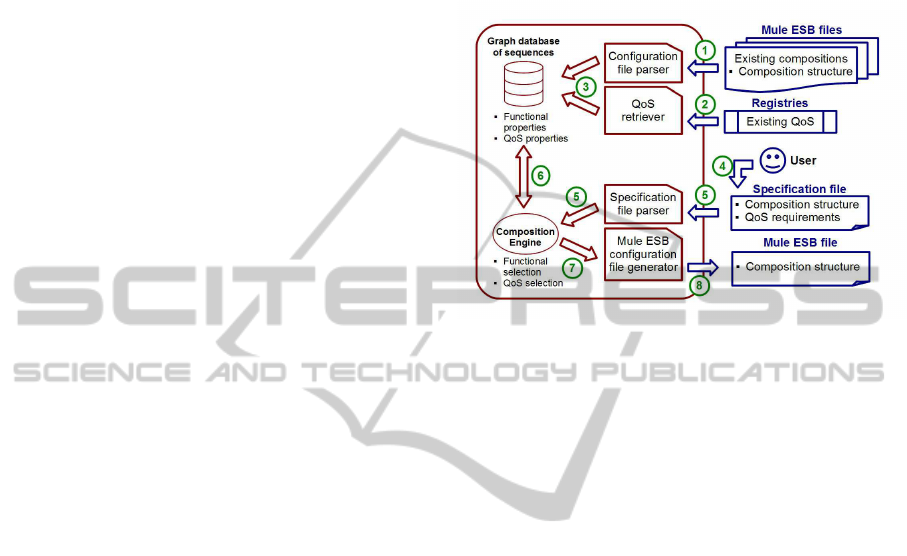
3.4 Implementation
Figure 4 shows the architecture of our tool. Our tool
mainly consists of a part that stores new SoS’s, and a
part that queries and retrieves sequence of services.
3.4.1 Database
Our database is implemented using Neo4J, which is a
widely used graph database (Neo Technology, 2013).
Services are added to our database as follows (num-
bers correspond to Figure 4):
1. Our configuration file parser parses a Mule ESB
configuration file, which contains an existing SoS.
2. The QoS retriever fetches the QoS values for ser-
vices that have QoS values in a repository.
3. Each service is stored in the database as a node
with its information, functional properties, de-
scription and QoS.
• The service is connected to the root node if it is
the first service of the composition; otherwise it
is connected to the previous service in the SoS.
• If the service already exists in the database, a
new node is not made. The existing node is just
connected to the appropriate node.
Note that the connections, i.e. links, between nodes
contain information such as which SoS it belongs to.
Figure 4: Architecture of the implementation of the tool.
3.4.2 Retrieving Sequence of Services
The user queries for existing sequence of services as
follows (numbers correspond to Figure 4):
4. The user writes a specification file that specifies
the tasks that need to be carried out as well as
any QoS requirements. Each task can be decribed
by its input/output, functionality, and QoS con-
straints.
5. The specification file parser parses the specifica-
tion file, and creates an internal query that will be
used by the composition engine.
6. The composition engine queries the database to
find all the candidate sequences of services for the
tasks specified by the user that best matches the
requirements. The search process is conducted as
was described in section 3.3.
7. The user chooses one of the sequence of services
from the query result.
8. Our tool outputs the chosen composition in the
format of Mule ESB configuration file. The con-
tents of this file can be used (at least as a starting
point) to build the final composition.
3.4.3 Example
Suppose that the user wants to find a (sequence of)
service that takes the name of a stock as a string and
returns its quote in XML format within 4000 ms. The
user will first need to write a query as a specification
file as shown in Figure 5.
QoS-awareServiceCompositionBasedonSequencesofServices
551

<?xml version=”1.0” encoding=”UTF-8”?>
<composition>
<task
input=”stock:string”
output=”quote:xml-file”
keyword=”stock”
responseTime=”4000”
/>
</composition>
Figure 5: Specification file example.
The file is parsed by our tool into an internal query
which is used to search the graph database. Services
which take stock:string as input are first searched for.
Then services which have quote:xml-file as output are
searched for. Paths are searched between the two
types of services. During the search, each path is
checked to see if it belongs to the same SoS. Then the
keyword stock is used to filter out paths which do not
have the keyword in any of the services names and
descriptions. Finally the response time is calculated
for each of the path.
Figure 6 shows one resulting composition. The
composition consists of four services, where the first
one (ID #1) takes stock:string as input and the fourth
service (ID #6) has quote-value:xml-file as output.
The keyword stock appears in the description of the
first service, and the total response time is calculated
as 3788 ms, which meets the response time require-
ment of 4000 ms. Although not explicitly shown in
Figure 6, all four services belong to the same SoS.
4 EVALUATION
We evaluated our approach by comparing it with a
tool that can only search for services one by one.
4.1 Experimental Method
Test subjects were given requirements in natural lan-
guage, and told to build as many compositions as they
can in a limited time (five minutes). They used our
sequence-based tool as well as a tool that can only
search for individual services in the database for com-
parison.
Test subjects were composed of twelve undergrad-
uate students (mostly majoring in computer science).
They were divided into four groups of three students
each. To minimize learning effect, we used two differ-
ent sets of requirements (Q1 and Q2), each containing
three questions (Table 1). Each subject separately an-
swered both requirements: one set using our tool (S)
Table 1: Questions used in experiment.
ID Question
1.1 Build a system that suggests locations as string
given an address as a string.
1.2 Build a system that searches for a book (returns
a book object) in a catalog given the title of one
book as string.
1.3 Build a system that given astock titleas a string,
writes the stock quote value in a XML file.
2.1 Build a system that given a Facebook page ad-
dress as string, writes the feed in a file.
2.2 Build a system that given a misspelled word as a
string, writes words suggestions in a XML file.
2.3 Build a system that given an amount of money
as a string, returns the corresponding coins for
the amount as a string.
Table 2: Subject grouping.
Group ID #1 Set / Tool #2 Set / Tool
A Q1 / I Q2 / S
B Q2 / S Q1 / I
C Q1 / S Q2 / I
D Q2 / I Q1 / S
Table 3: Generated Composition Levels.
Level Points Validity I/O Functionality
3 3 OK Type & OK
Keyword
2 2 OK Type Maybe
1 1 X Type X
0 0 X X X
and the other using individual service search (I). Table
2 shows how each group carried out the experiment.
The database contained 21 SoS’s with a total of
62 distinct individual services. SoS’s included exam-
ples from the Mule ESB documentation (MuleSoft,
2013). In cases where the individual services did not
have QoS values, we generated random values with a
Gaussian law based on the set of services in the QWS
data set (Al-Masri and Mahmoud, 2007).
We evaluated our tool against the individual
search tool based on the quality of the composition.
Since we built the questions and knew the entire
database, we manually judged the quality of the com-
positions. Specifically, we established four levels,
each corresponding to an objective achieved by the
composition and assigned points (Table 3):
• Level 0: No composition was built, or the com-
position is not even close to the possible solutions
(wrong input/output or functionality).
• Level 1: Input and output are correct (at least the
type) but there are incompatibilities in between
that make the composition impossible to run.
• Level 2: Input and output type are correct and the
ICEIS2014-16thInternationalConferenceonEnterpriseInformationSystems
552
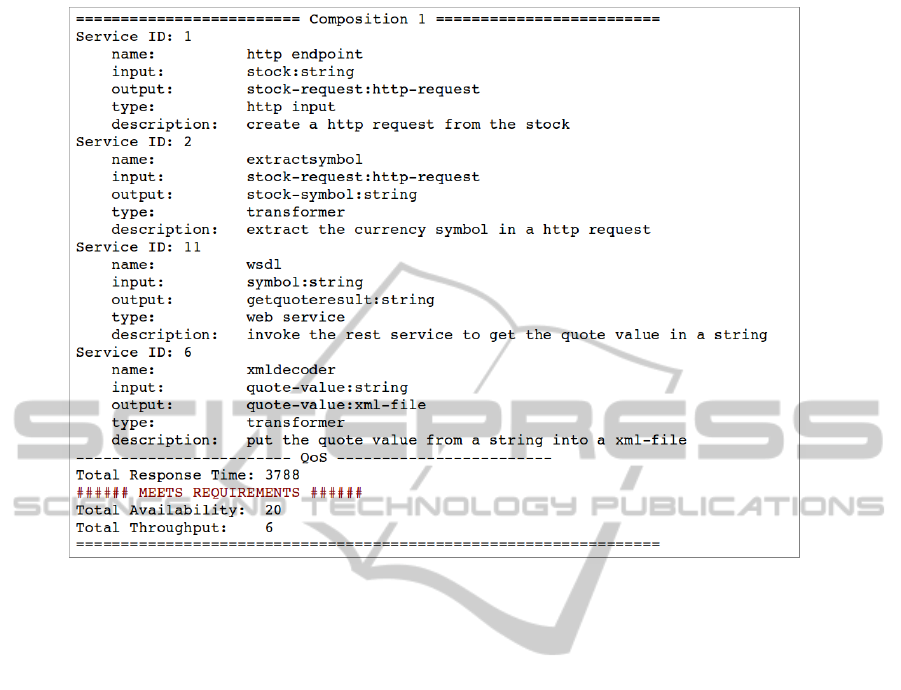
Figure 6: Matching composition.
composition is valid and can run, but it is only in-
cluded in a possible solution (the format of some
parameter is close but not correct).
• Level 3: The correct composition was made.
The points were summed for each question set (Q1
and Q2) for each group (A, B, C, and D), and used
to analyze the results. Since the maximum number
of points for one set of one group is 27 points (=(3
points)*(3 questions)*(3 subjects)), we can use “point
percentage” (PP), where 100% is 27 points, to com-
pare the results. A higher point percentage means that
the quality is better.
Note that level 2 corresponds to a misunderstand-
ing of the question: the test subjects may not have
understood the difference between two close terms,
e.g., “stock” and “stock symbol”. Thus the generated
composition would be valid if the input would have
been “stock symbol” but not for “stock” only.
4.2 Results and Analysis
We found two issues with the experimental results:
• One test subject never achieved any level 3 nor 2
composition. He only had one level 1 composi-
tion and 5 compositions of level 0. Since only one
person produced such results, we considered that
this particular person did not understand the ques-
tions or how to use the programs and decided not
to incorporate the corresponding results.
• The last question of the second set (Q2.3) was
neverachieved by any test subject, not even a level
2. This suggests that the question was not well
formulated and thus we decided not to include it
when calculating the point percentages.
We now show and analyze the results of the exper-
iment taking the above two points into account.
Global Comparison. Figure 7 shows the point per-
centage for each group and each tool used. In all four
groups, we find that the results using our sequence
tool had a higher point percentage (i.e., had better
quality) compared to the individual tool. Figure 8
shows the number of level 3 compositions. Again,
the groups using our sequence tool clearly had more
valid compositions than the groups using the individ-
ual tool. For both Figures 7 and 8, we applied the
t-test and found that they were statistically significant.
Comparison between Tools. Figure 9 compares
the results based on each requirement set (Q1 and
Q2), as well as its order. We can see that in three out
of four cases, the sequence tool had a higher point per-
centage compared to the individual tool. In the lone
QoS-awareServiceCompositionBasedonSequencesofServices
553
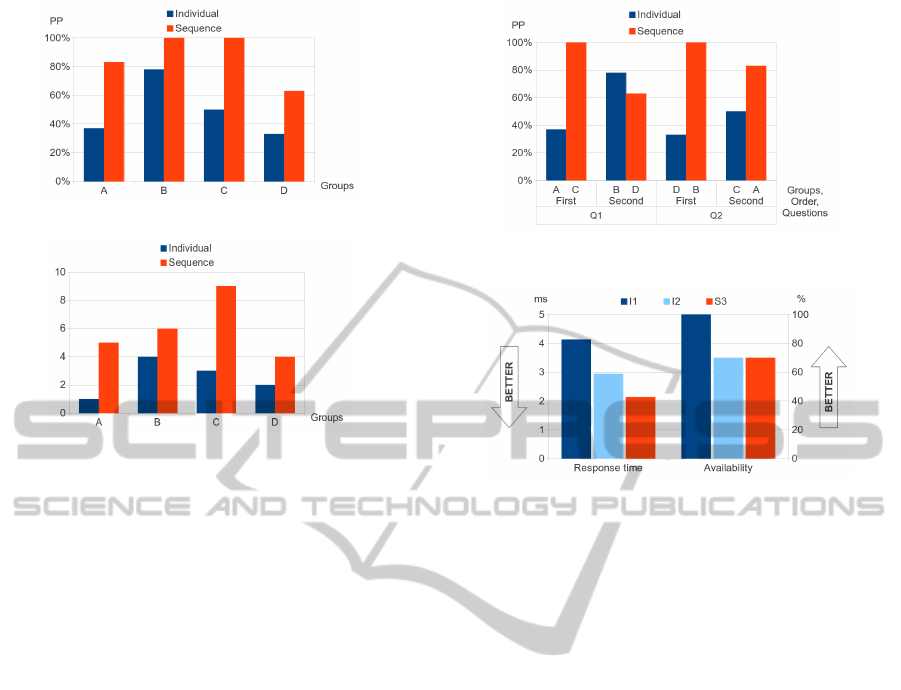
Figure 7: Global results of the experiment.
Figure 8: Number of level 3 compositions generated by the
subjects.
opposite case, the difference was not too large (about
15%), compared to the differences for the other three
cases.
QoS Requirement Achieved. Among the six ques-
tions in the two sets, four of them had at least two pos-
sible valid compositions. We had originally planned
to compare the QoS values of the generated composi-
tions for each question between the compositionsgen-
erated with the sequence tool and the ones generated
with the individual tool. But only one test subject was
able to find several compositions for the same ques-
tion, and only for two questions (Q1.2 and Q1.3).
Figure 10 shows the QoS values (left axis for the
response time, right axis for the availability) for the
compositions generated for question Q1.2. As ex-
pected, the compositions generated with the individ-
ual tool (I1 and I2) have different QoS than the one
generated with the sequence tool (S3). The composi-
tions generated with the individual tool have a longer
response time but one of those two also has a bet-
ter availability. On the other hand, the composition
generated with the sequence tool has the shortest re-
sponse time. Note that all three compositions have the
same throughput value.
For question Q1.3, only subjects using the se-
quence tool succeeded in building valid compositions,
thus there were no compositions generated with the
individual tool to compare to. Some test subjects re-
ported that they could not find multiple compositions
because the time to build compositions was too short.
Although there are not much data to use for com-
Figure 9: Comparison results between the sequence tool
and the individual tool.
Figure 10: QoS comparison of the three compositions gen-
erated for Q1.2.
parison, only the sequence tool allowed one subject to
find several compositions for two questions whereas
no one was able to do it with the individual tool.
This suggests that the sequence tool can be used more
quickly and offer more choices to the user.
4.3 Threats to Validity
As with any experiment that uses students as subjects,
this would be one threat to validity. Indeed, as was
discussed in the previous section, one of the students
had difficulty in making compositions regardless of
using the sequence tool or individual tool. However,
we could also say that students represent a good test
for the usability of the tool: if even beginners can use
this tool to build working service composition, this
means that the idea and the implementation were of a
satisfying quality for its purpose.
There is the possibilty that the two sets of ques-
tions may differ in difficulty. Thus, we compare Q1
and Q2 by adding the raw results (points) of each
set and then computing the percentage obtained com-
pared with the maximum. The result indicates the av-
erage PP obtained for each set. Figure 11 indicates
the contribution of each group to this global percent-
age. Although the global PP of Q1 is a little higher
than Q2, when we applied t-test, the difference (i.e.,
“Q1 is easier than Q2”) was not statistically signifi-
cant. Thus we conclude that one set of questions was
not necessarily more difficult than the other.
ICEIS2014-16thInternationalConferenceonEnterpriseInformationSystems
554
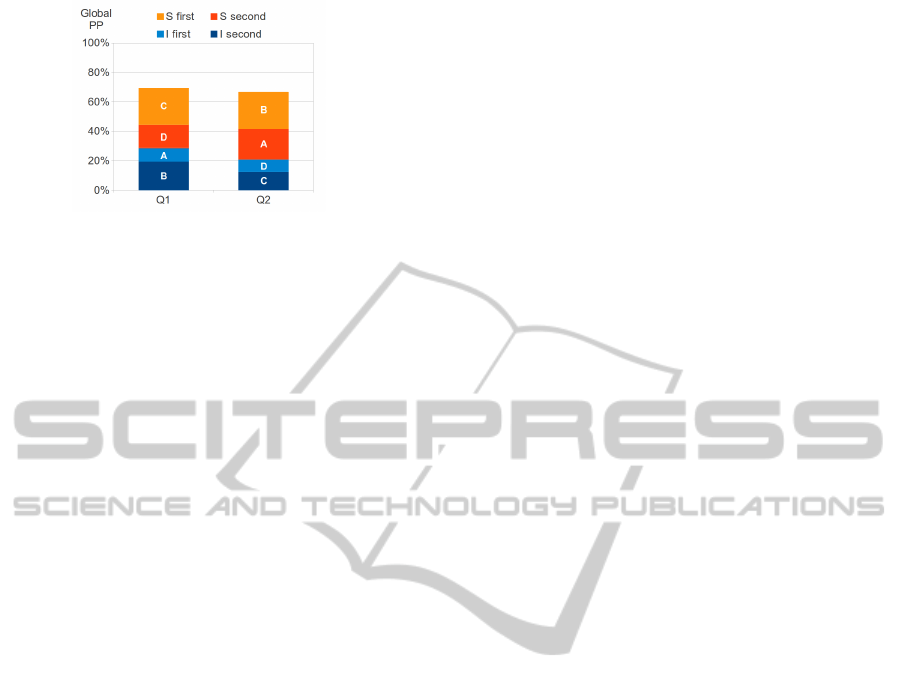
Figure 11: Global PP comparison between Q1 and Q2.
Finally, the time to answer each question (up to
five minutes) could be considered as a threat to va-
lidity. We chose this short time to avoid the test sub-
jects spending too much time “exploring” the graph
database and to limit the learning effect. But given the
results, it may appear a little too short since some sub-
jects reported that they may have been able to build
more compositions with more time.
5 CONCLUSIONS
We proposed an approach that searches for sequences
of services to build a SoS. Sequences of services al-
low a task to be implemented not only by one service,
but by any existing composition of services. An eval-
uation found that our approach resulted in composi-
tions of higher quality (based on our notion of “point
percentage”) compared to an approach based on find-
ing services in a composition one-by-one.
Future work include improving the quality of the
Mule ESB configuration file parser by adding sup-
ported Mule ESB elements and structures. Another
enhancement would allow more flexibility for the use
of the graph database with a graphical interface to vi-
sualize, search and edit the graph database, keeping
consistency with the indexes. Finally, a third exten-
sion concerns the structure of the generated composi-
tions, still limited to linear sequences whereas Mule
ESB can handle choices, fault handling, etc.
REFERENCES
Al-Masri, E. and Mahmoud, Q. H. (2007). QoS-based dis-
covery and ranking of web services. In IEEE 16th
International Conference on Computer Communica-
tions and Networks, pages 529–534.
Ding, R. and Jutla, D. (2011). Flexible ontology-
independent and QOS-enabled dynamic web services
composition using google distance. In 2011 IEEE In-
ternational Conference on Services Computing, pages
266–273.
Granell, C., Gould, M., Gronmo, R., and Skogan, D.(2005).
Improving reuse of web service compositions. In 6th
International Conference on E-Commerce and Web
Technologies, pages 358–367.
Holmes, R. and Walker, R. (2012). Systematizing pragmatic
software reuse. ACM Transactions on Software Engi-
neering and Methodology, 21(4).
Klusch, M., Gerber, A., and Schmidt, M. (2005). Seman-
tic web service composition planning with OWLS-
Xplan. In AAAI Fall Symposium on Semantic Web and
Agents.
Kono, Y., Takada, S., and Doi, N. (2004). A framework
for multiple service discovery and robustness. In 8th
IASTED International Conference on Software Engi-
neering and Applications, pages 546–551.
Ma, Z. and Leymann, F. (2009). BPEL fragments for modu-
larized reuse in modeling BPEL processes. In 5th In-
ternational Conference on Networking and Services,
pages 63–68.
Mukhopadhyay, D. and Chougule, A. (2012). A survey on
web service discovery approaches. In 2nd Interna-
tional Conference on Computer Science, Engineering
and Applications, pages 1001–1012.
MuleSoft (accessed Sept. 30, 2013). Mulesoft community.
http://www.mulesoft.org/.
Neo Technology (accessed Oct. 2, 2013). Neo4j.
http://www.neo4j.org/.
OASIS (accessed Oct. 2, 2013). UDDI specifica-
tions. https://www.oasis-open.org/committees/uddi-
spec/doc/tcspecs.htm.
Rosenberg, F., Celikovic, P., Michlmayr, A., Leitner, P.,
and Dustdar, S. (2009). An end-to-end approach for
QoS-aware service composition. In 2009 IEEE Inter-
national Conference on Enterprise Distributed Object
Computing Conference, pages 151–160.
Sirin, E., Parsia, B., Wu, D., Hendler, J., and Nau, D.
(2004). HTN planning for web service composition
using SHOP2. Web Semantics: Science, Services and
Agents on the World Wide Web, 1(4):377–396.
Strunk, A. (2010). QoS-aware service composition: A sur-
vey. In 2010 IEEE 8th European Conference on Web
Services, pages 67–74.
Takada, S. (2011). Finding web services via BPEL fragment
search. In 3rd International Workshop on Search-
Driven Development: Users, Infrastructure, Tools,
and Evaluation, pages 9–12.
Zhao, H. and Doshi, P. (2009). Ahierarchical framework for
logical composition of web services. Service Oriented
Computing and Applications, 3(4):285–306.
QoS-awareServiceCompositionBasedonSequencesofServices
555
