
Visualizing Traceability Information with iTrace
Iv
´
an Santiago, Juan M. Vara, Valeria de Castro and Esperanza Marcos
Kybele Research Group, Rey Juan Carlos University, Avd. Tulip
´
an S/N, M
´
ostoles - Madrid, Spain
Keywords:
Model-driven Engineering, Program Comprehension, Visualization Techniques and Tools.
Abstract:
The key role of models in Model-Driven Engineering (MDE) provides a new landscape for dealing with
traceability. However, despite the certain maturity reached by some MDE tools, providing efficient views of
traceability data is still in its early stages. To contribute in this direction, this work introduces the visualiza-
tion mechanisms provided by iTrace, a framework for the management of traceability in MDE projects. In
particular, a multipanel editor for trace models supports the low-level edition of traceability data whereas dif-
ferent dashboards provide high-level views of such data. Both proposals are illustrated by means of a running
example.
1 INTRODUCTION
Traceability (IEEE, 1990) has always been a rele-
vant topic in Software Engineering (Asunci
´
on, 2008).
Maintaining links from requirement to analysis, de-
sign artifacts, working-code or test cases has been ac-
knowledged as one of the best ways to perform im-
pact analysis, regression testing, validation of require-
ments, etc. Likewise, the appropriate management of
traceability information is key to control the evolution
of the different system components during the soft-
ware development life cycle (Ramesh et al., 1997).
Unfortunately, maintaining links among software
artifacts is a tedious, time-consuming and error-prone
task if no tooling support is provided to that end
(Oliveto, 2008). As a consequence, traceability data
use to become obsolete very quickly during software
development. Even sometimes it is completely omit-
ted. Nevertheless, the advent of Model-Driven Engi-
neering (Schmidt, 2006) can drastically change this
landscape. The key role of models positively influ-
ences the management of traceability since the traces
to maintain are simply the links between the elements
of the different models handled along the process.
Furthermore, such traces can be collected in other
models to process them using any model process-
ing technique, such as model transformation, model
matching or model merging (Bernstein, 2003).
One of the areas where appropriate management
of traceability has been acknowledged to help deci-
sively is software comprehension (De Lucia et al.,
2006). This statement gains strength in the context
of Model-Driven Engineering (Schmidt, 2006), where
software (in the shape of model transformations) is
responsible for driving forward the development pro-
cess. In fact, any MDE project consists basically of
a chain of model transformations that consume in-
put models to produce output models (Sendall and
Kozaczynski, 2003). Being able to keep trace of
the relationships between the elements of such mod-
els implies complete control over the transformations
that implemented them and thus over the development
process itself (Mohagheghi and Dehlen, 2007).
Therefore, in previous works (Santiago et al.,
2012) a systematic review was conducted to assess
the state of the art on traceability management in
the context of MDE. The review showed that de-
spite the maturity reached by MDE tools for some
specific tasks, such as model edition or transforma-
tion (Volter, 2011), the area of traceability manage-
ment presents some serious limitations, like the ab-
sence of proposals to support the analysis of the in-
formation produced when traceability is considered
or the lack of appropriate tooling to visualize trace-
ability data. Regarding the latter, the review re-
vealed that there are very few tools providing ad-hoc
mechanisms to deal with trace models AMW (AMW, ),
ModeLink (ModeLink, ), MeTaGeM-Trace (Metagem-
Trace, ) and none of them supports both model-to-
model (m2m) traces and model-to-text (m2t) traces.
Besides, the huge amount of data collected during an
MDE project where the production of traceability in-
formation is enabled, makes it very convenient to pro-
vide some kind of aggregated view over such data.
5
Santiago I., M. Vara J., de Castro V. and Marcos E..
Visualizing Traceability Information with iTrace.
DOI: 10.5220/0004865400050015
In Proceedings of the 9th International Conference on Evaluation of Novel Approaches to Software Engineering (ENASE-2014), pages 5-15
ISBN: 978-989-758-030-7
Copyright
c
2014 SCITEPRESS (Science and Technology Publications, Lda.)

To deal with these issues, this work introduces the
visualization mechanisms supported by iTrace (San-
tiago et al., 2013), a framework for traceability man-
agement in MDE projects. On the one hand, it bun-
dles an editor for trace models that supports both m2m
and m2t traces. On the other hand, it leans on Busi-
ness Intelligence (BI) (Kimball, 1998) tools to pro-
vide a set of dashboards for traceability data
1
. that
can be used to produce high-level overviews of the
relationships between the artefacts involved in the de-
velopment process.
The rest of this paper is structured as follows: Sec-
tion 2 introduces existing works in the field, highlight-
ing the contributions of this work. Section 3 intro-
duces the running example used to illustrate the pro-
posal. Section 4 illustrates the production of trace
models from legacy projects, while Section 5 presents
our proposal for the visualization of the data collected
in such models. Finally, Section 6 summarizes the
main conclusions derived from this work and provide
some directions for further work.
2 RELATED WORKS
It is worth noting that there are several works dealing
with the use of traceability matrix or reports to present
the traceability information gathered during an MDE
project. However, this work focuses on more elabo-
rated visualizations based on some kind of graphical
abstraction, such as graphs, editors or dashboards.
First of all, most of the existing works in the con-
text of MDE lean on the Eclipse Modeling Frame-
work (EMF) (Gronback, 2009) to implement their
proposals (Vara and Marcos, 2012). One of the main
features of EMF is the ability to generate simple yet
fully functional tree-based editors from a given meta-
model. These editors are consequently widely used
by MDE tools. Nevertheless, their generic nature do
not always fit with the specific nature of some sce-
narios. For instance, trace models are eminently re-
lational models, i.e. models whose main purpose is
to collect the relationships between the elements of
some other models (Jim
´
enez et al., 2012).
A few works have previously addressed this is-
sue by providing multi-panel editors for EMF models.
This is the case of AMW, ModeLink, MeTaGeM-Trace or
iTrace (ITrace, ). However, although they improve
the capabilities of the generic EMF editors to display
relational models, they still own some generic nature
1
A dashboard is a visual interface that provides at-a-
glance views into key measures relevant to a particular
objective or business process (Alexander and Valkenbach,
2010).
that results in some limitations when used to display
trace models.
The main limitation of AMW when it is used to dis-
play trace models is that it hampers the distinction
between source and target models when dealing with
more than two related models. This results in related
models being misplaced regarding their role in the
traceability relationship. For instance, contrary to the
most intuitive idea, source models would be placed on
the right of the traces model.
ModeLink in turn just supports the visualization of
two/three models, including the relationships (traces)
model. Therefore, the user can only define relation-
ships between the elements of one source and one tar-
get model. As a consequence, a limitation arises when
traces between elements of several source and/or tar-
get models are needed.
Finally, although MeTaGeM-Trace overcame these
limitations, it does not support the definition of traces
between model elements and source-code (blocks),
i.e. m2t traces.
By contrast, Acceleo (Obeo, ) provides a solu-
tion to the last issue. In fact, it is a m2t transforma-
tion language which support traces generation. Every
time an Acceleo transformation is run, a traces model
between the input model and the code generated is
produced. Unfortunately, due to its functionality, it
is obviously limited to work with m2t trace models.
Besides, such models are just transient models. They
can only be used for debugging purposes but they are
not persisted when the IDE is closed.
From the visual point of view, the graph-based
visualizations supported by GEF3D (von Pilgrim, ),
TraceViz (Marcus et al., 2005) or TraVis (De Souza
et al., 2007), are probably more appealing. How-
ever, while GEF3D is mainly a extension to sup-
port 3D diagramming atop of Eclipse-GEF, TraceViz
and TraVis are general-purpose tools for traceabil-
ity management. That is, none of them were devised
to work with models, what results in a number of is-
sues when used in the context of MDE. The most im-
mediate is the need to serialize the trace models pro-
duced in MDE projects according to the input format
required by such tools.
Regarding iTrace its editor for trace models
solve the different issues of the multi-panel editors
mentioned before: it displays n models that are cor-
rectly placed regarding their role in the traceability
relationship. Besides, it supports m2m or m2t trace
models. Nevertheless, the most outstanding feature
of iTrace regarding existing works is the use of BI
tools to provide a set of dashboards for traceability
data. They support the tracking of traces from high-
level models to source-code and the selection of dif-
ENASE2014-9thInternationalConferenceonEvaluationofNovelSoftwareApproachestoSoftwareEngineering
6

Table 1: Tools supporting traces visualization.
Tool NaT #Art Vsl MDE AGG
Acceleo m2t Sim TL 3 7
AMW m2m Sim M 3 7
GEF3D m2m Mul G* 7 7
ModeLink m2m Sim M 3 7
TraceViz m2t Sim G 7 7
TraVis m2m Mul G 7 7
MeTaGeM-Trace m2m Mul M 3 7
iTrace Both Mul M/D 3 3
* GEF3D models
ferent granularity levels, either showing or abstracting
from technical details. As a result, simpler and more
intuitive visualizations are provided.
To summarize the main findings of this section,
Table 1 compares the main features of iTrace regard-
ing visualization of traceability data against those of
reviewed proposals. In particular, the following fea-
tures are reviewed:
• Nature of the traced artifacts (NaT): the tool can
be used to display (m2m) traces, (m2t) traces or
both.
• Cardinality (#Art): the tool supports (Sim)ple
traces, which can reference elements from just
two artifacts (either models or source-code files)
or (Mul)tiple traces, which can reference elements
from more than two artifacts.
• Type of Visualization supported (Vsl): graph-
based (G), tree-like editor (TL), multipanel editor
(M), dashboard (D).
• MDE-oriented (MDE): either the tool was devel-
oped to work in the context of MDE (3) or not
(7).
• Aggregated views (AGG): either the tool provides
aggregated views of traceability data (3) or not
(7).
3 MOTIVATING SCENARIO
In order to illustrate the proposal of this work, this
section shows its application to an existing MDE
project. In particular, we used M2DAT-DB (Vara and
Marcos, 2012) a framework for Model-Driven Devel-
opment of modern database schemas. This work fo-
cuses on the use of M2DAT-DB to generate an Oracle
ORDB schema from a conceptual data model repre-
sented with a UML classs diagram, going through an
SQL2003 model as an intermediate step.
In order to run this scenario, a targeted domain
is needed. To that end, the Online Movie Database
(OMDB) example introduced by Feuerlicht et al.
(Feuerlicht et al., 2009) is used. Using an ”external”
case study prevents us from using ad-hoc models that
might fit better to our needs. This way, the specifi-
cation of the OMDB provided in (Feuerlicht et al.,
2009) is modeled using an UML class diagram that
constitutes the input model used to run M2DAT-DB.
This way, Fig. 1 shows an overview of the
case study
2
. Using M2DAT-DB, the UML class
diagram that depicts the OMDB conceptual data
model is translated into an ORDB schema conform-
ing to the SQL:2003 standard. If desired, such
mapping can be driven by a set of annotations col-
lected in a weaving model (Didonet Del Fabro et al.,
2006) to introduce some design decisions in the pro-
cess. This way, the UML2SQL2003 transformation
consumes the source models, conceptual data model
(OMDB.uml) and annotation model (OMDB.amw) to
generate the SQL2003 model (OMDB.sql2003). Next,
the SQL20032ORDB4ORA transformation consumes the
SQL2003 model to generate an ORDB model for
Oracle OMDB.ordb4ora). Finally, the ORDB4ORA2-
CODE m2t transformation generates the working-
code that implements the modeled schema in Oracle
OMDB.sql). Note that the running of each transfor-
mation produces, apart from the corresponding target
models, a traces model (see UML2SQL2003.itrace,
etc.).
4 GENERATION OF TRACE
MODELS
First step towards the appropriate management of
traceability is to dispose of traceability data. Unfortu-
nately many projects do not collect such data. How-
ever, one of the advantages of MDE is the ability to
run the project any number of times since it is mostly
automated. iTrace takes advantage from this feature
to gather traceability data from legacy MDE projects.
These data are persisted in trace models which con-
form to the iTrace metamodel, which is briefly in-
troduced in the following.
4.1 The iTrace Metamodel
The iTrace metamodel, shown in Fig. 2, is defined
to support the modeling of the low-level traceability
2
Full screen images for all the figures can be found
in: http://www.kybele.etsii.urjc.es/itracetool/index.php/
conferences/enase-2014/
VisualizingTraceabilityInformationwithiTrace
7

Figure 1: Model-driven development of the Object-Relational OMDB with M2DAT-DB.
information obtained from transformations and weav-
ing models.
An iTraceModel (root class) contains (software)
Artifacts, TraceLinks and/or SpecificFeatu-
res. The latter serve to collect the ad-hoc features
of the project under study which might be of interest
for the subsequent analysis. Since the information to
gather about each project might be completely differ-
ent, each particular feature is a simple key-value pair,
thus leaving complete freedom to the storage of any
type of data considered relevant.
The class Artifacts represents the building
blocks of the MDE project, i.e. models and source-
code, while the TraceLink class represents the traces
between them. Actually, such traces connect their
components, represented by TraceLinkElement ob-
jects in the case of models and Blocks in the case
of source-code. TraceLinkElement objects own an
EObject reference to point to a particular model ele-
ment.
Each TraceLink owns a type property whose
value defines how was the trace produced: either from
a model Transformation or from an Annotation
model. Each TraceLink is in turn a M2MLink or a
M2TLink. While the former relates two or more model
elements (at least a TraceLinkSourceElement and
a TraceLinkTargetElement), the latter relates one
or more model elements with source-code blocks
(M2TLink.codeTarget.blockCode).
4.2 Generation Process
iTrace supports the production of trace models in
two different scenarios. On the one hand, it sup-
ports the enrichment of model transformations that
were developed with model transformation languages
which do not support the generation of traces. On
the other hand, it bundles a set of transformations to
normalize existing traces models to a common meta-
model: the iTrace metamodel. In this paper, only
the first scenario is considered, i.e., the production of
trace models by enriching existing model transforma-
tions. More specifically, we focus on the generation
of trace models from enriched ATL transformations.
ATL provides limited access to the target elements
generated by running a transformation, e.g. in the cur-
rent version of the ATL virtual machine (ATL-VM),
target elements cannot be selected according to their
type. Besides, the ATL-VM discards the tracing in-
formation after the transformation is run. This im-
plies that ATL model transformations should be refac-
tored to support the production of trace models (Yie
and Wagelaar, 2009). However, such refactoring can
be automated by using High-Order Transformations
(HOT) (Tisi et al., 2010), i.e. ”a model transforma-
tion such that its input and/or output models are them-
selves transformation model”.
This way, HOTs are used to enrich existing m2m
transformations so that they are able to produce not
only the corresponding target models, but also trace
models. This idea was first proposed by Jouault in
(Jouault, 2005) that introduced an initial prototype to
support the enrichment of ATL transformations. The
enrichment process bundled in iTrace is a little bit
more complex than the one from (Jouault, 2005), due
to the increased complexity of iTrace metamodels.
Fig. 3 depicts graphically the enrichment process
for m2m transformations supported by iTrace: first,
the TCS (Jouault et al., 2006) injector/extractor for
ATL files bundled in the AMMA platform
3
produces
a transformation model from a given ATL transfor-
mation (a); next, such transformation model is en-
riched by a HOT (b) and finally the resulting transfor-
mation models is again serialized into an ATL model
transformation (c). As mentioned before, the execu-
tion of such enriched transformation will produce not
only the corresponding target models, but also a traces
model.
The result of this enrichment process is par-
3
The Atlas Model Management Architecture Platform.
Available in: http://www.sciences.univ-nantes.fr/lina/atl/
AMMAROOT/.
ENASE2014-9thInternationalConferenceonEvaluationofNovelSoftwareApproachestoSoftwareEngineering
8
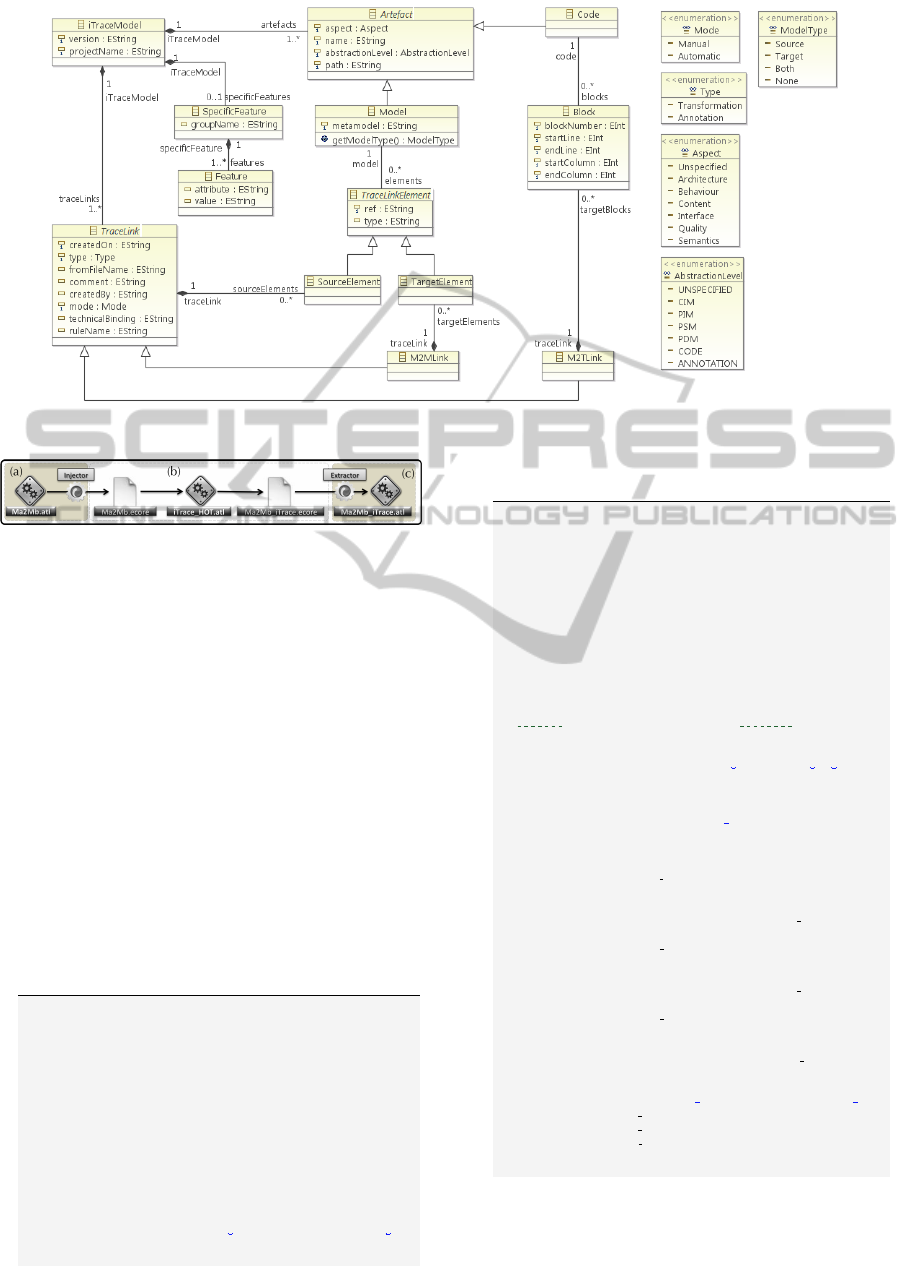
Figure 2: The iTrace metamodel.
Figure 3: Adding traceability capabilities in ATL transfor-
mations - adapted from (Jouault, 2005).
tially illustrated by Listings 1 and 2 which
show a transformation rule and its refactored ver-
sion. More concretely, Listing 1 shows the
MemberEnd2NotNullOnTT mapping rule while List-
ing 2 shows the version of such rule produced by the
enrichment process. Note that LOC 1-15 (in both ver-
sions) and 16-19 (original) and 42-47 (refactored) re-
main invariant.
By contrast, lines 16-41 in the refactored corre-
spond to the statements incorporated with the aim of
producing iTrace objects. More concretely, lines 17-
26 correspond to the generation of a TraceLink; next,
mirror source (27-36) and target (37-41) objects are
also generated and latter related with the target ob-
jects produced by the mapping rule (44-46).
Listing 1: Original version of MemberEnd2NotNullOnTT
transformation rule.
1 r u l e MemberEnd2NotNullOnTT {
2 f r o m
3 pr o p : UML! P r o p e r t y ,
4 c : UML! C l a s s
5 (
6 ( pr o p . is A s s o c i a t i o n L o w e r M o r e T h a n Z e r o ( ) ) a nd
7 ( c . g e n e r a t e s T y p e d T a b l e ( ) ) a nd
8 ( c . ownsMemberEnd ( pr o p ) ) an d
9 ( n o t c . i s A b s t r a c t )
10 )
11 t o
12 n o t N u l l : SQL2003 ! N o t N u l l (
13 t a b l e <− t h i s M o d u l e . r e s o l v e T e m p ( c , ’ t t ’ ) ,
14 co l umn s <− p r o p
15 )
16 do {
17 pr o p . name . debug ( ’ r u l e MemberEnd2NotNullOnTT ’ ) ;
18 }
19 }
Listing 2: Refactored version of MemberEnd2NotNullOnTT
transformation rule.
1 r u l e MemberEnd2NotNullOnTT {
2 f r o m
3 pr o p : UML! P r o p e r t y ,
4 c : UML! C l a s s
5 (
6 ( pr o p . is A s s o c i a t i o n L o w e r M o r e T h a n Z e r o ( ) ) a nd
7 ( c . g e n e r a t e s T y p e d T a b l e ( ) ) a nd
8 ( c . ownsMemberEnd ( pr o p ) ) an d
9 ( n o t c . i s A b s t r a c t )
10 )
11 t o
12 n o t N u l l : SQL2003 ! N o t N u l l (
13 t a b l e <− t h i s M o d u l e . r e s o l v e T e mp ( c , ’ t t ’ ) ,
14 col u m ns <− pro p
15 )
16 −− Beg i n Added by i T r a c e
17 , Tr a c e L i n k : i T r a c e ! M2MLink (
18 rule N a m e <− ’ MemberEnd2NotNullOnTT ’ ,
19 comment <− ’ A u t o m a t i c g e n e r a t i o n by i T r a c e ’ ,
20 c r e a t e d O n <− ’ 15−02−2013 ’ ,
21 mode <− ’ Aut om a t i c ’ ,
22 t e c h n i c a l B i n d i n g <− ’ATL ’ ,
23 c r e a t e d B y <− ’ i T r a c e Too l ’ ,
24 t y p e <− ’ T r a n s f o r m a t i o n ’ ,
25 iT r a c e M o d e l <−t h i s M o d u l e . g e t T r a c e M o d e l R o o t
26 ) ,
27 e l e m e n t S o u r c e p r o p : i T r a c e ! S o u r c e E l e m e n t (
28 t y p e <− p r o p . oc l T y p e ( ) . t o S t r i n g ( ) ,
29 t r a c e L i n k <− Tr a ce L i n k ,
30 model <− t h i s M o d u l e . getModel UML
31 ) ,
32 e l e m e n t S o u r c e c : i T r a c e ! S o u r c e E l e m e n t (
33 t y p e <− c . o c l T y p e ( ) . t o S t r i n g ( ) ,
34 t r a c e L i n k <− Tr a ce L i n k ,
35 model <− t h i s M o d u l e . getModel UML
36 ) ,
37 e l e m e n t T a r g e t n o t N u l l : i T r a c e ! T a r g e t E l e m e n t (
38 t y p e <− n o t N u l l . o c l T y p e ( ) . t o S t r i n g ( ) ,
39 t r a c e L i n k <− Tr a ce L i n k ,
40 model <− t h i s M o d u l e . getModel SQ L 2003
41 )
42 do {
43 pr o p . name . debug ( ’ r u l e MemberEnd2NotNullOnTT ’ ) ;
44 e l e m e n t S o u r c e p r o p . r e f S e t V a l u e ( ’ o b j e c t ’ , p r o p ) ;
45 e l e m e n t S o u r c e c . r e f S e t V a l u e ( ’ o b j e c t ’ , c ) ;
46 e l e m e n t T a r g e t n o t N u l l . r e f S e t V a l u e ( ’ o b j e c t ’ ,
47 n o t N u l l ) ;
48 } }
VisualizingTraceabilityInformationwithiTrace
9
5 iTrace VISUALIZATION
MECHANISMS
Once traceability data has been persisted in the shape
of trace models, being able to visualize such links is
valuable, at least as an exploratory aid (Kerren, 2008).
However, the development of tool support to that end
is a non-trivial task and considerable effort is needed
to recover, browse and maintain traces (Marcus et al.,
2005).
In the following, the visualization mechanisms for
traceability data supported by iTrace are introduced.
A multipanel editor for trace models is first presented
and then the use of dashboards providing aggregated
and non-aggregated views of traceability data is de-
scribed. The former can be seen as a tool for low-
level management of traces whereas the latter pro-
vides high-level information from such traces.
5.1 Multipanel Editor for Trace Models
iTrace bundles an ad-hoc EMF-based multipanel ed-
itor for trace models. Such editor supports the man-
agement (visualization and edition) of the EMF trace
models generated from the execution of model trans-
formations. Note that such transformations are previ-
ously enriched by iTrace to support the generation
of traces.
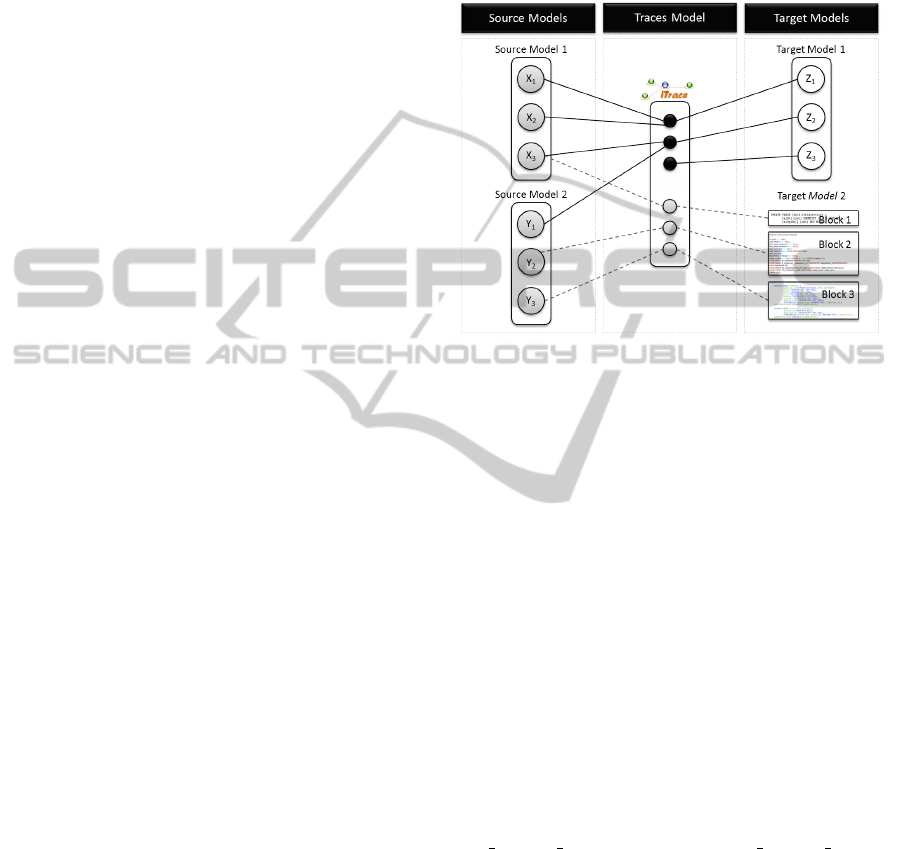
Fig. 4 provides a high-level overview of the
planned structure for the editor. In order to overcome
the limitations described in Section 2 the editor was
devised to support the following set of functionalities:
• It should bundle three different panels to show
separately the source models, the trace model and
the target models. If there are several source or
target models, they should be co-located verti-
cally in their corresponding panel. Even the same
model could appear in both panels if it is refer-
enced both as source and target model by any set
of traces.
• The panel for target models should be adapted to
the nature of the models displayed, i.e. a proper
set of models or source-code files. Note that, in
the end, a source-code file is another model, this
one with the lowest level of abstraction. Thus,
the term models might be used as well to refer to
source-code files in the following.
• The user should be able to drag elements from
source and target models and drop them on the
traces model to create new trace-link objects.
• If the user selects a trace-link object, the editor
has to highlight automatically the elements ref-
erenced by the selected link, either model ele-
ments or source-code blocks, in the corresponding
model or source-code file.
• If the user selects a source or target element, the
editor must highlight the trace-link objects that
reference it.
Figure 4: Desired behavior for the iTrace multipanel edi-
tor.
In the following, two of the traces models pro-
duced in the running example are displayed in the
multipanel editor bundled in iTrace to illustrate the
final result.
5.1.1 Running Example
When the UML2SQL2003 model transformation is run
using the OMDB class diagram as input, an SQL:2003
ORDB model plus a traces model between both mod-
els are generated.
Figure 5 shows an excerpt of such traces model
displayed in the multipanel editor of iTrace.
Note that as the Property persons source ele-
ment is selected, the trace-links referencing it are
automatically highlighted: M2M Link generate-
AtributteRef. The target elements referenced by
those traces are highlighted as well in the SQL2003
model: attribute persons, Reference Type
Ref Person Type y MULTISET Ref Person Type.
To illustrate the visualization of m2t traces mod-
els, figure 6 shows an excerpt of the traces model pro-
duced by the ORDB4ORA2CODE transformation in the
running example. In this case, the right panel shows
the SQL script generated to implement the ORDB
schema modeled in the source model (ORDB4ORA
model). The selection of the first trace-link (M2T
Link generateAttribute) results in the automatic
highlighting of the corresponding source elements
(Attribute country) and associated source-code
(country column in line 6 of the SQL script).
ENASE2014-9thInternationalConferenceonEvaluationofNovelSoftwareApproachestoSoftwareEngineering
10
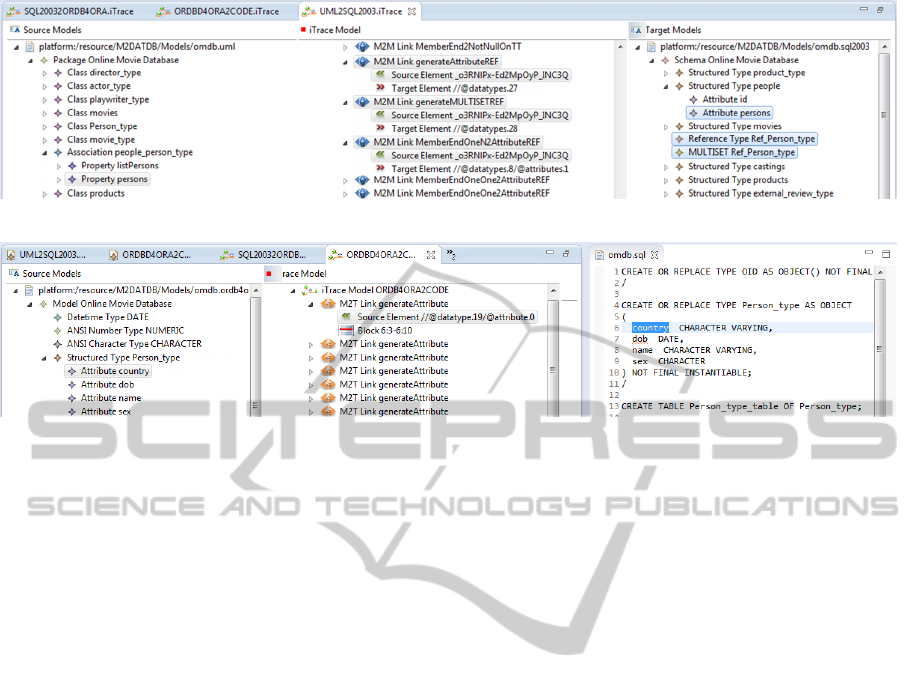
Figure 5: UML2SQL2003 m2m traces model displayed in the iTrace multipanel editor.
Figure 6: ORDB4ORA2CODE m2t traces model displayed in the iTrace multipanel editor.
Notice for instance the utility of the editor for
change impact analysis since it eases enormously
tracking dependencies between source and target el-
ements and the other way round.
5.2 Dashboards for Traceability Data
A quick look at the traces model shown in the pre-
vious section serves to give an idea of the number
of traces that can be generated by any MDE project.
The multipanel editor introduced supports efficiently
edition of such traces. Nevertheless, working at this
level of abstraction might not fit to all the stakehold-
ers involved in the project. Aggregated views provid-
ing with high-level information of the raw data (trace-
links) would be welcome in this context.
To address this issue, iTrace leans on BI tools to
support the multidimensional analysis of traces mod-
els. The aim is to elicit knowledge from the trace-
links gathered during the project. To that end, traces
models are first denormalized and then used to pop-
ulate QlikView (QlikTech International AB, ) dash-
boards. As a result, high-level overviews of the rela-
tionships between the artefacts involved in the devel-
opment process are obtained. In the following, three
particular dashboards produced in the running exam-
ple are used to illustrate the proposal.
5.2.1 Running Example: Project Overview
Dashboard
The Project overview dashboard shows all the
model elements involved in the project under study
(including source-code blocks), as well as their re-
lationships. Besides, it allows assessing the contri-
bution of each element to the project by identifying
the #LOC directly related with it. Figure 7 shows an
screen capture of the dashboard which is divided into
two main blocks:
Upper part allows tracking all the relationships of
a given element along the project. To that end, it
shows all the model elements so that when a given
element is selected, related elements in the rest of
models are automatically highlighted while the rest
of elements are greyed-out. For instance, the figure
shows that the selection of a UML element results in the
highlighting of related elements in the SQL2003 and
ORACLE models, as well as the corresponding source-
code blocks. Currently the framework uses the unique
identifier of every model element to display them in
the dashboard. However, more intuitive identifiers
will be used in future versions.
Lower part of the dashboard (Most Impacted El-
ements by Model) shows the elements of each model
which are associated with the highest #LOC. In this
case, the UML is related to 4.44% of the total #LOC
generated in the project.
Model transformations are inherently complex
(Bollati et al., 2013). They get even more complex
when they aim at lowering the level of abstraction at
which software is modelled to support code genera-
tion since the semantic gap between the models in-
volved implies making assumptions and adding ex-
tra machinery to consider all the possible scenarios.
In this context, the Project overview dashboard
abstracts from such complexity providing a quick
overview of the relationships between the different el-
ements of the project without having to look at the
VisualizingTraceabilityInformationwithiTrace
11
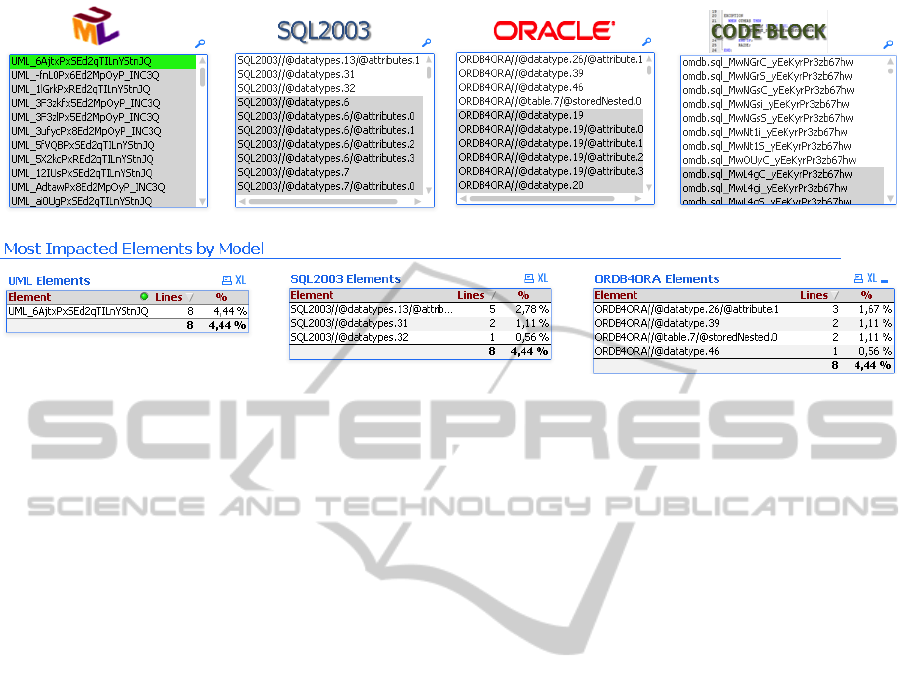
Figure 7: Project overview dashboard.
source code that implements the model transforma-
tions connecting them.
5.2.2 Running Example: Mapping Rules
Overview Dashboard
The Mapping rules overview dashboard shown in
Fig. 8 goes a step further, since it provides a closer
look at the transformations involved in the project. In
particular, it allows identifying which are the rules in-
volved in a given transformation and which is their
role in the project. The latter refers to the workload
of such rules, i.e. the amount of objects effectively
mapped by the mapping rule under consideration.
To that end, upper side of the dashboard bundles
a set of controls to define high-level criteria for the
analysis. This way, the traces that will be analyzed
can be filtered according to:
• Transformations: only traces produced by the se-
lect model transformations will be considered.
• Type: only model-to-model or model-to-text
traces will be considered.
• Mapping Rules: only traces produced by the se-
lected mapping rules will be considered.
Likewise, the model elements that will be object
of consideration can be filtered according to another
set of criteria:
• Artefact: only elements included in the selected
models or source-code files will be considered.
• Relation Type: depending on the selection, only
model elements used that were either as source or
target objects of the selected transformations will
be considered.
• Abstraction Level: only model elements belong-
ing to models defined at the selected abstraction
levels will be considered.
• Artefact Type: depending on the selection, only
model elements or source-code blocks will be
considered.
Obviously, none of the criteria above are manda-
tory. That is to say, the user might set no values for
any of them. If so, no filtering is applied and ev-
ery trace (respectively model element) is considered
in the analysis.
Once the criteria have been fixed (if any), the cen-
tral and lower part of the dashboard collects aggre-
gated data regarding the number of traces, model ele-
ments (referred to as traced elements) and source-
code blocks, which fulfill the criteria. In this case, the
table in the middle shows which are the mapping rules
producing more traces. In particular, it shows the top
8 rules, while the rest are blended into the Others
row.
First and second columns show respectively the
transformations and mapping rules rules under con-
sideration (those that meet the filtering criteria). Next
columns show the number of trace links produced by
each mapping rule and the percentage over total num-
ber of traces produced by the mapping rules selected.
Following columns show also the number of model
elements and source-code blocks referenced by each
mapping rule.
For instance, second row of the table states that
the MemberEnd2Not-NullOnTT of the UML2SQL2003
transformation generates 16 trace links (15.38% over
the total number of trace links produced by the se-
lected mapping rules) and such links refer to 48 model
elements (note that not every trace link represents a
one-to-one relationship).
Finally, lower side of the dashboard provides dif-
ENASE2014-9thInternationalConferenceonEvaluationofNovelSoftwareApproachestoSoftwareEngineering
12
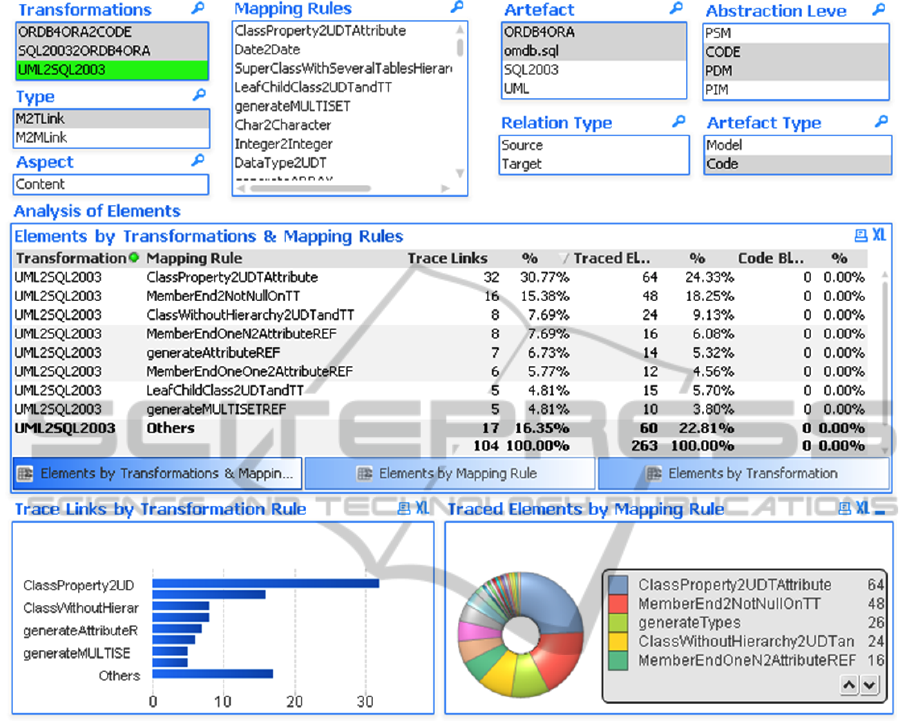
Figure 8: Mapping rules overview dashboard.
ferent views of these data. The bar graph on the left
summarizes the number of trace links produced by
each transformation rule, while the pie chart on the
right represents the distribution of traced elements by
transformation rule.
The information collected in this dashboard could
be used by model-transformation developers to lo-
cate candidates for refining. For instance, the data
presented in Fig. 8 highlights the importance of
the ClassProperty2UDTAttribute mapping rule,
which generates more than 30% of the trace links pro-
duced by the UML2SQL2003 transformation. Thus, this
rule might be object of study if transformation devel-
opers aims at optimizing the overall performance of
the transformation.
5.2.3 Running Example: Mapping Rules Detail
Dashboard
Model transformations are inherently complex (Bol-
lati et al., 2013). Therefore, dealing with legacy trans-
formations might be even more complex. The analy-
sis of trace models can be used to raise the abstrac-
tion level at which we think about model transfor-
mations. In addition, it allows the developer to ab-
stract from the particular model transformation lan-
guage used and provide him with simple and compre-
hensible information regarding the mapping rules that
compose the different transformations.
For instance, Listing 1 showed a code excerpt
from the UML2SQL2003 transformation. In particular,
it shows the MemberEnd2NotNullOnTT mapping rule.
To understand the functionality of this rule and what
type of elements it maps, a minimum knowledge of
ATL is needed.
By contrast, a quick look at the dashboard shown
in Fig.9 let us know at first sight which the purpose
of the mapping rule is. Indeed, no previous knowl-
edge of ATL is needed. The information displayed on
the upper side of the dashboard reveals that the rule is
part of the UML2SQL2003 transformation and it maps
UML objects into SQL2003 objects (recall that the
name of the transformations are now always as intu-
VisualizingTraceabilityInformationwithiTrace
13
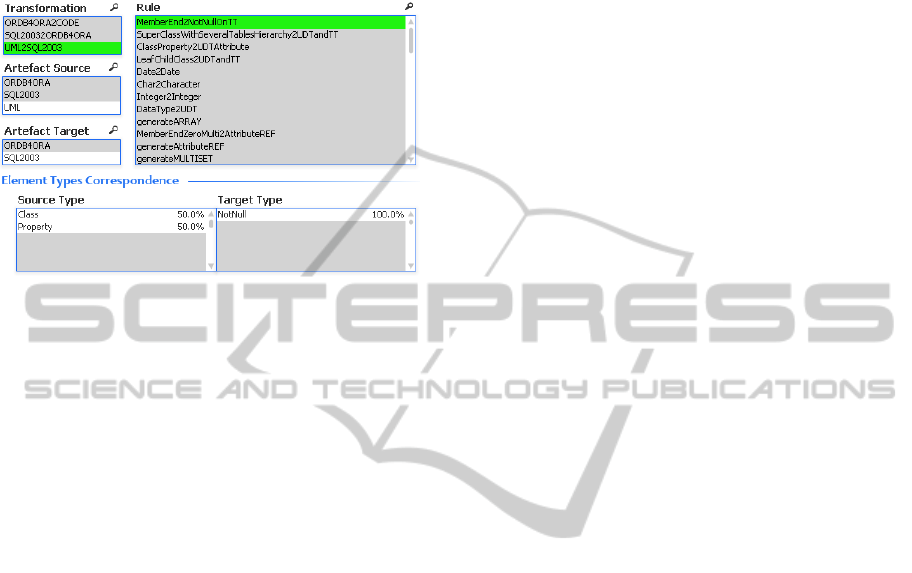
itive as here). More revealing is a look at the lower
side of the dashboard which shows that the rule is re-
sponsible for mapping pairs of Class and Property
objects into NotNull objects.
Figure 9: Mapping rules detailed dashboard.
Note that the dashboard provides this type of in-
formation for all the transformations bundled in the
project under study. To move through them, the up-
per side of the dashboard provides a set of filters that
allow the user to select a particular transformation,
source model, target model or mapping rule/s (non-
selected filtering values are greyed-out). The bot-
tom part of the dashboard shows the type of elements
transformed by the mapping rules that meet the crite-
ria established by the user. Note also that this analy-
sis may be useful in order to document not only m2m
transformations, but also m2t ones.
To sum up, iTrace supports a number of dif-
ferent visualizations with different granularity levels:
transformations, transformation rules and model (ele-
ments). For the sake of space just some of them have
been introduced here to illustrate the utility and po-
tential of the proposal.
6 CONCLUSION AND FUTURE
WORKS
Despite the prominent role played by traceability in
SE has been widely acknowledged, it is commonly
omitted since dealing with traceability is a task inher-
ently complex. The main principles of MDE, where
models, model transformations and automation act as
main actors, might contribute to boost the actual us-
age of traceability data (Santiago et al., 2012). In this
sense, huge effort is still needed to recover, browse
and maintain trace-links (Marcus et al., 2005). Never-
theless, even though MDE tooling has reached certain
levels of maturity during the last years (Volter, 2011)
the management of traceability leaves still much room
for improvement (Kuhn et al., 2012).
In particular, this work has first introduced the
main issues related with the visualization of traceabil-
ity data to later introduce the solutions provided by
iTrace an EMF-based framework for the manage-
ment of traceability data in MDE projects. On the one
hand, the framework bundles a multipanel panel edi-
tor for trace models (both m2m or m2t trace models)
that can be used to support low-level management of
traceability data. On the other hand, such data is de-
normalized in order to populate different dashboards
that provide high-level views of the traceability infor-
mation.
The dashboards from the running example have
shown that the information provided can be used to
produce a high-level overview of the transformations
involved in a project, to explain the purpose of a
particular mapping rule or to identify the rules that
should be optimized in order to improve the execution
of a given transformation. Besides, it is worth not-
ing that, once the data has been denormalized, ad-hoc
dashboards can be defined at will for different pur-
poses.
Three main lines are distinguished regarding di-
rections for further work. First, we are working to
support the extraction of partial trace models. The
idea is to produce trace models attending to the crite-
ria previously defined by the user by selecting a num-
ber of trace-links from a given trace model. Besides,
support for text-to-model transformations is also be-
ing integrated in the framework, so that Model-Driven
Reverse Engineering projects can be also object of
study. Therefore, the visualization of text-to-model
traces will be tackled as well. Finally, we would like
to emphasize the fact that we are currently working
on the evaluation of the tool with external MDE de-
velopers.
ACKNOWLEDGMENTS
This research is partially funded by the MASAI
project, financed by the Spanish Ministry of Science
and Technology (Ref. TIN2011-22617).
REFERENCES
Alexander, M. and Valkenbach, J. (2010). Excel Dash-
boards and Reports. Wiley Publishing, Inc.
AMW. URL: http://www.eclipse.org/gmt/amw/.
Asunci
´
on, H. U. (2008). Towards practical software trace-
ability. In Companion of the 30th international confer-
ence on Software engineering, ICSE Companion ’08,
pages 1023–1026, New York, NY, USA. ACM.
ENASE2014-9thInternationalConferenceonEvaluationofNovelSoftwareApproachestoSoftwareEngineering
14

Bernstein, P. (2003). Applying Model Management to Clas-
sical Meta Data Problems. In 1st Biennial Confer-
ence on Innovative Data Systems Research, pages 1–
10, Asilomar, CA, USA.
Bollati, V., Vara, J. M., Jim
´
enez, A., and Marcos, E. (2013).
Applying MDE to the (semi-)automatic development
of model transformations. Information and Software
Technology, 55(4):699–718.
De Lucia, A., Oliveto, R., Zurolo, F., and Di Penta, M.
(2006). Improving Comprehensibility of Source Code
via Traceability Information: a Controlled Experi-
ment. In Proceedings of the 14th IEEE International
Conference on Program Comprehension (ICPC’06),
pages 317–326. IEEE.
De Souza, C. R. B., Hildenbrand, T., and Redmiles, D.
(2007). Toward visualization and analysis of trace-
ability relationships in distributed and offshore soft-
ware development projects. In 1st International Con-
ference on Software Engineering Approaches for Off-
shore and Outsourced Development, SEAFOOD’07,
pages 182–199, Berlin, Heidelberg. Springer-Verlag.
Didonet Del Fabro, M., B
`
ezivin, J., and Valduriez, P.
(2006). Weaving Models with the Eclipse AMW plu-
gin. In Eclipse Modeling Symposium, Eclipse Summit
Europe.
Feuerlicht, G., Pokorn
´
y, J., and Richta, K. (2009). Object-
Relational Database Design: Can Your Application
Benefit from SQL: 2003? In Information Systems De-
velopment, pages 1–13. Springer US.
Gronback, R. C. (2009). Eclipse Modeling Project: A
Domain-Specific Language (DSL) Toolkit. Eclipse Se-
ries. Addison-Wesley Professional.
IEEE (1990). IEEE Standard Glossary of Software Engi-
neering Terminology. Technical report, Institute of
Electrical and Electronics Engineers.
ITrace. URL: http://www.kybele.etsii.urjc.es/itracetool/.
Jim
´
enez, A., Vara, J. M., Bollati, V., and Marcos, E. (2012).
Developing a multi-panel editor for EMF traces mod-
els. In 1st Workshop on ACademics Modelling with
Eclipse (ACME), Kgs. Lyngby (Dinamarca).
Jouault, F. (2005). Loosely coupled traceability for ATL.
In 1st European Conference on Model-Driven Ar-
chitecture: Traceability Workshop (ECMDA’05), vol-
ume 91, pages 29–37, Nuremberg, Germany.
Jouault, F., B
´
ezivin, J., and Kurtev, I. (2006). TCS: a DSL
for the specification of textual concrete syntaxes in
model engineering. In 5th International Conference
on Generative Programming and Component Engi-
neering, GPCE ’06, pages 249–254, New York, NY,
USA. ACM.
Kerren, A. (2008). Information Visualization: Human-
Centered Issues and Perspectives. Springer, 1 edition.
Kimball, R. (1998). The Data Warehouse Lifecycle Toolkit.
Wiley.
Kuhn, A., Murphy, G. C., and Thompson, C. A. (2012).
An exploratory study of forces and frictions affect-
ing large-scale model-driven development. In Model
Driven Engineering Languages and Systems, pages
352–367. Springer.
Marcus, A., Xie, X., and Poshyvanyk, D. (2005). When and
how to visualize traceability links? In 3rd Interna-
tional Workshop on Traceability in Emerging Forms
of Software Engineering, TEFSE ’05, pages 56–61,
New York, NY, USA. ACM.
MetagemTrace. URL: http://www.kybele.etsii.urjc.es/
metagem-trace/.
ModeLink. URL: http://www.eclipse.org/epsilon/doc/
modelink/.
Mohagheghi, P. and Dehlen, V. (2007). An overview of
quality frameworks in model-driven engineering and
observations on transformation quality. In Workshop
on Quality in Modeling, pages 3–17.
Obeo. URL: http://www.obeo.fr/pages/acceleo/en.
Oliveto, R. (2008). Traceability Management Meets Infor-
mation Retrieval Methods - Strengths and Limitations.
In 12th European Conference on Software Mainte-
nance and Reengineering (CSMR’2008), pages 302–
305.
QlikTech International AB. URL: http://
www.qlikview.com.
Ramesh, B., Stubbs, C., Powers, T., and Edwards, M.
(1997). Requirements traceability: Theory and prac-
tice. Annals of Software Engineering, 3:397–415.
Santiago, I., Jim
´
enez, A., Vara, J. M., De Castro, V., Bollati,
V., and Marcos, E. (2012). Model-Driven Engineering
As a New Landscape For Traceability Management:
A Systematic Review. Information and Software Tech-
nology, 54(12):1340–1356.
Santiago, I., Vara, J. M., De Castro, V., and Marcos, E.
(2013). Towards the effective use of traceability
in Model-Driven Engineering projects. In Ng, W.,
Storey, V. C., and Trujillo, J. C., editors, 32nd Interna-
tional Conference on Conceptual Modeling (ER’13),
volume 8217 of Lecture Notes in Computer Science,
pages 429–437, Hong-Kong. Springer Berlin Heidel-
berg.
Schmidt, D. (2006). Model-Driven Engineering. IEEE
ComputerComputer, 39(2):25–31.
Sendall, S. and Kozaczynski, W. (2003). Model transfor-
mation: The heart and soul of model-driven software
development. IEEE Software, 20(5):42–45.
Tisi, M., Cabot, J., and Jouault, F. (2010). Improv-
ing higher-order transformations support in ATL. In
International Conference on Model Transformation
(ICMT’2010), pages 1–10.
Vara, J. M. and Marcos, E. (2012). A framework for model-
driven development of information systems: Techni-
cal decisions and lessons learned. Journal of Systems
and Software, 85(10):2368–2384.
Volter, M. (2011). From Programming to Modeling - and
Back Again. Software, IEEE, 28(6):20–25.
von Pilgrim, J. URL: http://gef3d.org.
Yie, A. and Wagelaar, D. (2009). Advanced Traceability
for ATL. In 1st International Workshop on Model
Transformation with ATL (MtATL 2009), pages 78–
87, Nantes, France.
VisualizingTraceabilityInformationwithiTrace
15
