
A Novel Framework for Computing Unique People Count from
Monocular Videos
Satarupa Mukherjee and Nilanjan Ray
Department of Computing Science, University of Alberta, Edmonton, Alberta T6G2E8, Canada
1 STAGE OF THE RESEARCH
I am a 5th year PhD student in the department of
Computing Science in University of Alberta. I have
passed my candidacy examination last year. I am cur-
rently in the final stage of my research and planning
to defend by next semester.
In my PhD thesis, I have developed a novel peo-
ple counting algorithm for computing unique people
count from monocular videos. The algorithm has the
capability of handling severe occlusion in addition to
computing unique people count with exorbitant accu-
racy. Also it is online in nature, and does not accumu-
late error over time.
I have performed extensive experiments with the
proposed algorithm on four standard datasets - the
UCSD dataset (Chan et al., 2008), which consist of
a full one hour video of 25,656 frames, the FUDAN
dataset (Tan et al., 2011) consisting of 1500 frames,
the LHI dataset (Cong et al., 2009) which has 12
videos captured at different camera angles (90 de-
gree, 65 degree and 40 degree) and of duration be-
tween 5 minutes and 15 minutes, and the PETS 2009
dataset (Krahnstoever et al., 2008) consisting of mul-
tiple camera views, targeted at the evaluation of vari-
ous surveillance applications. The algorithm has pro-
duced more than 95% accuracy for most of these
videos.
2 INTRODUCTION
People counting is important for solving many impor-
tant applications like traffic management, detection
of overcrowded situations in public buildings, tourist
flow estimation, surveillance and many others. It is
also a significant component in video analytics. By
unique people count, we mean the computation of
the total number of people in a specific time interval
by counting a person only once while the person is
present within a field of view (FOV) or a region of
interest (ROI) within the FOV.
People counting systems can be roughly catego-
rized into computer vision based and non-computer
vision based techniques. The non-computer vision
based systems use many different technologies (Box
and Oppenlander, 2010), each with its own advan-
tages and disadvantages. Probably the most straight-
forward system is the tally counter or clicker counter.
It has a very simple working mechanism where press-
ing a button activates the count. However, the method
needs human intervention, which is both labour and
cost intensive. A very accurate people counting sys-
tem is the mechanical counter, known as the turnstile,
which needs to be turned by the individual each time
he/she crosses it in order to take into account the indi-
vidual count. However again, this method is invasive
and disruptive. Laser beam-based sensors are among
the non-invasive methods used frequently in railway
stations. These methods are inexpensive, but they are
not suitable for counting people in outdoor environ-
ments, because their performance can be negatively
affected when subjected to direct sunlight. Another
well-known non-invasive people counter is based on
thermal sensors. However, once again, they are sensi-
tive to ambient temperatures.
Computer vision-based solutions to date are
mainly based on methods that use either a camera
network or a monocular video. The network of mul-
tiple cameras is one of the most advanced technolo-
gies used for people counting. It takes into account
different views of people with different camera an-
gles to avoid occlusion. But setting up of the system
can be costly and the process may often be cumber-
some due to lack of resources. Moreover, homogra-
phy constraints often need to be applied (Black and
Ellis, 2006) for finding out correspondences among
views of people obtained from multiple cameras in
order to perform any kind of tracking or counting.
The homography computation may also lead to the
occurrence of transfer errors (summation of the pro-
jection error in each camera view for a pair of cor-
respondence points) that needs to be dealt with. Our
proposed approach to finding the unique people count
is based on monocular videos. Our principal moti-
3
Mukherjee S. and Ray N..
A Novel Framework for Computing Unique People Count from Monocular Videos.
Copyright
c
2014 SCITEPRESS (Science and Technology Publications, Lda.)

vation is to make use of existing cameras and avoid
expensive camera network setup and maintenance.
3 OUTLINE OF OBJECTIVES
Based on the above discussion, the objectives of my
PhD thesis are as follows -
i. Compute unique people count over a certain inter-
val of time from monocular videos.
ii. Make use of existing cameras by avoiding expen-
sive camera setup and maintenance.
iii. Overcome occlusion problems and still obtain re-
markable people count accuracies.
iv. Apply the algorithm on different scenarios and
various kinds of human figures.
4 RESEARCH PROBLEM
My PhD thesis aims to develop a robust algorithm,
the input of which is a monocular video consisting of
human views and the output will be the total unique
count of people within certain duration of the video.
The aim of the algorithm is its application towards
real life problems. To avoid the expensive and also
challenging video camera network system, it works
on the view taken from a single camera. Finally, apart
from dealing with sparse crowds, the algorithm is able
to deal with large as well as dense crowds. Hence, it
is capable of handling occlusions.
5 STATE OF THE ART
The computer vision based algorithms for people
counting from monocular videos are mainly used for
finding out two types of counts - frame based people
count and unique people count. Frame based count is
also known as density estimation.
The frame based people counting algorithms
count people in individual video frames with rea-
sonable accuracy even in the presence of occlu-
sions (Chan et al., 2008; Chan and Vasconcelos, 2012;
Chan and Vasconcelos, 2009; Conte et al., 2010;
Tan et al., 2011; Lempitsky and Zisserman, 2010).
These methods use extracted features from individual
frames and count the number of people in each frame
with the help of machine learning techniques that map
the extracted features to the number of people present
in the frame. But these methods fail to count the
unique number of people present in a video over an
interval of time, as they do not consider the corre-
spondence of the same person over multiple frames.
For example, if there are n people in the first frame
and one person enters, while another person exits the
FOV in the second frame, the frame based counting
will produce n as the people count for the second
frame. However, the unique count of people for the
two frames should be n+ 1.
The computer vision based solutions to unique
people count can be further categorized into three
types: a) the detection and tracking based approach
(Harasse et al., 2005; Kim et al., 2002; Zeng and Ma,
2010), b) the visual feature clustering based approach
(Brostow and Cipolla, 2006; Rabaud and Belongie,
2006) and c) the line of interest (LOI) counting ap-
proach (Ma and A.B.Chan, 2013; Cong et al., 2009;
Kim et al., 2008). The first two individual based anal-
yses are somewhat successful for low density crowds
or overhead camera views, but they are not compe-
tent enough for large crowds. In these types of views,
there is too much occlusion, or people are depicted by
only a few pixels or the situations are too challeng-
ing for tracking. The LOI counting methods are ca-
pable of handling occlusion, but these methods have
received relatively less attention so far.
The detection and tracking based approaches (Ha-
rasse et al., 2005; Kim et al., 2002; Zeng and Ma,
2010) count people by detecting individuals in an im-
age and creating corresponding trajectories by track-
ing them. The number of trajectories in an interval of
time accounts for the number of people. This tech-
nique works well for situations where the object size
is large, the crowd is not too dense and occlusion is
not severe. Large object size helps in the detection
as there are enough image pixels to depict the ob-
ject. Tracking is failsafe for overhead FOVs where
little or no occlusion is present. In case of whole
body views, where partial occlusion is present, par-
ticle filter based tracking can be applied. Applying
the detection-tracking approach becomes difficult in
dense crowds where each person is depicted by only
a few image pixels and people occlude each other in
complex ways. Detection becomes challenging due to
both occlusion and the small sizes of people. Occlu-
sion also poses a difficult challenge for tracking.
The visual feature trajectory clustering meth-
ods (Brostow and Cipolla, 2006; Rabaud and Be-
longie, 2006) cluster feature trajectories that exhibit
coherent motion and the number of clusters is used as
the number of moving objects. This type of method
requires sophisticated trajectory management, like
handling broken feature tracks due to occlusions or
measuring similarities between trajectories of differ-
ent length. Thus, in crowded environments, it is fre-
VISIGRAPP2014-DoctoralConsortium
4

quently the case that coherently moving features do
not belong to the same person. Thus, equating the
number of people to the number of trajectory clusters
becomes quite error prone. Once again, occlusion is a
serious bottleneck for these methods too.
The LOI counting methods (Ma and A.B.Chan,
2013; Cong et al., 2009; Kim et al., 2008) have re-
ceived much less attention so far. The basic principle
here is to construct a temporal image at the LOI over
a period of time. Next, the temporal image is con-
verted to a cumulative count of people that crossed
the LOI. But, often the methods are incapable of han-
dling dense crowds and the methods may not perform
well if the walking speed variesa lot within the crowd.
6 METHODOLOGY
The novel framework discussed in this paper, has a
monocular video as its input, consisting of human
views and the output of the framework is the total
unique count of people within a certain duration of
the video. The framework deals with both sparse as
well as dense crowds, because it is capable of han-
dling occlusions. Finally, a major advantage of the
proposed framework is that it is online in nature and
does not accumulate error over time.
We achieve the unique people count by a ROI
analysis that is in a sense similar to the control vol-
ume analysis in fluidics describing the flow of fluid
mass in/out/across a volume. Given a ROI within the
FOV of a monocular video, our method counts the
number of unique people who have entered or left
the ROI within a short period of time. Thus, we are
able to compute the influx and/or the outflux rate of
unique people at any time instant. Summing these
rates between any two time points provide us with the
unique people count. Our method achieves this feat
by combining frame-based people counting (a super-
vised machine learning method) with a simple ROI
boundary tracker. Because, our method only com-
putes pixel correspondence at the ROI boundary over
a short period, it is able to cope well with occlusions.
In this manner, our framework passes the responsibil-
ity of people count in the presence of occlusions to
the supervised learner, and avoids object tracking al-
together. The proposed method differs significantly
from the LOI methods, as we do not rely on any tem-
poral image generation and their analysis. Note also
that LOI counting method relies on straight lines of
interest, while our ROIs do not have such shape re-
strictions.
6.1 Background
Our proposed unique people count utilizes two tech-
niques: a) frame based count and b) ROI boundary
tracking. We discuss these two components in this
section.
(a) Frame based Count. The general idea here is to
extract features from an image frame and map these
features to the number of people present in the im-
age frame. This mapping is achieved by supervised
machine learning methods, such as Gaussian Process
regression (Chan et al., 2008).
The features that are taken into account include
foreground features obtained from a background sub-
traction method and texture features. Based on em-
pirical experiments, the background subtraction algo-
rithms chosen for our framework are the Approximate
Median method (McFarlane and Schofield, 1995) for
the UCSD and the PETS 2009 datasets, Mixture of
Gaussians method (Stauffer and Grimson, 1999) for
the FUDAN dataset and ViBe (Barnich and Droogen-
broeck, 2011) for the LHI dataset. The features con-
sidered for the frame based count are as follows:
i. Segment features are extracted to capture proper-
ties like shape, size etc. by computing a) fore-
ground area, b) perimeter of foreground area, and
c) perimeter-area ratio.
ii. Edge features, such as a) number of edge pix-
els, and b) edge orientation are computed. Edges
within a segment are strong cues about the num-
ber of people in it.
iii. Texture features - Texture features, which are
based on the gray-level cooccurrence matrix, are
used for estimating the number of pedestrians in
each segment (Chan et al., 2008; Tan et al., 2011).
The image is first quantized into eight gray levels
and masked by the segment. The joint probabil-
ity of neighboring pixels i and j within the image
frame I, p(I(i),I( j) | θ) is then estimated for four
orientations θε{0
◦
,45
◦
,90
◦
,135
◦
}.
a Homogeneity: the texture smoothness,
g
θ
=
∑
i, j
p(I(i),I( j) | θ)/(1+ |i− j|).
b Energy: the total sum-squared energy,
e
θ
=
∑
i, j
p(I(i),I( j) | θ)
2
.
c Entropy: the randomness of the texture distri-
bution,
h
θ
=
∑
i, j
p(I(i),I( j) | θ)logp(I(i),I( j) | θ).
Generally, features like foreground segmentation
area or number of edge pixels should vary linearly
with the number of people in each frame (Hou et al.,
2010; Zhu, 2005). Foreground segmentation area ver-
sus the individual frame-based manual people count
ANovelFrameworkforComputingUniquePeopleCountfromMonocularVideos
5

Figure 1: Plot of foreground segmentation area vs. people
count on first 1000 frames of the UCSD dataset.
over the first 1000 frames of the UCSD dataset is
plotted in Figure 1. It can be observed that the
overall trend is almost linear with some local non-
linearities. These local non-linearities occur due to
different reasons like occlusion, segmentation errors
in background subtraction, perspectiveforeshortening
etc.
The non-linearities are modeled by including ad-
ditional features, other than the segmentation areas,
which are mentioned above and handled by a machine
learner using a suitable kernel function. Here, we
experiment with two machine learners which are ca-
pable of handling non-linear relationships- Gaussian
Process (GP) Regressor (Rasmussen and Williams,
2006) and Support Vector Regressor (SVR) (Smola
and Scholkopf, 1998).
We choose the UCSD dataset to evaluate the per-
formance of the machine learners as it has many dense
crowd instances. For training, the number of people is
counted manually on 500 frames with variable crowd
densities and the features of each frame within the
ROIs are extracted. Next, the machine learners are
trained with these extracted features and the corre-
sponding people count in each frame within the ROI
to learn the relationship between the two. The per-
formance of the machine learners is then evaluated
on 1000 validation frames that are different from the
training frames. Manual count is also generated on
these 1000 validation frames to perform the quantita-
tive comparison between the two machine learners.
Figure 2 plots the predicted count versus the man-
ual count for both the machine learners on the 1000-
frame validation set. The dotted lines plot the pre-
dicted count from the machine learner, whereas the
solid lines denote the true count produced manually.
Both the GP Regressor and the SVR performs well on
all of the validation set. A quantitative analysis based
on mean squared error, mean absolute error and per-
centage of mean absolute error is reported in Table I.
Here it can be seen that the performance of the GP
Regressor is slightly better than that of the SVR. So,
(a)
(b)
Figure 2: Performance evaluation of the two machine learn-
ers.
we chose GP for our framework.
The kernel of the GP or SVR is a combination
of both linear and squared exponential kernels (RBF)
(Chan et al., 2008):
k(x
p
,x
q
) = α
1
(x
T
p
x
q
+ 1) + α
2
e
−kx
p
−x
q
k
2
α
3
+
α
4
δ(p,q),
where x
p
and x
q
are the p-th and q-th feature vec-
tors and α = {α
1
,α
2
,α
3
,α
4
} are the hyperparame-
ters.
(b) Boundary Tracking with Optical Flow. As has
been mentioned earlier, our proposed unique people
count is inspired by the control volume analysis in
fluidics. Thus, we need to account for people leav-
ing or entering the ROI. To mitigate the effect of oc-
clusion, we avoid the tracking of individual people in
our framework. Instead, we track pixels on the ROI
boundary over a short period of time. A number of
methods can be applied for tracking the ROI bound-
ary. However, we choose a simple off-the-shelf opti-
cal flow (Horn and Schunck, 1981) technique prin-
cipally to make our framework more accessible. The
optical flow computes pixel motion between two con-
secutive image frames, taking into account brightness
constancy. Optical flow has a rich history; we found
that a very basic technique (Horn and Schunck, 1981)
suffices for boundary tracking in our application. We
have used a publicly available implementation with
VISIGRAPP2014-DoctoralConsortium
6
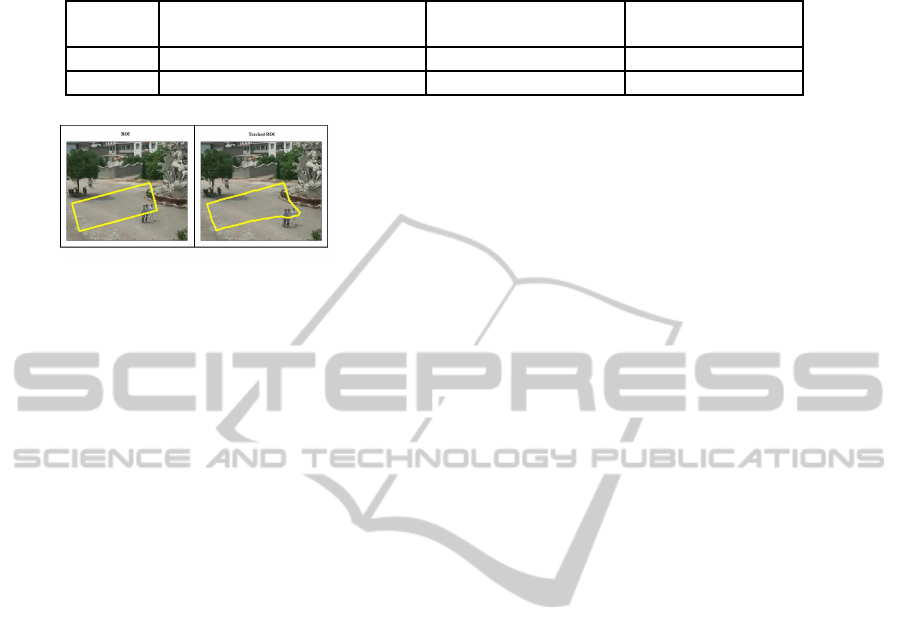
Table 1: Performance of GP and SVR on 1000 test frames.
Machine Mean Squared Error Mean Absolute Error Percent Mean
Learner (No. of people squared/frame) (No. of people/frame) Absolute Error (%)
GP 2.3818 1.2378 7.3
SVR 2.5151 1.3001 7.6
Figure 3: Actual ROI and Tracked ROI on an image of
video 3-3 of the LHI dataset.
the default parameter settings in all our experiments.
The original ROI and tracked ROI on an image of
video 3-3 of the LHI dataset is plotted in Figure 3 to
cite an example of boundary tracking.
6.2 Proposed Unique Count Framework
In this section, the proposed framework is presented.
Our proposed framework counts the unique number
of people who enter or leave an ROI within a time in-
terval. In order to realize the framework, we assume
availability of the following two functionalities dis-
cussed in the previous section:
Functionality 1. A ROI boundary tracker (Track)
that is able to track the boundary of ROI R for a short
while ∆t.
Functionality 2. A machine learner (Pred), which is
able to predict the number of people present within a
ROI on a single video frame.
With these two functionalities, the following
framework counts the number of unique people who
have entered or left the ROI R.
Unique Influx and Outflux Count (UIOC) for
t = 0,1,2,3,....
C
t
← Pred(I
t
,R);
R
d
← Track(I
t
,I
t+∆t
,R);
∆C
in
← Pred(I
t+∆t
,R ∪ R
d
) −C
t
;
∆C
out
← C
t
− Pred(I
t+∆t
,R ∩ R
d
);
F
t
in
← ∆C
in
/∆t;
F
t
out
← ∆C
out
/∆t;
end
Output at time point t: F
t
in
,F
t
out
,C
t
.
Unique influx count between t
1
and t
2
is C
t
1
+
t
2
∑
t=t
1
F
t
in
,
and unique outflux count between t
1
and t
2
is
C
t
2
+
t
2
∑
t=t
1
F
t
out
,
where,
I
t
: Video frame at time t
R: Region of interest (ROI)
R
d
: Deformed ROI due to boundary tracking between
frames I
t
and I
t+∆t
.
∆C
in
: Unique influx between time points t and t + ∆t
∆C
out
: Unique outflux between time points t and
t + ∆t
F
t
in
: Influx rate of people at time t
F
t
out
: Outflux rate of people at time t.
The Track functionality tracks the ROI boundary
R from I
t
through I
t+∆t
. Track returns R
d
, which
is the deformed ROI due to the pixel motion at the
boundaries of R. The Pred functionality counts the
number of people within a ROI based on extracted
image features. If a ROI neither consumes nor gener-
ates people, the influx and the outflux count over a pe-
riod of time should be equal, assuming accurate per-
formance by the two aforementioned functionalities.
We refer to such a ROI as a (mass) conserving ROI.
An example of a non-conserving ROI, where people
get consumed and/or generated, is a view of an eleva-
tor, in which people enter or come out of.
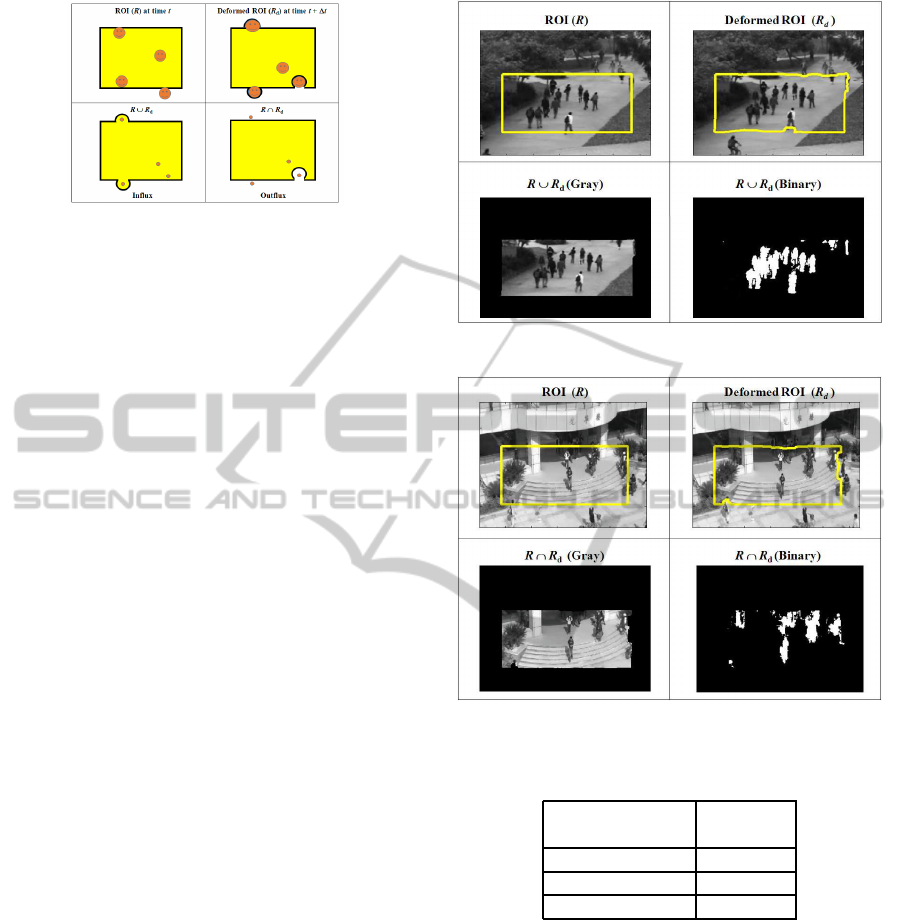
Figure 4 explains why the framework works. The
top left part of Figure 4, illustrates the positions of
people and the ROI R at time instant t. The top right
panel displays the positions of people at time instant
t + ∆t as well as the deformed ROI R
d
. Notice that
R
d
is a result of tracking the boundaries of R be-
tween t and t + ∆t. The bottom left and right panels
respectively show set union and intersection of the
original ROI R and the deformed ROI R
d
. For clar-
ity, the positions of people at time instant t + ∆t at
the bottom two panels are depicted by dots. Note
that influx is given by ∆C
t
in
= Pred(I
t+∆t
,R ∪ R
d
) −
Pred(I
t
,R) = 4 − 3 = 1, whereas outflux is given by
∆C
t
out
= Pred(I
t
,R)−Pred(I
t+∆t
,R∩R
d
) = 3− 1= 2.
The total unique number of people produced by the
influx count is Pred(I
t
,R) + ∆C
t
in
= 3+ 1 = 4 and the
total outflux count is Pred(I
t+∆t
,R)+∆C
t
out
= 2+2 =
4. As expected, these two numbers are equal, since the
ROI here is a conserving one that neither consumes
nor generates people.
The effect of occlusions is mitigated principally
because of two reasons: (a) unlike object tracking,
our boundary tracker, which computes pixel motion
ANovelFrameworkforComputingUniquePeopleCountfromMonocularVideos
7
◦
Figure 4: Explanation of influx and outflux.
on the ROI boundary for a short period, is hardly af-
fected by occlusions, and (b) machine learner-based
frame count is not much affected by occlusions ei-
ther. Note that even if frame count is affected by oc-
clusions to some extent at a particular time instant,
chances are that in a later instant, the same occlu-
sions will not exist in the scene. As a result, when
we sum up the influx/outflux rates, the effect of oc-
clusions is suppressed. Basically, by avoiding object
tracking and/or track generations for an extended pe-
riod, we bypass occlusions and pass the responsibility
of tackling occlusions to the machine leaner. Our ex-
periments validate this observation.
7 RESULTS AND DISCUSSIONS
For the UCSD dataset, we have chosen a rectangular
ROI R, as shown in the top left panel of Figure 5. For
the FUDAN dataset, our chosen ROI is shown in the
top left panel of Figure 6. The top right panels in Fig-
ures 5 and 6 show the deformed ROI R
d
. We have
chosen to compute influx count for the UCSD dataset
and outflux count for the FUDAN dataset. The bot-
tom left panels in Figures 5 and 6 show respectively
R∪ R
d
and R∩ R
d
. The bottom right panels in Figures
5 and 6 show the foreground/background segmenta-
tions. It is noted that both the datasets have severe
occlusions. Another challenge in the FUDAN dataset
is that it also contains shadows of people.
We compute the influx count on the LHI dataset.
For the LHI dataset, the ROIs are chosen as shown in
Figure 7. Here, the ROI selection is decided based on
the detection region considered in (Cong et al., 2009).
The formula used for calculating accuracy is 100(1-
(| Manual Count - Predicted Count |/Manual Count))
(Cong et al., 2009).
The timestep ∆t is the only tunable parameter
in our framework. On one hand, a large ∆t would
smooth out noisy predictions by the machine learner.
On the other hand, a large ∆t would make the bound-
ary tracking more challenging due to occlusions. The
timestep used for the application of the tracking rou-
Figure 5: Visual Results on the UCSD dataset.
Figure 6: Visual Results on the FUDAN dataset.
Table 2: Accuracy for three different timesteps for the FU-
DAN dataset.
∆t Accuracy
(No. of Frames) ( %)
20 91.35
25 98.46
30 93.22
tine varies for different datasets. These values are
chosen based on our experiments with three different
values on the first 100 frames. The experiments for
the FUDAN dataset are shown in Table II.
UIOC performs well on all the datasets. The re-
sults for the UCSD and the FUDAN dataset including
the accuracies are tabulated in Table III and IV respec-
tively. UIOC also performs well on all 12 videos of
the LHI dataset. The accuracies remain close to 95%
for most datasets. Also, note that all types of camera
angles and video lengths do not seems to decrease the
accuracy as much as observed in Table V.
We demonstrate with experiments that our frame-
work is competent enough to handle occlusions. We
VISIGRAPP2014-DoctoralConsortium
8
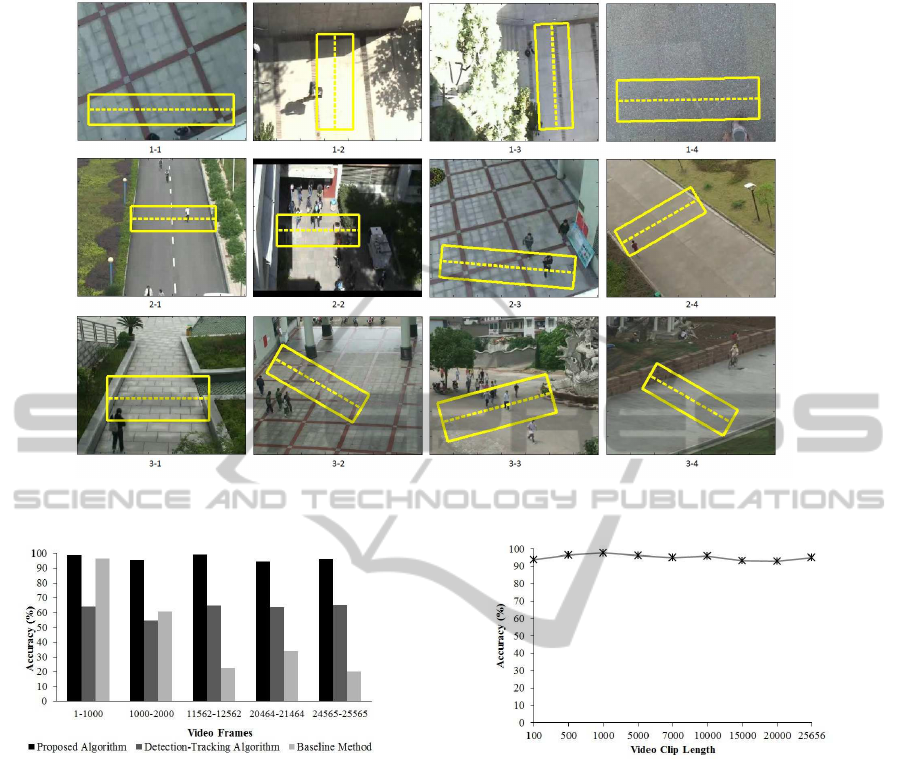
Figure 7: Different videos of the LHI dataset. The dotted lines are the LOIs of (Cong et al., 2009). The rectangles are our
ROIs.
Figure 8: Performance evaluation of three algorithms.
choose 5 mostly occluded video clips each of length
1000 from the UCSD dataset. We produce the exper-
imental count from our framework on these 5 video
clips along with the manual unique count to obtain
the accuracy in Figure 8. In all the cases, the accu-
racy is more than 90% that shows that the framework
performs well on occluded crowds.
We also want to illustrate experimentally that
there is no error accumulation with the increase in
length of video clips. Toward this end, unique peo-
ple count is done on different length of video clips
from the UCSD dataset and a plot of accuracy versus
video clip lengths is shown in Figure 9. It is observed
from the graph that the accuracy remains more or less
flat when the number of frames is increased.
UIOC works as fast as 10 frames per second on a
system with Intel(R), core(TM), DuO CPU, E8400 @
3GHz. The system is implemented in openCV using
the MATLAB implementation of the GP.
Figure 9: Accuracy of the proposed framework with in-
crease of video clip lengths.
Performance of UIOC is compared with the
method proposed by Zeng et al. (Zeng and Ma,
2010), which is a detection-tracking method for peo-
ple counting and also with the Flow-Mosaicking
method (Cong et al., 2009), which is a LOI count-
ing method. UIOC is also compared with a baseline
method. These comparisons are described next.
7.1 Comparison with a Baseline Method
The baseline method we devise here is as follows.
Suppose, we know the average number of frames n
t
for which a person is inside the ROI R on frame t.
Then, a baseline estimate of the unique people count
can be computed between two time points t
1
and t
2
as:
t
2
∑
t=t
1
Pred(I
t
,R)/n
t
, where, as before, Pred(I
t
,R)
predicts the number of people on frame I
t
within the
ANovelFrameworkforComputingUniquePeopleCountfromMonocularVideos
9

ROI R. A few comments are in order here. First, not
all the people are staying within the ROI for the same
number of frames due to varying walking paces, and
different entry and exit points. So, the above formula
would indeed provide a crude estimate of the unique
people count. Second, even estimating the average
number of frames n
t
is a nontrivial task. Instead of
object tracking, we can try to find out the foreground
pixel motion trajectories laid across the ROI. These
trajectories would provide us with the average num-
ber of frames for which a foreground pixel stayed
within the ROI. However, finding these trajectories
is a nontrivial task, mainly because of occlusions. A
practical and quick approximation to n
t
can be ob-
tained by dividing the distance d between a typical
entry and exit point on the ROI border by the average
foreground pixel speed s
t
(obtained by optical flow)
computed on frame t. With these approximations, the
baseline method count turns into the formula: (
t
2
∑
t=t
1
s
t
Pred(I
t
,R))/d.
Furthermore, we treat the distance d as a tunable
parameter here. So, we choose its value by matching
the baseline count with the manual count on a train-
ing set of the first 500 frames. We apply the baseline
method on both the UCSD and FUDAN datset. The
total unique count produced by the method for the
datasets are 1324.19 and 121.77 respectively, while
the manual counts are 1062 and 74. The compari-
son of accuracies of the proposed framework and the
baseline method as demonstrated in Table III and Ta-
ble IV shows that the proposed UIOC outperforms the
baseline method for both the datasets.
The unique people count is also recorded for the
baseline method on the same 5 mostly occluded video
clips from the UCSD dataset of length 1000 used for
UIOC. The result is plotted in Figure 8. Notice that on
the first 1000 frames, the baseline method performed
well, because we have tuned d on the first 500 frames.
The comparison here clearly shows that UIOC out-
performs much more in terms of accuracy, even in the
occluded regions.
7.2 Comparison with a
Detection-tracking Method
In Zeng et al.’s work, each individual person is de-
tected in a frame and then tracked in consecutive
frames until the person leaves the field of view (Zeng
and Ma, 2010). The trajectory generated due to track-
ing represents a single individual. The number of tra-
jectories denote the number of people during a time
interval.
The detection here is a supervised method in
Table 3: Accuracy of three algorithms on the UCSD dataset.
Algorithm Predicted Manual Accuracy
People People (%)
Count Count
UIOC 1118.27 1062 94.70
Zeng et al. 727 1062 68.46
Baseline 1324.19 1062 75.31
Table 4: Accuracy of three algorithms on the FUDAN
dataset.
Algorithm Predicted Manual Accuracy
People People (%)
Count Count
UIOC 75.14 74 98.46
Zeng et al. 21 74 28.38
Baseline 121.77 74 35.45
which Zeng et al. use both Histogram of Gradients
(HOG) (Dalal and Triggs, 2005) and Local Binary
Pattern (LBP) (Ojala et al., 2002) features to detect
the head and shoulders of people to avoid partial oc-
clusion. For tracking, they use a particle filter tracker
(Chateau et al., 2006).
Zeng et al.’s method is also applied on both the
UCSD dataset and the FUDAN dataset. As it is a su-
pervised method, 50% of the total number of frames
is used for training and the remaining 50% for testing.
Though the detection process is tried to be made ro-
bust by taking into account both HOG and LBP fea-
tures, the detection performance was observed to be
somewhat poor on the datasets used here. This hap-
pens mainly because of two reasons. Since the size
of human beings is very small in the UCSD dataset,
the detection process becomes complicated as there
are fewer pixels on a human body to detect it prop-
erly. The second issue is the occlusion that plagues
both detection and tracking.
The performance evaluations of the detection-
tracking algorithm are tabulated in Table III for
the UCSD dataset and Table IV for the FUDAN
dataset showing that UIOC outperformsthe detection-
tracking algorithm for both the datasets.
Unique people count is also recorded for Zeng et
al.’s method on the same 5 mostly occluded video
clips from the UCSD dataset of length 1000 used for
UIOC. The results are plotted in Figure 8. The com-
parison here clearly shows that UIOC outperforms
much more in terms of accuracy, even in the occluded
regions.
VISIGRAPP2014-DoctoralConsortium
10
7.3 Comparison with a LOI Counting
Method
The LOI counting method described in the Flow-
Mosaicking method (Cong et al., 2009) counts the
number of people crossing a specific line of interest
based on flow velocity estimation and temporal image
generation. This method was applied on 12 videos
of the LHI dataset (Cong et al., 2009). The videos
are captured with camera angles of 90, 65 and 40 de-
grees respectively. There are 4 videos corresponding
to each angle and the videos have different views and
different lengths. We have chosen ROIs similar to
those used in the paper (Cong et al., 2009). These
ROIs are shown in Figure 7. We run our UIOC frame-
work on all 12 videos of the LHI dataset and provide
a comparative study of our accuracies versus the ac-
curacies of the Flow-Mosaicking method in Table V.
We observe that the accuracy of our method on all 12
videos exceed those of the LOI counting method. We
attribute the failure of the LOI method here on inaccu-
racies arise due to the analysis of the temporal images.
In contrast, our method does not rely on any temporal
images or their analysis.
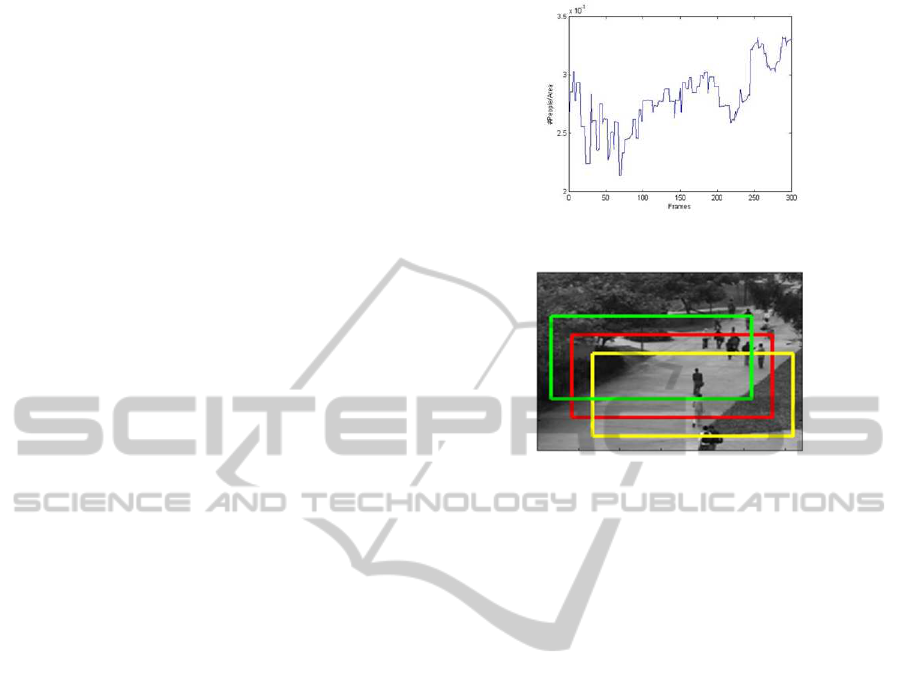
7.4 Work on Multiple ROIs
In order to increase the accuracy of the UIOC frame-
work, we apply it on multiple ROIs, rather than on a
single ROI as shown in Figure 11. Apart from the ROI
in the middle on which we train our machine learner,
we take more ROIs to take different sample regions
from the image. To avoid the increase of computa-
tional cost due to multiple ROIs, we plan to apply the
machine learner only once. In order to incorporate
this idea, initially we calculate the ratio of the num-
ber of people present in a ROI versus foreground area,
denoted by α. The plot of α for the first 300 frames
of the UCSD dataset is shown in Figure 10. The num-
ber of people used for obtaining this ratio is calcu-
lated on the training ROI, ie the ROI on which the
machine learner is trained. By observing the graph in
Figure 10, we note that α does not vary dramatically
within a short period of time. Thus, we can calculate
the influx count for ROIs with the following equation:
∆C
t
in
= α
t+∆t
A
t+∆t
(R∪R
d
) − α
t
A
t
(R)
where,
α
t
= Pred(I
t
,R)/A
t
(R)
α
t+∆t
= Pred(I
t+∆t
,R)/A
t+∆t
(R)
A
t
(R): foreground area of ROI R at time t
R: actual ROI
R
d
: deformed ROI due to boundary tracking
∆C
t
in
: influx at time t.
Figure 10: Plot of α over time.
Figure 11: Multiple ROIs.
Once we get the total influx count for all the indi-
vidual ROIs, we take the average to compute the final
unique count. Number of ROIs is a design parame-
ter here. On the training set, we empirically found
that we obtained maximum accuracy with 3 ROIs.
The experimental unique count achieved is 1078.41,
whereas the manual count was 1062. The accuracy
is 98.45% on the entire UCSD dataset. In compari-
son, the unique count was 94.70% with a single ROI
previously.
8 ADDITION OF
DIRECTIONALITY
In addition to total people count, we also intend to
incorporate directionality in our framework. We test
this idea on the UCSD dataset. In the UCSD dataset,
the people flow goes mainly in two directions: north
and south. In order to count the number of peo-
ple heading north, we need to take into account the
people exiting through the upper boundary i.e., the
directional outflux through the upper boundary, be-
cause the people who are entering the ROI through
the lower boundary are exiting the ROI through the
upper boundary. Similarly, for counting the people
heading south, we need to consider the people exiting
through the lower boundary ie the directional outflux
through the lower boundary.
Figure 12 explains how the directional counting
works. The top left panel of Figure 12 illustrates the
positions of people and the ROI R at time instant t.
ANovelFrameworkforComputingUniquePeopleCountfromMonocularVideos
11

Table 5: Comparative study of the UIOC method and the Flow-Mosaicking method (Cong et al., 2009) on the LHI dataset.
Camera Angle Video name Video Length Total no. of Accuracy (%) Accuracy (%)
(min:sec) pedestrians UIOC method Flow mosaicking method
90
1-1 8:59 256 99.64 97.66
1-2 14:48 247 97.02 94.33
1-3 4:30 23 96.61 95.65
1-4 5:30 180 98.63 93.33
65
2-1 11:29 62 98.27 83.87
2-2 8:24 300 96.21 84.67
2-3 3:45 42 91.26 90.48
2-4 4:40 44 99.72 86.36
40
3-1 7:16 29 97.25 82.76
3-2 25:35 267 94.64 93.26
3-3 13:08 288 99.26 93.75
3-4 10:08 40 93.08 87.50
Figure 12: Addition of directionality.
The top right panel displays the positions of people at
time instant t+∆t as well as the deformed ROI R
d
. R
d
is a result of tracking the boundaries of R between t
and t +∆t. The bottom left panel shows R
d
intersected
with R at the upper boundary, which we need in order
to compute the number of people heading north. The
bottom right panel shows R
d
intersected with R at the
lower boundary which we need in order to compute
the number of people heading south. The number of
people heading north is given by the difference of the
number of people present in the actual ROI and the
number of people present in the deformed ROI, which
is formed from the intersection of R and R
d
at the top
i.e., ∆C
t
N
= 4 − 2 = 2. On the other hand, the number
of people heading south is given by the difference of
the number of people present in the actual ROI and
the number of people present in the deformed ROI,
which is formed by the intersection of R and R
d
at the
bottom i.e., ∆C
t
S
= 3− 2 = 1. Summing ∆C
t
N
and ∆C
t
S
and dividing a specific time interval, we get the total
number people moving north and the total number of
people moving south respectively.
We test the method on the first video of the UCSD
dataset, which has the densest crowd. We manually
count the number of people heading north and south
separately and then run our framework to get the ex-
perimental count. We achieve more than 90% accu-
racy in both cases as tabulated in Table VI.
Table 6: Performance of UIOC for directionality.
Direction Manual Accuracy
People Count (%)
North 183 94.17
South 204 93.23
9 APPLICATION ON MULTIPLE
VIEWS
For extending our framework towards more bench-
mark datasets, we apply it on multiple views of the
PETS 2009 dataset. (S1-L2 view, Time 14-31).
In order to apply the UIOC framework on mul-
tiple views, the first step is to merge multiple views
together in order to choose a ROI. Using a simple
program that uses the OpenCV library, the views
are merged by their overlapping areas to create an
extended view. This is accomplished by manually
choosing corresponding points between the source
images (views two, three and four) and the destination
image (view one) which are the four views presented
in Figure 13. Using these points and OpenCV library
functions, the homography among the views is found
and used to transform views two, three, and four into
the closest match of view one.
Once the three views are transformed, all four
views are superimposed on top of one another for the
actual merging. Figure 14 shows the merged view.
The ROI is then chosen on the merged image. For
each view that is transformed, the coordinates of the
chosen ROI are transformed using the inverse of the
VISIGRAPP2014-DoctoralConsortium
12

transformation matrix that is used to transform the im-
age to match view one. In this way, the newly trans-
formed ROI corresponds roughly to the correct loca-
tion on each original view. Also, any points too close
to the edges or out of bounds have to be moved in.
In the case of the PETS data, as all the views have
significant overlap and there is not much room to lose
people in, the count for each view should theoretically
be almost the same. Therefore, at the end of the pro-
gram, the average count among all four views is taken
as the final estimated people count. The actual count
for the selected ROI is 38, and the estimated count is
38.49 which produces 98.71% accuracy.
We compare our results with an existing multi-
camera person tracking work (Krahnstoever et al.,
2008). According to (Krahnstoever et al., 2008), the
people count accuracy on PETS 2009 S1-L2 dataset
(Time 14-31) is almost 82% whereas our accuracy is
98.71% which we achieve without taking into consid-
eration any homography constraints.
So, the UIOC framework, though initially devel-
oped for monocular videos, is proved to be flexible
enough to perform well even on a network of cameras
capturing multiple human views.
Figure 13: The four different views and the chosen ROIs on
the PETS 2009 S1-L2 dataset.
Figure 14: Merged view of PETS dataset.
10 CONCLUSIONS
We design a novel framework for finding the unique
people count on monocular videos. Our framework
is capable of counting the total number of people in a
specific time interval by overcoming occlusion, which
is one of the most dominant problems in the domain
of computer vision based solutions to people count-
ing. We achieve more than 95% accuracy on numer-
ous publicly available benchmark videos. Our method
outperforms two state of art algorithms and a baseline
method. We even extend our framework to work on
multiple views with highly satisfactory accuracy.
11 EXPECTED OUTCOME
The expected outcome of my research is to produce
a people counting software, the input of which will
be a monocular video and the output will be the to-
tal unique count of people within the video. We ex-
pect to produce more than 90% accuracy in all kinds
of human video. The software is user friendly and
can generate results in real time. Thus it is viable for
commercialization. Once commercialized, the soft-
ware can be used in many real life scenarios like traf-
fic management, surveillance videos and many other
video analytic applications as discussed earlier in this
paper.
ACKNOWLEDGEMENTS
The authors would like to thank Dr. Yang Cong for
the LHI dataset. The authors also acknowledge the
following sources of funding for this work: NSERC,
AQL Management Consulting Inc., and Computing
Science, University of Alberta.
REFERENCES
Barnich, O. and Droogenbroeck, M. V. (2011). Vibe: A
universal background subtraction algorithmfor video se-
quences. Transactions in Image Processing, 20:1709–
1724.
Black, J. and Ellis, T. (2006). Multi camera image tracking.
Image and Vision Computing, 24:1256–1267.
Box, P. C. and Oppenlander, J. C. (2010). Manual of traffic
engineering studies. Technical report, Institute of Trans-
portation Engineers.
Brostow, G. J. and Cipolla, R. (2006). Unsupervised
bayesian detection of independent motion in crowds. In
CVPR, pages 594–601.
Chan, A. B., Liang, Z. S. J., and Vasconcelos, N. (2008).
Privacy preserving crowd montioring: counting people
without people models or tracking. In CVPR, pages 1–7.
Chan, A. B. and Vasconcelos, N. (2009). Bayesian poisson
regression for crowd counting. In ICCV, pages 1–7.
Chan, A. B. and Vasconcelos, N. (2012). Counting people
with low-level features and bayesian regression. In TIP,
volume 21, pages 2160–2177.
ANovelFrameworkforComputingUniquePeopleCountfromMonocularVideos
13

Chateau, T., GayBelille, V., Chausse, F., and Lapreste, J.
(2006). Real-time tracking with classifiers. In ECCV,
pages 218–231.
Cong, Y., Gong, H., Zhu, S., and Tang, Y. (2009). Flow mo-
saicking: Real-time pedestrian counting without scene-
specific learning. In CVPR, volume 1093-1100.
Conte, D., Foggia, P., Percannella, G., Tufano, F., and
Vento, M. (2010). Counting moving people in videos
by salient points detection. In ICPR, pages 1743–1746.
Dalal, N. and Triggs, B. (2005). Histograms of oriented
gradients for human detection. In CVPR, pages 886–893.
Harasse, S., Bonnaud, L., and Desvignes, M. (2005). Peo-
ple counting in transport vehicles. Transactions on Engi-
neering, Computing and Technology, 4:221–224.
Horn, B. and Schunck, B. (1981). Determining optical flow.
Artificial Intelligence, 17:185–203.
Hou, C. P., Zhang, C. S., Wu, Y., and Nie, F. P. (2010).
Multiple view semi-supervised dimensionality reduction.
Pattern Recognition, 43:720–730.
Kim, J., Choi, K., Choi, B., and Ko, S. (2002). Real-
time vision-based people counting system for the secu-
rity door. ITC-CSCC, pages 1418–1421.
Kim, Y. S., Lee, G. G., Yoon, J. Y., Kim, J. J., and Kim,
W. Y. (2008). A method of counting pedestrians in
crowded scenes. In International Conf. on Intelligent
Computing, pages 1117–1126.
Krahnstoever, N., Yu, T., Patwardhan, K. A., and Gao, D.
(2008). Multi-camera person tracking in crowded envi-
ronments. In PETS workshop, pages 1–7.
Lempitsky, V. and Zisserman, A. (2010). Learning to count
objects in images. NIPS.
Ma, Z. and A.B.Chan (2013). Crossing the line: Crowd
counting by integer programming with local features. In
CVPR, pages 2539–2576.
McFarlane, N. J. B. and Schofield, C. P. (1995). Segmen-
tation and tracking of piglets in images. Machine Vision
and Applications, 8:187–193.
Ojala, T., Pietikainen, M., and Maenpaa, T. (2002). Mul-
tiresolution gray scale and rotation invariant texture anal-
ysis with local binary patterns. In PAMI, volume 24,
pages 971–987.
Rabaud, V. and Belongie, S. J. (2006). Counting crowded
moving objects. In CVPR, pages 705–711.
Rasmussen, C. E. and Williams, C. K. I. (2006). Gaus-
sian Processes for Machine Learning. MIT Press, Cam-
bridge, MA.
Smola, A. and Scholkopf, B. (1998). A tutorial on sup-
port vector regression. NeuroCOLT Technical Report
NC-TR-98-030, Royal Holloway College, University of
London, UK.
Stauffer, C. and Grimson, W. (1999). Adaptive background
mixture models for real-time tracking. In CVPR, pages
246–252.
Tan, B., Zhang, J., and Wang, L. (2011). Semi-supervised
elastic net for pedestrian counting. Pattern Recognition,
44:2297–2304.
Zeng, C. and Ma, H. (2010). Robust head-shoulder detec-
tion by pca-based multilevel hog-lbp detector for people
counting. In ICPR, pages 2069–2072.
Zhu, X. J. (2005). Semi-supervised learning literature sur-
vey. Technical Report Technical Report 1530, University
of Wisconsin-Madison.
VISIGRAPP2014-DoctoralConsortium
14
