
Multi-temporal Flow Maps
Looking Back to Look Forward
Alberto Debiasi and Raffaele De Amicis
Fondazione Graphitech, Trento, Italiy
1 STAGE OF THE RESEARCH
A flow map is a thematic map that is been used to
emphasize the spatial pattern of one or more
geographic attributes. Although most flow maps are
still drawn by hand, a few algorithms exist to
automatically generate this kind of thematic maps.
The flow magnitude is represented as the width
of each line, and the sum of all flow line branches
should add up to the width of the flow line (Dent,
1990). Usually the traces depicted by lines do not
correspond to the real route. In many instances the
flow magnitude is not placed over the map, so the
reader must judge relative amounts visually, without
the legend (Dent, 1990).
At present we proposed a novel algorithm for the
automatic generation of flow maps, which is
theoretically grounded on physics’ laws to describe
the motion and force of attraction or repulsion
between points. Properties associated to these laws
are then used to merge different flows, as well as for
the improvement of the maps’ visual quality (see
Figure 1f). Finally, we evaluate our work by
generating a set of flow maps and we make a
comparison with flow maps produced by existing
algorithms.
1.1 Outline of Objectives
The graphical representation of numbers started in
1750 – 1800 with the invention of time-series,
scatter plots, multivariate displays. Geographic maps
were used in the seventeenth century combining
cartographic and statistical elements. (Tufte and
Graves-Morris, 1983). Nowadays with the advent of
calculators some innovations open new possibilities
described in the following section.
1.2 The Use of the 3D
We have the ability to create more information-rich,
and dynamic visualization processes using 3D
(Spence and Press, 2000). Usually when there is the
need to represent spatio-temporal data, the time
dimension is simply associated to the z axis and this
is a limit. A smart use of this dimension can open
big opportunities to novel visualization techniques.
1.3 The Possibility to Interact
Interaction techniques allow the data analyst to
directly interact with the visualizations and
dynamically change the visualizations according to
the exploration objectives. Besides, they also make it
possible to relate and combine multiple independent
visualizations (Spence and Press, 2000). A single
static view can rarely give the whole detailed
information of the data being analysed. With the
appropriate interactive exploration techniques allow
the user to analyse the data in every detail for
example providing support for multiple tasks in a
single visualization tool.
1.4 The Use of Animations
In a visualization, animation might help a viewer
work through the logic behind an idea by showing
the intermediate steps and transitions, or show how
data collected over time changes. Animation can be
a powerful technique when used appropriately, but it
can be very bad when used poorly. Some animations
can enhance the visual appeal of the visualization
being presented, but may make exploration of the
dataset more difficul
t (Steele and Iliinsky, 2010).
The aforementioned aspects can enrich the
capabilities of the flow maps. The possibility to
visualize more than a variable will be studied, in
particular the time dimension is an aspect that lacks
in the flow maps.
Analysis of movement is currently a hot research
topic in visual analytics. Andrienko et al.,
(Andrienko et al., Visual analytics tools for analysis
of movement data, 2007) provided an overview on
the methods and tools studied for the analysis of
movement data. The problem stated in this research
regards the visualization of origin-destination data
such as flow of goods or immigration trends where
40
Debiasi A. and De Amicis R..
Multi-temporal Flow Maps - Looking Back to Look Forward.
Copyright
c
2014 SCITEPRESS (Science and Technology Publications, Lda.)
only the origins and the destinations of the flows and
the flow magnitudes are known, but not the exact
movement routes.
Flow maps represent in a simple and clear way
origin-destination data.
The main objective is to automatically generate
flow maps and represent also multivariate attributes
with temporal dimensions through interaction
techniques, animations and the use of the 3D.
2 RESEARCH PROBLEM
The research problem faced so far is the automatic
generation of flow maps. The main aspect to take
into consideration is the necessity to reduce the
visual clutter while keeping a good visual
appearance. Due to the fact that the flows can be
considered as a rooted acyclic graph the research
problem regards the graph drawing problems. In the
graph drawing domain the emphasis is on finding a
layout, i.e., positions of nodes and edges of a given
graph that satisfies certain aesthetic criteria, e.g., few
edge crossings
device.
In visualization techniques, the usefulness of a
drawing of a graph depends on its readability, that is,
the capability of conveying the meaning of the
diagram quickly and clearly. These issues are
expressed by means of aesthetics, which can be
formulated as optimization goals for the drawing
algorithms. (Battista et al., 1994).
The major challenge is how to bring together the
spatial and temporal dimensions in a way which
makes it possible to explore the relationships
between these two aspects of the data.
In general, not much has been written on the
exploration of temporal changes in origin-
destination data. Marble et al., (1997) noted in 1997
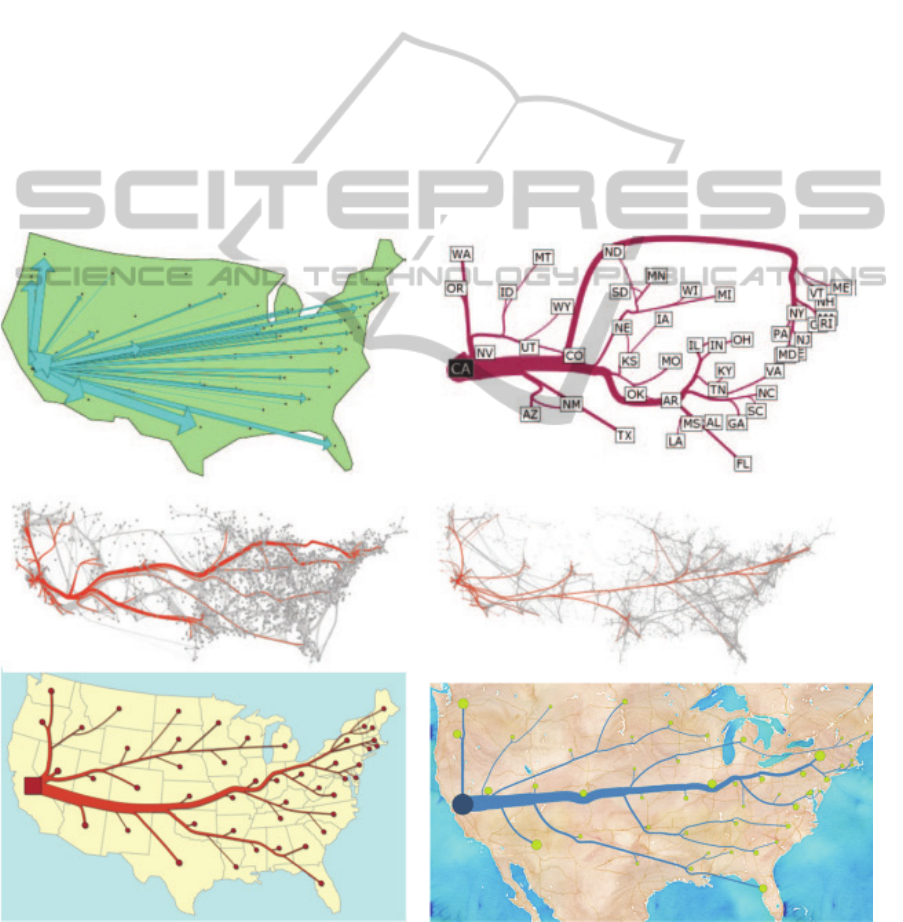
Figure 1: Different maps representing the migration from California in 1995-2000. (a) the first software that automatically
generate flow maps (Tools, 2001), (b) algorithm taking into account aggregation of flows (Phan et al., 2005), (c) (d) the
force directed algorithms in graph drawing domain (Cui et al., 2008), (Holten and Van Wijk, 2009), (e) the algorithm based
on spiral tree (Verbeek et al., 2011), (f) the force directed algorithm described in the stage of the research.
(a)
(b)
(c)
(d)
(e)
(f)
Multi-temporalFlowMaps-LookingBacktoLookForward
41

that the limitations of the data and the empirical
difficulties encountered in their analysis have
restricted researchers to the examination of flows
within a single time period. This situation has not
changed much since then, and there is still a strong
need for techniques capturing the spatio-temporal
aspects simultaneously.
3 STATE OF THE ART
3.1 Automatic Generation of Flow
Maps
This section focuses on a specific domain of the
analysis of the movement that is related to the flow
maps. There are other methods used to represent
origin-destination data, anyway maps are well
familiar to everybody and allow to reason about the
geographic patterns of the movement as no other
representation.
The book “Handbook of Graph Drawing and
Visualization” (Tamassia, 2007) gives an overview
of the actual technique for the automatic generation
of flowmaps. Tobler in 1987 developed a computer
program called FlowMapper (Tools, 2001) used to
visualize migration maps; this mapper produces
generic maps without any optimization with respect
to the visualization of the data. For each flow, it
generates an arrow on the map with a width varying
accordingly to its magnitude. As the number of links
increases, it becomes increasingly difficult to
represent new flows without creating a visual clutter
(see Figure 1a). Tobler not only created the software
for basic flow mapping, but also investigated various
approaches for making flow maps more readable by
addressing their problems.
The main aspect of a flow map is the aggregation
of the flows. In 2005 Phan et al. (Phan, Xiao, Yeh,
& Hanrahan, 2005) introduced a method to reduce
the visual clutter by merging the flows (see Figure
1b). The author used a binary hierarchical clustering
formulating the layout in a simple and recursive
manner. To make the final layout of the flow map
more aesthetically pleasing, the polygonal paths that
represent the edges are drawn as Catmull-Rom
splines, that is, as special cubic curves that go
through the given points. The advantage of this
algorithm is its Ο
time complexity, where is
the total number of nodes used in the algorithm.
However this algorithm has a few limitations: during
the first step the nodes are moved if their proximity
is too small. Hence, it might lose the geographical
reference associated to each node. Furthermore, if
there are too many destination nodes in a small area,
by forcing binary splits introduces too many extra
routing nodes, which then leads to clutter.
Verbeek et al., (2011) describes a method to
overcome the aforementioned limitations through
the use of spiral trees. The authors used spiral spline
(Buchin et al., 2011), which have Ο log
complexity, to generate maps that are crossing-free.
Another key property concerns the weights of the
leaves. If there are two flow maps with the same
origin and destinations but with different
magnitudes, then the layout of the flow map will be
represented differently. Moreover the flow tree
produced is constrained to avoid crossing its own
nodes, as well as user-specified obstacles (see Figure
1e). In order to have a high-quality map, a quality
function that takes into account the obstacles, the
smoothness, the angles and the straightness, has to
be minimized. The time required to perform a flow
map is mentioned in the paper as a “couple of
minutes”. Two limitations of this algorithm are the
complexity in the construction of the tree structure
and the non-intuitive body cost function used to
improve the aesthetic results.
The reduction of visual clutter has been studied
extensively in the graph drawing domain. The
objectives are not the same of the methods described
above but the following works have some points in
common. Cui et al., (2008) use a control mesh that
reflects the underlying control pattern reducing the
visual clutter (see figure Figure 1c). Holten and van
Wijk (2009) presented a force-directed algorithm in
which the edges are modelled as flexible springs that
can attract each other while node positions remain
fixed (see Figure 1d). The input to these methods is
a graph rather than a tree; in the output, the curved
edges are bundled in order to better reflect the
structure of the graph.
The automatic method for the flow map
generators do not permits to visualize multivariate
variables and in particular the time dimension. Some
techniques to use in conjunction with the flow maps
are developed in order to overcome the above
limitations.
The “small multiples” display is one of the most
often used techniques for representing temporal data.
It uses multiple charts laid side-by-side and
corresponding to consecutive time periods or
moments in time (Boyandin et al., Using flow maps
to explore migrations over time, 2010). The problem
with this technique is the scalability: the more small
multiples are represented, the more difficult it is to
see the details. Animation can be used to show how
flows of subsequent time periods change (Becker et
VISIGRAPP2014-DoctoralConsortium
42
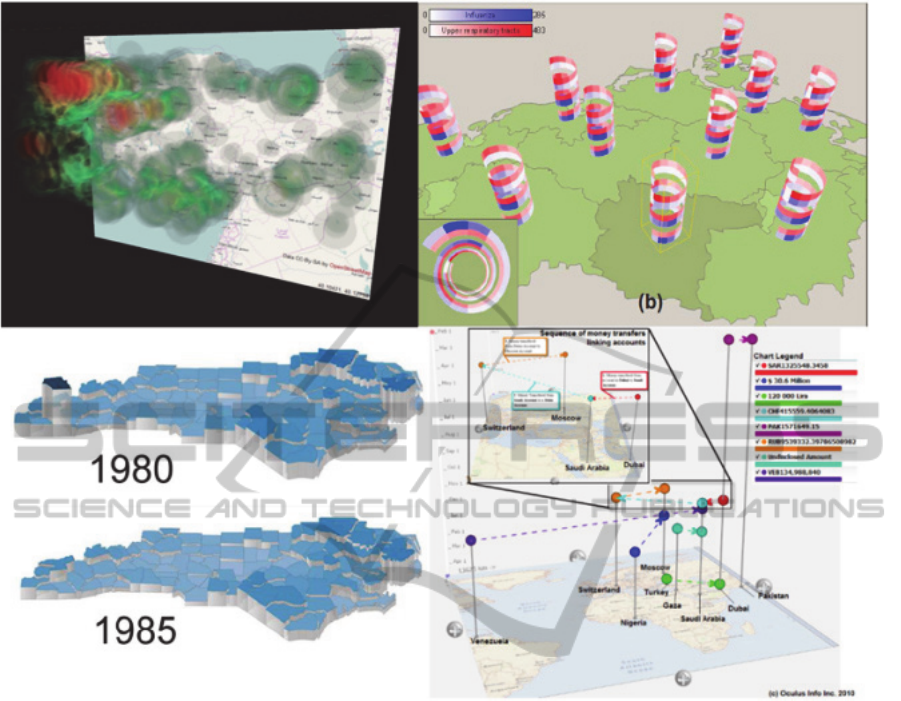
Figure 2: Some examples of multivariate visualizations with the 3rd dimension used to depict time.
al., 1995). An animated flow map showing
thousands of flow lines could hardly be accurately
perceived as it would be too difficult to keep track of
changes in it.
A direct embedding into a flow map would mean
representing the temporal changes by mapping
temporal data to each of the visual features of the
flow lines (color, size etc). A more sophisticated
way of embedding might be able to overcome this
problem though (Boyandin et al., 2011).
3.2 Alternative Techniques for
Origin-destination Data
There are also techniques that are able to represent
also the time dimension such as the “flowstrates”
(Boyandin et al., 2011). It provides means of
interaction for controlling filtering, zooming and
aggregation: the origins and the destinations of the
flows are displayed in two separate maps, and the
changes over time of the flow magnitudes are
represented in a separate heatmap view in the
middle. Mosaic diagrams were introduced in
(Andrienko and Andrienko, Spatio-temporal
aggregation for visual analysis of movements, 2008)
for displaying spatiotemporal patterns in traffic
situations. A set of multiple small calendar-like
views representing temporal data are displayed in a
regular rectangular grid on top of a geographic map.
Distorting map projections are sometimes used to
make geographic maps more readable or to highlight
the most important elements in them. (Stefaner,
2010), (Wood and Dykes, 2008) and (Brunet, 1986)
provided some techniques.
When the 3D representation is included one of
the dimensions is used to show the temporal changes
and the two others for a 2D representation of the
data at each specific moment in time. (Proulx,
Khamisa and Harper), (Adali, Eren, Turk and
Balcisoy); (Tominski et al., 2005) are some example
of this approach.
Multi-temporalFlowMaps-LookingBacktoLookForward
43
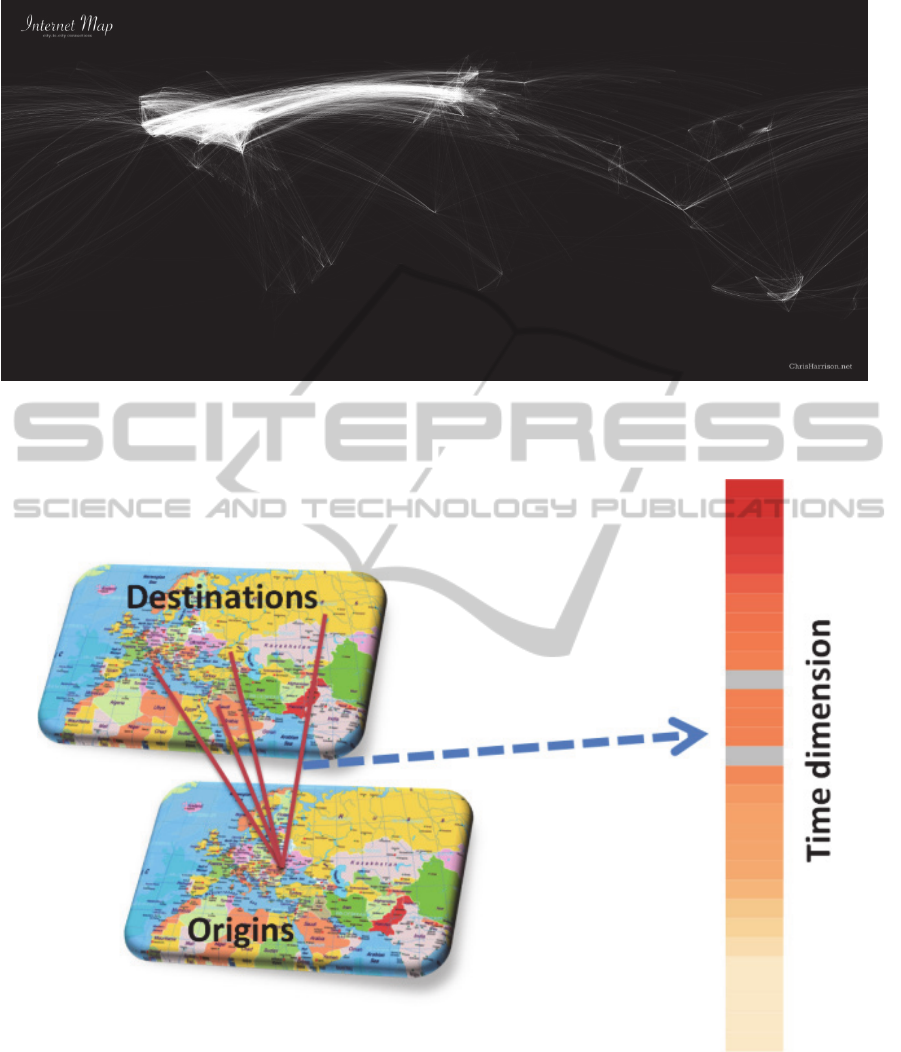
Figure 3: This maps show some kind of connections in a 2D map using arcs in 3D. The main idea is to merge the flows with
the same origin in order to reduce the visual clutter. The concept is the same of aggregation techniques in 2D flow maps but
in a 3D environment.
Figure 4: Sketch of a possible visualization technique. Two 2D maps connected with flows. Each flow line depicts the
temporal pattern.
4 METHODOLOGY
The methodology of this research is divided into the
following steps:
1. Study the available techniques for temporal OD-
data visualization, describing in which way the
animation, the interaction and the 3rd dimension
are used.
VISIGRAPP2014-DoctoralConsortium
44

2. Define which are the tasks the tool can support;
3. Define in which way the interaction metaphor,
the 3D and the animation techniques can be used
in order to represent multivariate attributes with
temporal dimensions.
4. Implement the algorithm on a target platform.
5. Perform a user study to evaluate the proposed
tool. Interview will be done and an analysis on
the user interaction must be performed.
5 EXPECTED OUTCOME
The first results will be a list of novel methods for
the depiction of origin destination data, using the 3
rd
dimension in conjunction with interaction metaphors
and animations. The basic idea is to use the 3
rd
dimension not only as a way to depict the time
dimension.
A first idea can be the definition of an algorithm
for the creation of flow maps with aggregation
techniques but enriched for a 3D environment (see
Figure 3).
Another idea can be the use of 2D maps but in a
3D environment with flows connecting both maps,
one representing the origin and the other
representing the destinations. In this way should be
possible to use flows as temporal indicator (see
Figure 4).
The next outcome will be a developed tool with
the algorithms implemented. This tool will be used
to evaluate the techniques with the users.
REFERENCES
Adali, S., Eren, T., Turk, A., & Balcisoy, S. (n.d.).
HeatCube: Spatio-Temporal Data Visualization with
GPU-Based Ray Tracing Volume Rendering.
Andrienko, G., & Andrienko, N. (2008). Spatio-temporal
aggregation for visual analysis of movements. Visual
Analytics Science and Technology, 2008. VAST'08.
IEEE Symposium on, (pp. 51-58).
Andrienko, G., Andrienko, N., & Wrobel, S. (2007).
Visual analytics tools for analysis of movement data.
ACM SIGKDD Explorations Newsletter, 9(2), 38-46.
Battista, G. D., Eades, P., Tamassia, R., & Tollis, I. G.
(1994). Algorithms for drawing graphs: an annotated
bibliography. Computational Geometry, 4(5), 235-
282.
Becker, R. A., Eick, S. G., & Wilks, A. R. (1995).
Visualizing network data. Visualization and Computer
Graphics, IEEE Transactions on, 1(1), 16-28.
Boyandin, I., Bertini, E., & Lalanne, D. (2010). Using
flow maps to explore migrations over time. Geospatial
Visual Analytics Workshop in conjunction with The
13th AGILE International Conference on Geographic
Information Science, 2.
Boyandin, I., Bertini, E., & Lalanne, D. (2010).
Visualizing the world’s refugee data with JFlowMap.
Boyandin, I., Bertini, E., Bak, P., & Lalanne, D. (2011).
Flowstrates: An Approach for Visual Exploration of
Temporal Origin-Destination Data. Computer
Graphics Forum, 30, pp. 971-980.
Brunet, R. (1986). La carte-mod{\`e}le et les
chor{\`e}mes. Mappemonde, 86(4), 2-6.
Buchin, K., Speckmann, B., & Verbeek, K. (2011). Angle-
restricted steiner arborescences for flow map layout. In
Algorithms and Computation (pp. 250-259). Springer.
Cui, W., Zhou, H., Qu, H., Wong, P. C., & Li, X. (2008).
Geometry-based edge clustering for graph
visualization. Visualization and Computer Graphics,
IEEE Transactions on, 14(6), 1277-1284.
Dent, B. D. (1990). Cartography: Thematic map design.
WC Brown Dubuque, IA.
Frishman, Y., & Tal, A. (2007). Multi-level graph layout
on the GPU. Visualization and Computer Graphics,
IEEE Transactions on, 13(6), 1310-1319.
Herr, B. W., Duhon, R. J., Borner, K., Hardy, E. F., &
Penumarthy, S. (2008). 113 years of physical review:
Using flow maps to show temporal and topical citation
patterns. Information Visualisation, 2008. IV'08. 12th
International Conference, (pp. 421-426).
Holten, D., & Van Wijk, J. J. (2009). Force-Directed Edge
Bundling for Graph Visualization. Computer Graphics
Forum, 28, pp. 983-990.
Marble, D. F., Gou, Z., Liu, L., & Saunders, J. (1997).
Recent advances in the exploratory analysis of
interregional flows in space and time. Innovations in
GIS, 4, 75-88.
Phan, D., Xiao, L., Yeh, R., & Hanrahan, P. (2005). Flow
map layout. Information Visualization, 2005.
INFOVIS 2005. IEEE Symposium on, (pp. 219-224).
Proulx, P., Khamisa, A., & Harper, R. (n.d.). Integrated
Visual Analytics Workflow with GeoTime and
nSpace.
Slocum, T. A., McMaster, R. B., Kessler, F. C., &
Howard, H. H. (2009). Thematic cartography and
geovisualization. Pearson Prentice Hall Upper Saddle
River, NJ.
Spence, R., & Press, A. (2000). Information visualization.
Steele, J., & Iliinsky, N. (2010). Beautiful visualization.
O'Reilly Media, Inc.
Stefaner, M. (2010). Retrieved from Map your moves - A
visual exploration of where New Yorkers moved in the
last decade.:
http://moritz.stefaner.eu/projects/map%20your%20mo
ves/
Tamassia, R. (2007). Handbook of graph drawing and
visualization. Chapman \& Hall/CRC.
Tominski, C., Schulze-Wollgast, P., & Schumann, H.
(2005). 3d information visualization for time
dependent data on maps. Information Visualisation,
2005. Proceedings. Ninth International Conference
on, (pp. 175-181).
Multi-temporalFlowMaps-LookingBacktoLookForward
45

Tools, C.-S. (2001). Tobler’s Flow Mapper. Tobler’s Flow
Mapper.
Tufte, E. R., & Graves-Morris, P. (1983). The visual
display of quantitative information (Vol. 2). Graphics
press Cheshire, CT.
Verbeek, K., Buchin, K., & Speckmann, B. (2011). Flow
map layout via spiral trees. IEEE transactions on
visualization and computer graphics, 17(12), 2536.
Wood, J., & Dykes, J. (2008). Spatially ordered treemaps.
Visualization and Computer Graphics, IEEE
Transactions on, 14(6), 1348-1355.
VISIGRAPP2014-DoctoralConsortium
46
