
A Full Reference Video Quality Measure based on Motion Differences
and Saliency Maps Evaluation
B. Ortiz-Jaramillo, A. Kumcu, L. Platisa and W. Philips
UGent-iMinds-IPI, St-Pietersnieuwstraat 41, Gent, Belgium
Keywords:
Dense Optical Flow, Psychophysics, Saliency Maps, Temporal Distortions, Video Quality Assessment.
Abstract:
While subjective assessment is recognized as the most reliable means of quantifying video quality, objective
assessment has proven to be a desirable alternative. Existing video quality indices achieve reasonable predic-
tion of human quality scores, and are able to well predict quality degradation due to spatial distortions but not
so well those due to temporal distortions.
In this paper, we propose a perception-based quality index in which the novelty is the direct use of motion
information to extract temporal distortions and to model the human visual attention. Temporal distortions are
computed from optical flow and common vector metrics. Results of psychovisual experiments are used for
modeling the human visual attention. Results show that the proposed index is competitive with current quality
indices presented in the state of art. Additionally, the proposed index is much faster than other indices also
including a temporal distortion measure.
1 INTRODUCTION
Video-based applications such as video coding, digi-
tal television, surveillance and tele-medicine, are be-
coming more common in everyday life. Quality con-
trol is important in those applications for increasing
the quality of service, which can be degraded due to
compression, network packet delay, and packet loss,
among others. In this field, video quality assessment
(VQA) has an important role in evaluating and im-
proving the performance of video-based applications.
VQA can be grouped into two main categories: sub-
jective and objective methods. Subjective VQA is
performed by a group of persons, who evaluate (pro-
cessed or corrupted) video sequences according to
certain well-defined criteria such as ITU standards
(ITU-R-Recommendation-BT.500-11, 1998). The re-
sults are typically explained in terms of Differen-
tial Mean Opinion Scores (DMOS). This methodol-
ogy represents the most realistic system of measur-
ing the opinion of humans toward video or image
quality (ITU-R-Recommendation-BT.500-11, 1998),
(VQEG, 2003). However, such tests are complex, ex-
pensive, and time consuming. Hence, objective (au-
tomatic) assessment is a more desirable alternative.
Objective VQA uses computer algorithms for
computing quality scores that should correlate well
with the subjective assessment provided by human
evaluators. In general, those algorithms are classified
into natural visual characteristic methods (NVC) or
perceptual oriented methods (POM) (Chikkerur et al.,
2011). NVC methods use statistical measures (mean,
variance, histograms) and/or visual features (blurring,
blocking, texture, visual impairments) for comput-
ing quality scores, for example the Video Quality
Model (VQM) (Pinson and Wolf, 2004), the motion
compensated structural similarity index (MC-SSIM)
(Moorthy and Bovik, 2010) or video quality assess-
ment by decoupling additive impairments and detail
losses (VQDM) (Li et al., 2011). VQM is computed
by using local spatio-temporal statistics which are ex-
tracted and combined to obtain a quality score. MC-
SSIM uses a popular still image quality metric and
block-based motion compensation for computing er-
rors along motion trajectories. VQDM separates de-
tail losses and additive impairments by subtracting a
restored version of each frame from the reference im-
age. Then, both distortions are pooled and combined
for computing a single quality score.
POM methods have been designed based on re-
sults of physiological and/or psychovisual experi-
ments, e.g., weighted structural similarity index (wS-
SIM) (Wang and Li, 2007), and motion-based video
integrity evaluation index (MOVIE) (Seshadrinathan
and Bovik, 2010). wSSIM uses the structural sim-
ilarity index for measuring local image differences,
714
Ortiz-Jaramillo B., Kumcu A., Platisa L. and Philips W..
A Full Reference Video Quality Measure based on Motion Differences and Saliency Maps Evaluation.
DOI: 10.5220/0004870607140722
In Proceedings of the 9th International Conference on Computer Vision Theory and Applications (PANORAMA-2014), pages 714-722
ISBN: 978-989-758-004-8
Copyright
c
2014 SCITEPRESS (Science and Technology Publications, Lda.)

termed quality maps. For computing a unique qual-
ity score from those quality maps, a spatiotemporal
weighted mean is used. Those weighting factors are
computed based on a Bayesian optimal observer hy-
pothesis. MOVIE uses a Gabor filter bank specif-
ically designed based on physiological findings for
mimicking the visual system response. The video
quality evaluation is carried out from two compo-
nents (spatial and temporal distortions). Spatial dis-
tortions are computed as squared differences between
Gabor coefficients of the reference and processed se-
quences. Temporal distortions are obtained from the
mean square error between reference and processed
sequences along motion trajectories computed over
the reference video. Although many video quality
assessment algorithms have been proposed, many of
them do not explicitly account for temporal artifacts
which occur in video sequences. For instance, in
VQM, MC-SSIM, VQDM and wSSIM, motion infor-
mation is only used to design weights to pool qual-
ity maps into a single quality score for the video.
However, weights based on temporal information do
not necessarily account for temporal distortions (Se-
shadrinathan and Bovik, 2010). Despite of the direct
use of motion in MOVIE, the computational complex-
ity of the algorithm makes practical implementation
difficult as it relies on 3-D optical flow and filter bank
computation (Moorthy and Bovik, 2010).
Since motion is critical for measuring quality,
video quality metrics have to take into account tem-
poral (motion compensation mismatch, jitter, ghost-
ing, and mosquito noise, . ..) and spatial (blocking,
blurring and edge distortion, ...) distortions (Yuen
and Wu, 1998). Considering that the area of still
image quality assessment has attained maturity, spa-
tial distortions are usually well captured by current
quality metrics (image quality metrics achieve cor-
relations above 0.9 between subjective and objective
scores, in most of the databases) (Seshadrinathan and
Bovik, 2010). However, temporal distortions are not
well estimated by existent methods (Seshadrinathan
and Bovik, 2010). In addition, motion information is
only used to compute weights and/or extracted from a
filter bank response in current methods, which is gen-
erally, as stated previously, inaccurate for capturing
temporal distortions (Wang and Li, 2007) (Seshadri-
nathan and Bovik, 2010) (Moorthy and Bovik, 2010).
Considering that most of the existing VQA algorithms
compute motion informationindirectly, it is necessary
to fully investigate the contribution of motion to hu-
man perception of quality. Therefore, we believe that
temporal distortions or errors due to motion should be
computed directly from the local motion field instead
of using the methods listed above.
In this paper, we propose a POM-based quality in-
dex in which the main contribution comes from the
direct use of motion information to extract temporal
distortions and to model the human visual attention
(HVA). On the one hand, since the human visual sys-
tem (HVS) infers motion from the changing pattern
of light in the retinal image (Watson and Ahumada,
1985), we compute motion errors from optical flow
differences because it assumes the same changing pat-
tern of light from one frame to the other. On the
other hand, we performed psychovisual experiments
for modeling directly the HVA instead of using as-
sumptions like in (Wang and Li, 2007). We design
saliency maps based on the results of the psychovi-
sual experiments which are later used in the pooling
strategy. Considering that the proposed quality in-
dex is specifically designed for measuring temporal
distortions, we combine it with the well know spa-
tial structural similarity index (SSIM) in order to ac-
count for both types of distortions. Results show that
the proposed quality index is competitivewith current
methods presented in the state of art. Additionally, the
proposed index is much faster than other indices also
including a temporal distortion measure.
The rest of the paper is organized as follows. Sec-
tion 2 introduces backgroundinformation and Section
3 describes the proposed quality index. Results are in
Section 4 and conclusions in Section 5.
2 BACKGROUND
2.1 Dense Optical Flow
Dense optical flow is one of the most popular mech-
anisms for estimating motion in video analysis with
great accuracy in several tasks such as tracking, video
quality assessment, and human speed perception,
among others (Barron et al., 1992), (Wang and Li,
2007), (Daly, 1998). Optical flow, in video analy-
sis, refers to the changes in grey values caused by
the relative motion between a video camera and the
content of the scene, for example motion of objects,
surfaces, and edges. Mathematically, optical flow as-
sumes that pixel intensities are translated from one
frame to the next (this is called brightness constancy),
i.e., I(x,y,t − 1) = I(x + u,y + v,t), where I(x,y,t)
is the intensity of the pixel located at position (x,y)
and time t. Here, (u,v) is the velocity vector or
optical flow which can depend on x and y. In this
field, the Lucas-Kanade algorithm is one of the most
well-known and widely used optical flow estimation
methods because it accounts for the most desirable
features in optical flow computation (accuracy, low
AFullReferenceVideoQualityMeasurebasedonMotionDifferencesandSaliencyMapsEvaluation
715

computational cost, and good noise tolerance) (Bar-
ron et al., 1992). Therefore, the Lucas-Kanade algo-
rithm is used as optical flow estimator in the proposed
methodology as explained in Section 3.
2.2 Saliency Maps
Spatial regions which attract the HVS are called
salient regions. Usually, humans do not pay atten-
tion to every detail in the visual field but concentrate
on some salient regions (Marat et al., 2009). By com-
bining the salient regions of the visual field, a map
of attentional field called saliency map is obtained.
Particularly, saliency maps are highly related to the
motion and contrast of objects (Wang and Li, 2007).
Usually, salient regions for videos are computed by
using spatial and temporal saliency maps. Both maps
are often inspired by recent results of either physi-
ological or psychovisual experiments (Max-Planck-
institute, 2013), (Marat et al., 2009). In this work,
saliency maps are computed based on local image en-
tropies, motion and the nonlinear mapping of these
features. Here, the nonlinear mapping is designed
based on results of psychovisual experiments. The
psychovisual experiments use alternative force choice
tasks in which one or more stimuli are presented to
several human subjects. In such tasks, human sub-
jects are prompted to indicate whether or not they can
see the stimulus. Thereafter, the behavior of the given
psychovisual task (e.g., proportion of trials the stim-
ulus was seen) is related to some physical character-
istic of the stimulus (e.g., contrast, entropy, motion)
by using a function, termed the psychometric func-
tion. In this work we design an one alternative force
choice (1AFC) task for designing the proposed non-
linear mapping used in the saliency map computation,
see Sections 3.2 and 3.4 for further details.
2.3 Performance of Video Quality
Indices
The performance of video quality indices is evalu-
ated by comparing the predicted quality to the hu-
man scores. The human scores, termed DMOS, are
given by subjective quality assessment of a set of
previously prepared video sequences. The predicted
quality, termed pDMOS, is the output of the objective
quality index after a nonlinear transformation. The
nonlinear transformation is performed with the pur-
pose of facilitating comparisons between models in
a common space of analysis (VQEG, 2003). Such
nonlinear transformation is defined as pDMOS =
b
0
1+exp(−(b
1
+b
2
q))
, where b
0
,.. .,b
2
are constants with
the best fit to the DMOS and q is the output by the
objective video quality index, for instance, the output
of MOVIE algorithm.
Once the nonlinear transformation is applied, the
performance of the objective models is evaluated
by computing various metrics between DMOS and
pDMOS. Such metrics evaluate the following three
aspects: prediction accuracy, prediction monotonic-
ity and prediction consistency (VQEG, 2003). Pre-
diction accuracy refers to the ability of predicting the
subjective quality score with low error, this aspect
is measure by using the Pearson correlation coeffi-
cient (PCC). Prediction monotonicity is the degree to
which predictions of the model agree with the magni-
tudes of subjective quality scores, this aspect is mea-
sure with the Spearman rank-order correlation coef-
ficient (SROCC). Prediction consistency is the de-
gree to which the model maintains prediction accu-
racy over a range of different video test sequences,
this can be measure by using root mean-squared error
(RMSE).
3 PROPOSED QUALITY INDEX
It is well know that temporal distortions in video al-
ter motion trajectories of pixels, for example mo-
tion compensation mismatch, jitter and ghosting,
and/or introduce a false perception of motion such
as mosquito noise (Yuen and Wu, 1998), (Seshadri-
nathan and Bovik, 2010). Noteworthy is that tem-
poral distortions affecting video sequences are per-
ceived by humans as motion. By taking advantage of
the convenient relationship between motion percep-
tion and optical flow (Watson and Ahumada, 1985),
one can assume that there is available a good registra-
tion of motion, i.e., there is translation of pixel inten-
sities from one frame to the next. In such case, given
two video sequences I
r
and I
p
such that I
p
is a pro-
cessed or corrupted version of I
r
, we say that both se-
quences exactly match when optical flows are equal.
That is, U
r
= U
p
and V
r
= V
p
, where U
r
, V
r
and U
p
,
V
p
are the x and y components of the velocity vec-
tors of the reference and processed video sequences,
respectively. However, when temporal distortions ap-
pear in I
p
, optical flows in both video sequences do
not match and the optical flow in I
p
may change.
Thus, a common vector metric can help to measure
optical flow differences for detecting temporal dis-
tortions. Particularly, we use the root squared er-
ror (
p
(U
r
−U
p
)
2
+ (V
r
−V
p
)
2
) because it is the most
common and widely used metric for comparing op-
tical flows (Barron et al., 1992). Thus, our temporal
quality index is developed by assuming optical flow
equality in the absence of temporal distortions. In
VISAPP2014-InternationalConferenceonComputerVisionTheoryandApplications
716

Optical
flow
Computation
Local
entropy
computation
Spatial
pooling
Temporal
pooling
q
t
I
S
I
T
Egomotion
extraction
X
S
(U,V)
I
r
I
p
SSIM
Computation
q
s
(U
r,
V
r
) (U
p,
V
p
)
Q
t
e
s
temporal
quality map
spatial
quality map
Â
I
w
Root
squared error
computation
Q
s
e
t
Nonlinear
mapping
Nonlinear
mapping
Figure 1: Flow chart of the proposed quality indices.
Figure 1 the flow chart of the proposed quality index
is shown.
3.1 Spatial and Temporal Quality Maps
The optical flow for the reference and processed
videos, noted by (U
r
,V
r
) and (U
p
,V
p
) and shown
in Figures 2(c) and 2(d), are computed from the
video sequences I
r
and I
p
, shown in Figures 2(a) and
2(b). For achieving a compromise between simplic-
ity and accuracy, optical flows are computed by using
the pyramidal refined implementation of the Lucas-
Kanade algorithm as discussed in (Lucas and Kanade,
1981). In this paper, optical flows are computed by
using 3 scales and 3 iterations. Thereafter, tempo-
ral distortions are computed pixel by pixel using the
root squared error, which results in a temporal qual-
ity map, termed Q
t
, (see Figure 2(h)). Also, from I
r
and I
p
we compute the spatial quality map (Q
s
) by us-
ing the SSIM as discussed in (Wang et al., 2004). An
example of the spatial quality map is found in Figure
2(i).
3.2 Spatial-temporal Saliency Map
The saliency maps are computed frame by frame
by transforming visual characteristics of the video
sequences with nonlinear functions. The nonlinear
functions are thoroughly explained in Section 3.4. We
compute the saliency maps from the processed se-
quence because the artifacts may change the HVA.
For computing the spatial saliency map we replace
each pixel in the processed frames with the normal-
ized entropy of its surrounding neighborhood, termed
X
S
. The normalized entropy is used assuming that it
is more likely to attract the HVA into regions with
high information content than to regions with low in-
formation content. Then, each normalized entropy is
mapped with a psychometric function to obtaining the
spatial saliency map I
S
= P
S
(X
S
), where P
S
(X
S
) is the
proportion of times that the stimulus is perceivedwith
motion given X
S
(see Section 3.4). We use such non-
linear mapping because it is an indication of the prob-
ability of seen a moving object giving its entropy. An
example of the spatial saliency map is shown in Fig-
ure 2(e).
The temporal saliency map is computed by map-
ping the magnitude of the optical flow with a non-
linear function, i.e., I
T
= P
T
(Mg), where Mg =
2f tan
−1
k(U,V)kdx
2d
(see Section 3.4). Here, dx, d,
f and k(U,V)k are the size in centimeters of each
pixel, distance from the viewer to the display, the
frame rate and the magnitude of the optical flow in
the processed sequence after camera motion extrac-
tion, respectively. Camera motion is extracted with
the purpose of approximating the eye fixation of the
HVA (Wang and Li, 2007). The camera motion or
egomotion (U
g
,V
g
) is estimated from (U
p
,V
p
). Here,
egomotion is estimated by using a six parameters
affine model and lest squares estimation as discussed
in (Yao et al., 2001). The local motion field (U,V)
is obtained as (U,V) = (U
r
,V
r
) − (U
g
,V
g
). This non-
linear mapping is performed with the purpose of ap-
proximating optical flow to the results obtained by
Daly. Figure 2(f) shows an example of the tempo-
ral saliency map. The final proposed spatio-temporal
saliency map is obtained by multiplying pixel by pixel
both maps like in Pinson and Wolf (Pinson and Wolf,
AFullReferenceVideoQualityMeasurebasedonMotionDifferencesandSaliencyMapsEvaluation
717
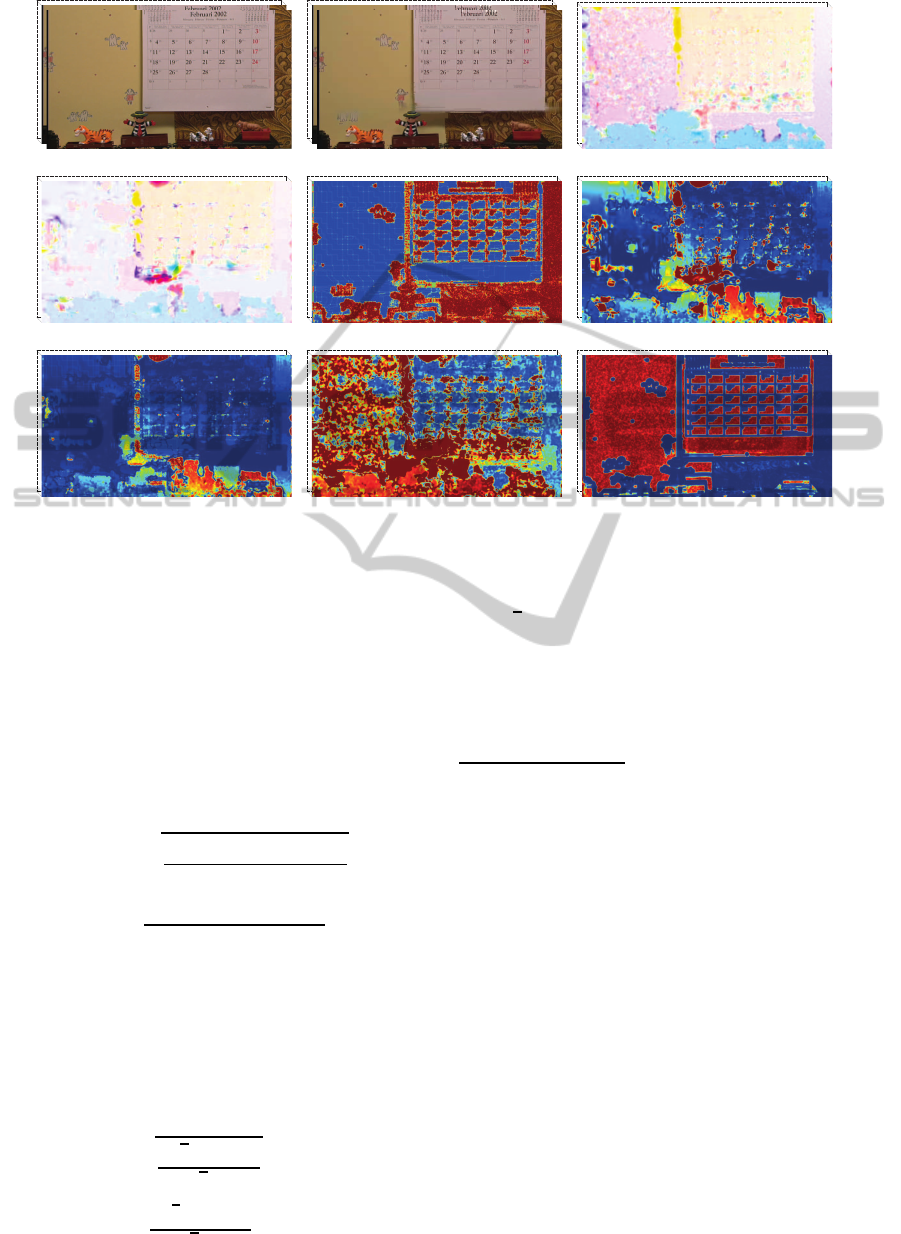
(a) Reference sequence (b) Processed sequence (c) Optical flow of (a)
(d) Optical flow of (b) (e) Spatial saliency map (f) Temporal saliency map
(g) S-T saliency map (h) Root squared error (i) SSIM
Figure 2: Illustrations of the proposed quality metric. S-T: Spatio-temporal. Optical flows of the reference and processed
sequences are color coded (direction is coded by hue, length by saturation). EE, SSIM and saliency maps are color coded
from blue to red.
2004), I
w
= I
S
I
T
, (see Figure 2(g)).
3.3 Pooling Strategy
The proposed pooling strategy is based in the use of
the saliency maps explained in Section 3.2, i.e., we
use weighting functions for obtaining spatial and tem-
poral quality indices. The spatio-temporal saliency
map (I
w
) is used in the pooling strategy as follows:
e
t
(t) =
s
∑
x,y
I
w
(x,y,t)Q
2
t
(x,y,t)
∑
x,y
I
w
(x,y,t)
(1a)
e
s
(t) =
∑
x,y
I
w
(x,y,t)Q
s
(x,y,t)
∑
x,y
I
w
(x,y,t)
, (1b)
where, e
s
(t) and e
t
(t) are the evolution across time of
spatial and temporal distortions, respectively. Finally,
e
t
(t) and e
s
(t) are pooled over time to obtain a spatial
and temporal quality indices describing the quality of
the video sequence I
p
. Here, the temporal pooling is
performed by using a weighted mean of the temporal
evolution of distortions (see Equation (2a) and (2b)).
q
t
=
s
∑
t
I
w
(t)e
2
t
(t)
∑
t
I
w
(t)
(2a)
q
s
=
∑
t
I
w
(t)e
s
(t)
∑
t
I
w
(t)
, (2b)
where
I
w
(t) =
∑
x,y
I
w
(x,y,t). Thus, q
t
and q
s
give
more importance to frames with high salient regions
than frames with low salient regions, i.e., frames with
objects and/or regions that are most likely to be seen.
For combining the spatial and temporal indices, we
use the following nonlinear mapping: pDMOS =
b
0
1+exp(−(b
1
+b
2
q
t
+b
3
q
s
))
. Here, b
0
,.. .,b
3
are also con-
stants with the best fit to the DMOS.
3.4 Psychophysical Experiments for
Nonlinear Transformations
Here, we built the nonlinear transformations by as-
suming that most of the objects are static or nearly to
static. Objects with a significant amount of motion
provide a high information content for the HVA and
therefore an object fixation is obtained. Also, it is well
know that the HVA pays more attention to regions
with high contrast because it is more likely to see
motion at high contrast regions than at low contrast
regions (Hammett and Larsson, 2012). To build the
function P
S
, we ran a 1AFC with two human subjects.
One subject is naive and the other possess knowledge
in the field of VQA. For this, we independently pre-
sented several stimuli to each subject. The subject is
prompted to indicate whether or not they can see mo-
tion in the stimulus. The stimuli are generated by tak-
VISAPP2014-InternationalConferenceonComputerVisionTheoryandApplications
718
0
0.1 0.60.5
0.4
0.30.2 0.7 0.8 0.9 1.0
0.1
0.2
0.3
0.4
0.5
0.6
0.7
0.8
0.9
1.0
x
S
P
S
0
0.1
0.2
0.3
0.4
0.5
0.6
0.7
0.8
0.9
1.0
P
T
20 40 60 80
v
[ deg/sec]
(a) (b)
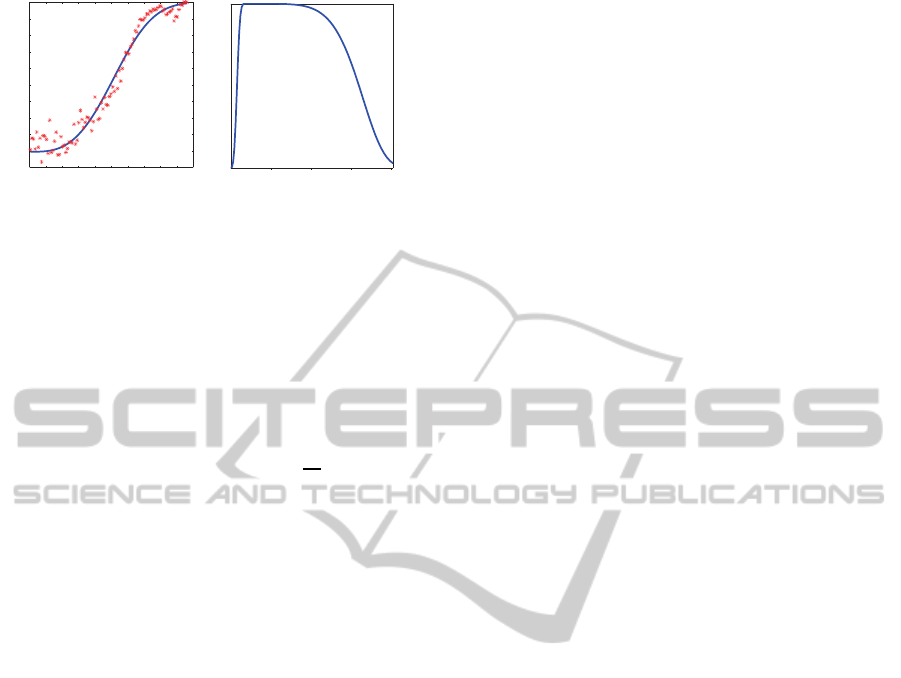
Figure 3: (a) Spatial and (b) temporal mapping functions,
P
S
and P
T
, respectively. Asterisks are the proportion of
times the stimulus is perceived with motion for each nor-
malized entropy X
S
. The blue line is the best fit of the func-
tions.
ing random blocks of 15× 15 pixels per 200 millisec-
ond from the LIVE database (Seshadrinathan et al.,
2010), which is enough for a human subject to dis-
criminate whether or not they can see motion (Wat-
son and Ahumada, 1985). For each block, the nor-
malized entropy is computed as X
S
=
h
B
h
U
, where h
B
is the entropy of the block and h
U
≈ 7.8 bits. The
assumption is that the HVA is attracted more to re-
gions with high information content than to regions
with low information. By using the normalized en-
tropy and the 1AFC collected data a psychometric
function can be estimate. A psychometric function is
typically a sigmoid function, such as the Weibull, lo-
gistic, cumulative Gaussian, or Gumbel distribution.
We choose the Weibull function because is the func-
tion that most easily and accurately fits the obtained
data. Thus, the psychometric function is defined as
P
S
(X
S
) = 1− exp(−(X
S
/α
S
)
β
S
), where α = 0.58 and
β = 3.16 are constants to best fit the obtained data.
Here, we set the parameters using the maximum like-
lihood method as discussed in (Kingdom and Prins,
2010). Figure 3(a) shows the obtained psychometric
function with its respective real data.
To build the temporal saliency map, we use the
results obtained by Daly (Daly, 1998). In that
work the author found that the human eye can-
not follow objects with velocities higher than 80
deg/sec; in such cases the saliency is null. Also,
he demonstrated that the saliency reaches its maxi-
mum with motions values between 6 deg/s and 30
deg/s. We fit a nonlinear mapping function to the
values obtained by Daly. We found that the fol-
lowing function give good results: P
T
(Mg) = (1 −
exp(−(Mg/α
1
)
β
1
))(exp(−(Mg/α
2
)
β
2
)), where α
1
=
3.5, α
2
= 66.5, β
1
= 3.1 and β
2
= 7. The parameters
for P
T
function were empirically determined in order
to fit the findings of Daly. Figure 3(b) shows the ob-
tained function.
4 RESULTS AND DISCUSSION
In this paper two video quality databases are used:
the LIVE Video Quality Database (Seshadrinathan
et al., 2010) and the IVP Subjective Quality Video
Database (Zhang et al., 2011). Each database con-
tains 10 source video sequences, the Live database
contains 10 standard television videos (resolution of
768 × 432) and the IVP contains 10 high definition
videos (resolution of 1920 × 1088). Each of those
video sequences are processed to acquire 150 and 128
test videos in the LIVE and IVP databases, respec-
tively. Each test video is processed by using one of
the following methods: wireless distortion, IP distor-
tions, H.264 compression or MPEG-2 compression.
Each database provides a DMOS value per sequence,
obtained through subjective evaluations conducted by
the respective authors.
Here, the proposed quality index is compared to
the following popular video quality indices: i) Peak
signal to noise ratio (PSNR) as a benchmark, ii) video
quality model (VQM) (Pinson and Wolf, 2004),
iii) weighted structural similarity index (wSSIM)
(Wang and Li, 2007), iv) motion-based video in-
tegrity evaluation index (MOVIE) (Seshadrinathan
and Bovik, 2010) and v) video quality assessment
by decoupling detail losses and additive impairments
(VQAD) (Li et al., 2011). Performances are com-
puted as explained in Section 2.3.
Table 1 shows the performance of the considered
video quality indices appraised for the LIVE and IVP
video quality databases. The results show that the
proposed quality index performs better than PSNR,
VQM and wSSIM and is competitive with MOVIE
and VQAD in both databases. For instance, the pro-
posed quality index performs better than VQAD in
the IVP database and slightly worse in the LIVE
database. Compared with MOVIE the proposed qual-
ity index performs slightly worst in LIVE database,
however, MOVIE is computationally intensive tak-
ing around 6-8 and 20-24 hours in video sequences
of 250-frames 768 × 432 and 1920 × 1088 (which is
impractical for any application), respectively. Then,
results of methods that cannot be obtained within a
practical time span, i.e. 1 hour or more, are not re-
ported in Table 1. The rest of the methods are compu-
tational simpler than the proposed method. However,
those methods do not include a temporal distortion
measure which is crucial in video quality assessment.
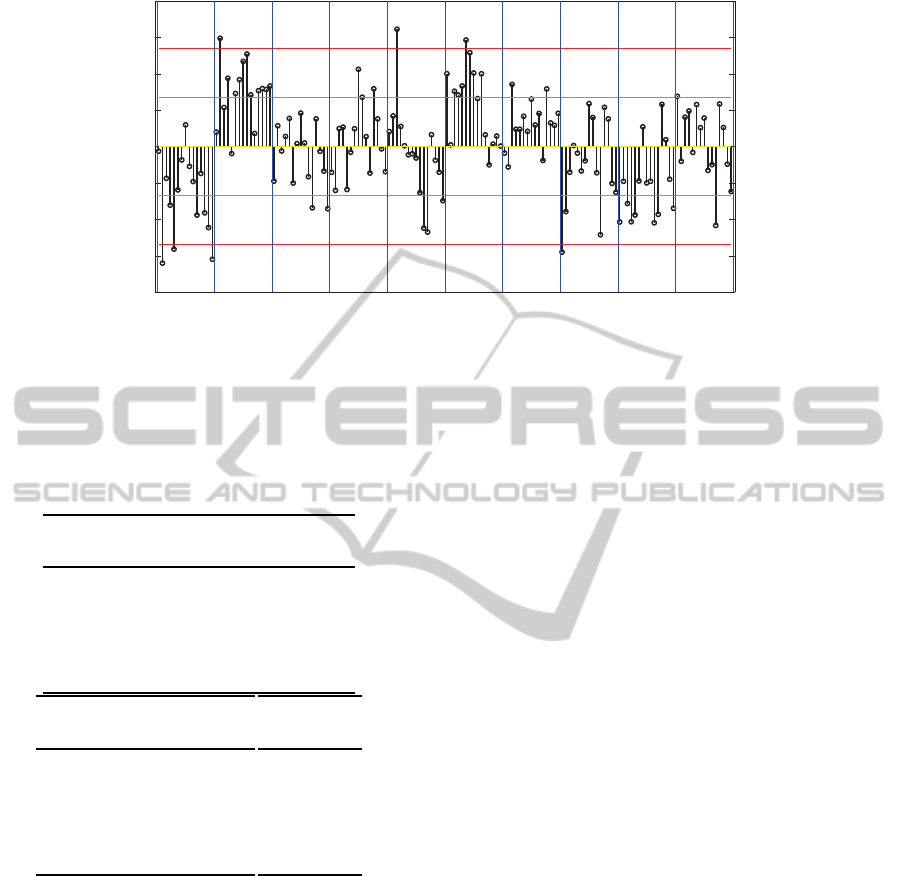
The proposed quality index performs better in one
database than the other. In order to understand the dif-
ference in performance, we study the residuals of the
nonlinear model and the DMOS given in the LIVE
database. Figure 4 shows the residuals of the pro-
AFullReferenceVideoQualityMeasurebasedonMotionDifferencesandSaliencyMapsEvaluation
719
-0.2
-0.1
0
0.1
0.2
DMOS-pDMOS
pa rb rh tr st sf bs sh mc pr
Ö
Û
-Û
2Û
-2Û
Figure 4: Residuals of the proposed quality index in LIVE database. µ and σ are the mean and standard error, respectively.
Video sequences in red means that the proposed quality index achieve the worst performance.
Table 1: Performance of considered video quality metrics
appraised for the LIVE and IVP Video Quality Databases.
∗
The computational time is computed for algorithms run-
ning in Matlab (Laptop with CPU intel core i3 2.27GHz
and 4GB ram) for 250 frames of size 768 × 432.
+
C++
implementation.
LIVE
Method RMSE PCC SROCC
PSNR 9.109 0.562 0.539
VQM 7.932 0.723 0.702
wSSIM 8.843 0.596 0.584
MOVIE
+
6.435 0.811 0.789
VQAD 6.216 0.824 0.818
Proposed 6.723 0.791 0.783
IVP
RMSE PCC SROCC
0.759 0.687 0.694
0.767 0.672 0.685
0.803 0.640 0.640
− − −
0.659 0.782 0.787
0.576 0.839 0.843
Time
∗
[min]
0.15
2.5
37
360
1.2
18
posed quality index for the LIVE database. The plot
was divided in 10 horizontal sections (blue lines)
representing each video in the LIVE database. The
videos are named according to (Seshadrinathan et al.,
2010): river bed (rb), mobile and calendar (mb), rush
hour (rh), blue sky (bs), park running (pr), station
(st), tractor (tr), sunflower (sf), pedestrian area (pa),
shields (sh). In Figure 4, an error is significant or is
considered an outlier when the error is greater than or
equal to ±2σ, where σ is the standard error. The worst
performance was achieved on pa, rb and sf. That is,
most of the residuals are close to the red line in Figure
4. This poor performance is mainly due to three rea-
sons: large occluded regions (pa), large regions with
similar texture or without texture (sf, rb). On the one
hand, pa is a sequence in which a considerable num-
ber of people walk in the street. Some of those people
are located or walk close to the camera, hiding the
other people. Thus, when a person or object is hid-
den or occluded the computed motion from the Lucas-
Kanade algorithm is not reliable. On the other hand,
sf is a sequence in which high similar textured regions
are displaced due to camera motion. Since the motion
detection algorithm is based in local region search-
ing, the optical flow can be unreliable when similar
pixel values are found. The same concept applies
to rb with the difference that this sequence is homo-
geneous. Since the proposed quality index was de-
signed assuming a good motion registration and the
three cases presents unreliable optical flow computa-
tion, the expected root squared error is also unreliable
and this affect the quality index. Then, the inconsis-
tencies in performance are mainly due to the number
of occluded areas and large regions with similar tex-
ture presented in each video sequence. That means,
it is necessary to include a mechanism for measuring
reliability of the optical flow for improving the results
presented in this paper. Despite this drawback the
proposed quality index performs well compared with
current methods in the stated of art. Also, the pro-
posed index have the advantage of computing tempo-
ral distortions directly which can be used for further
improvements in designing objective video quality in-
dices.
5 CONCLUSIONS
We proposed a video quality index based on visual
attention models and optical flow errors which suc-
cessfully captures temporal distortions when a good
quality optical flow registration is available. The vi-
VISAPP2014-InternationalConferenceonComputerVisionTheoryandApplications
720

sual attention model was built using spatial and tem-
poral saliency maps based on psychovisual studies.
The spatial saliency map is based in novel psycho-
visual experiments run by the authors. The temporal
saliency map was built using recent findings in the
area of motion analysis. Temporal errors were com-
puted directly from optical flows by using standard
vector metrics. In general, the proposed quality index
is competitive with current methods presented in the
state of art. Additionally, the proposed index is much
faster than other indices also including a temporal dis-
tortion measure. The main drawback of the proposed
quality index is that it is necessary to assume perfect
motion registration which leads to inconsistencies of
performance within the databases tested in this work.
We prove that this behavior is mostly due to three rea-
sons: large occluded regions, large regions with same
texture and/or without texture. Despite this drawback
the proposed quality index performs well and the re-
sults presented in this work could offer a good starting
point for further development. Also, the proposed in-
dex have the advantage of using temporal information
directly instead of using weights to pool quality maps
which in general do not necessarily account for tem-
poral distortions.
Since the proposed methodology is highly depen-
dent on the quality of the optical flow registration,
the study and incorporation of a proper mechanism
for measuring optical flow reliability is proposed as
future work. Also, the comparison with other meth-
ods and the evaluation of different databases remains
as future work. We proposed a video quality index
based on visual attention models and optical flow er-
rors which successfully captures temporal distortions
when a good quality optical flow registration is avail-
able. The visual attention model was built using spa-
tial and temporal saliency maps based on psychovi-
sual studies. The spatial saliency map is based in
novel psychovisual experiments run by the authors.
The temporal saliency map was built using recent
findings in the area of motion analysis. Temporal er-
rors were computed directly from optical flows by us-
ing standard vector metrics. In general, the proposed
quality index is competitive with current methods pre-
sented in the state of art. Additionally, the proposed
index is much faster than other indices also including
a temporal distortion measure. The main drawback
of the proposed quality index is that it is necessary
to assume perfect motion registration which leads to
inconsistencies of performance within the databases
tested in this work. We prove that this behavior is
mostly due to three reasons: large occluded regions,
large regions with same texture and/or without tex-
ture. Despite this drawback the proposed quality in-
dex performs well and the results presented in this
work could offer a good starting point for further de-
velopment. Also, the proposed index have the advan-
tage of using temporal information directly instead of
using weights to pool quality maps which in general
do not necessarily account for temporal distortions.
Since the proposed methodology is highly depen-
dent on the quality of the optical flow registration, the
study and incorporation of a proper mechanism for
measuring optical flow reliability is proposed as fu-
ture work. Also, the comparison with other methods
and the evaluation of different databases remains as
future work.
ACKNOWLEDGEMENTS
This work was financially supported by the iMinds
ICON Telesurgery project, a project co-funded by
iMinds, a research institute founded by the Flem-
ish Government. Companies and organizations in-
volved in the project are BARCO, Unilabs Teleradi-
ology BVBA, and CandiT-Media BVBA, with project
support of IWT. Part of the work has been performed
in the project PANORAMA, co-funded by grants
from Belgium, Italy, France, the Netherlands, and the
United Kingdom, and the ENIAC Joint Undertaking.
REFERENCES
Barron, J., Fleet, D., Beauchemin, S., and Burkitt, T. A.
(1992). Performance of optical flow techniques. In
IEEE Computer Society Conference on Computer Vi-
sion and Pattern Recognition, pages 236–242.
Chikkerur, S., Sundaram, V., Reisslein, M., and Karam, L.
(2011). Objective video quality assessment methods:
A classification, review, and performance comparison.
IEEE Transactions on broadcasting, 57(2):165–182.
Daly, S. (1998). Engineering observations from spatiove-
locity and spatiotemporal visual models. In Human
Vision and Electronic Imaging III.
Hammett, S. and Larsson, J. (2012). The effect of con-
trast on perceived speed and flicker. Journal of Vision,
12(12):1–8.
ITU-R-Recommendation-BT.500-11 (1998). Methodology
for the subjective assessment of the quality of televi-
sion pictures. ITU, Geneva, Switzerland.
Kingdom, F. and Prins, N. (2010). Psychophysics A practi-
cal introduction. Elsevier, London, 1st edition.
Li, S., Ma, L., and Ngan, K. (2011). Video quality assess-
ment by decoupling additive impairments and detail
losses. In Third International Workshop on Quality of
Multimedia Experience (QoMEX).
AFullReferenceVideoQualityMeasurebasedonMotionDifferencesandSaliencyMapsEvaluation
721

Lucas, B. and Kanade, T. (1981). An iterative image regis-
tration technique with an application to stereo vision.
In Imaging Understanding Workshop.
Marat, S., Phuoc, T., Granjon, L., Guyader, N., Pellerin, D.,
and Gu´erin-Dugu´e (2009). Modelling spatio-temporal
saliency to predict gaze direction for short videos. In-
ternational journal of Computer Vision, 82(3):231–
243.
Max-Planck-institute, M.-P.-i.-f.-b.-c. (2013). Brain re-
search on non-human primates. http://hirnforschung.
kyb.mpg.de/en/homepage.html.
Moorthy, A. and Bovik, A. (2010). Efficient video quality
assessment along temporal trajectories. IEEE trans-
actions on circuits and systems for video technology,
20(3):1653–1658.
Pinson, M. and Wolf, S. (2004). A new standardized method
for objectively measuring video quality. IEEE trans-
actions on broadcasting, 50(3):312–322.
Seshadrinathan, K. and Bovik, A. (2010). Motion tuned
spatio-temporal quality assessment of natural videos.
IEEE transactions on image processing, 19(11):335–
350.
Seshadrinathan, K., Soundararajan, R., Bovik, A., and Cor-
mack, L. (2010). Study of subjective and objective
quality assessment of video. IEEE transactions on im-
age processing, 19(6):1427–1441.
VQEG, V.-Q.-E.-G. (2003). The validation of objec-
tive models of video quality assessment, phase ii.
http://www.its.bldrdoc.gov/vqeg/vqeg-home.aspx.
Wang, Z., Bovik, A., Sheikh, H., and Simoncelli, E. (2004).
Image quality assessment: From error visibility to
structural similarity. IEEE transactions on image pro-
cessing, 13(4):600–612.
Wang, Z. and Li, Q. (2007). Video quality assessment using
a statistical model of human visual speed perception.
Journal of optical society of America, 24(12):B61–
B69.
Watson, A. and Ahumada, A. (1985). Model of human
visual-motion sensing. Journal of optical society of
America, 2(2):322–342.
Yao, P., Evans, G., and Calway, A. (2001). Face tracking
and pose estimation using affine motion parameters.
In Proceedings of the 12th Scandinavian Conference
on Image Analysis.
Yuen, M. and Wu, H. (1998). A survey of hybrid
mc/dpcm/dct video coding distortions. Signal pro-
cessing, 70:247–278.
Zhang, F., Li, S., Ma, L., Wong, Y., and Ngan,
K. (2011). Ivp subjective quality video
database. http://ivp.ee.cuhk.edu.hk/research/
database/subjective/index.shtml.
VISAPP2014-InternationalConferenceonComputerVisionTheoryandApplications
722
