
Typicality Degrees to Measure Relevance of the Physiological Signals
Assessing user’s Affective States
Joseph Onderi Orero
The Faculty of Information Technology, Strathmore University, Nairobi, Kenya
Keywords:
Affective Computing, Physiological Signals, Machine Learning,Prototypes, Typicality Degrees, Gameplay.
Abstract:
Physiological measures have a key advantage as they can provide an insight into human feelings that the
subjects may not even be consciously aware of. However, modeling user affective states through pysiology
still remains with critical questions especially on the relevant physiological measures for real-life emotionally
intelligent applications. In this study, we propose the use of typicality degrees defined according to cognitive
science and psychology principles to measure the relevance of the physiological features in characterizing
user affective states. Thanks to the typicality degrees, we found consistent physiological characteristics for
modeling user affective states.
1 INTRODUCTION
Analysis of physiological data during human-
computer interaction presents one of the most objec-
tive means to assess the user’s psychological states. In
addition to their ability to be measured continuously
in real-time, physiological measures grant an access
to non-conscious and non-reportable processes (Ca-
cioppo et al., 2007). As they are a record of invol-
untary autonomic nervous system processes, physi-
ological data represents information of internal psy-
chological states which is not easy to be captured in
other forms such as facial gesture or voice recognition
through video and audio recording.
In the recent past, scientific works have demon-
strated the enormous prospects in developing sys-
tems equipped with the ability to assess user emo-
tional states through the analysis of physiological
data (Fairclough, 2009; Calvo and D’Mello, 2010;
Novak et al., 2012). However, despite the advances in
this field, there are still major difficulties in uniquely
mapping physiological patterns onto specific affective
states. It tends to vary considerably from one person
to another and may even display considerable differ-
ences within individuals on different occasions (Pi-
card et al., 2001). There is a need to explore more ap-
propriate approaches for design of generic real-time
emotionally intelligent applications. One of the major
challenges is to determine the relevance of the given
physiological features in characterizing the user af-
fective states.
In this study, we propose the use of typicality de-
grees defined according to cognitive science and psy-
chology principles to discover generic physiological
characteristics in relation to user affective states. Typ-
icality degree is computed for each of the training ex-
ample based on its similarity to the examples in the
same class and its dissimilarity with examples belong-
ing to a different class. In our approach, the aim is to
first discover automatically typicality of physiological
features so as to determine their relevance in charac-
terizing the user affective states.
The rest of the paper is organized as follows: in
Section 2, we give the state of the art on modeling
user affective states through physiology. In Section 3,
we give details of an approach to derive generic phys-
iological signals that characterize user affective states
through typicality degrees. Then, in Section 4, we
outline the details of the experimental data used and
analysis of the results in Section 5. Finally, we give
conclusions and future perspectives in Section 6.
2 STATE OF THE ART
2.1 Emotions and Physiology
In cognitive and psychology studies, scientific works
have proved that certain psychological processes and
states are accompanied by changes in physiological
activity (Ekman et al., 1983; Winton et al., 1984;
351
Orero J..
Typicality Degrees to Measure Relevance of the Physiological Signals - Assessing user’s Affective States.
DOI: 10.5220/0004878403510357
In Proceedings of the International Conference on Physiological Computing Systems (OASIS-2014), pages 351-357
ISBN: 978-989-758-006-2
Copyright
c
2014 SCITEPRESS (Science and Technology Publications, Lda.)

Lang, 1995; Bradley et al., 1993; Detenber et al.,
1998). For example, Winton et al.’s study (Win-
ton et al., 1984) showed that pleasant and unpleasant
emotions could be differentiated through heart rate
(HR). Pleasant reaction was found to be followed by
an increase in heart rate while unpleasant images were
characterized by a heart rate deceleration. Similar re-
sults have been shown with Electromyography activ-
ity (EMG) (Cacioppo et al., 1992). Electrodermal
Activity (EDA) is considered to be the most effec-
tive correlate to arousal (Lang, 1995; Bradley et al.,
1993; Detenber et al., 1998). Likewise, respiration
pattern have been shown to discriminate emotional
dimensions related to response requirement; mainly:
calm versus excitement, relaxation versus tenseness,
and active versus passive coping (Boiten et al., 1994;
Boiten, 1998).
In affective computing, experimental studies have
been conducted to propose the use of such inferences
as a way to develop machines that can automati-
cally recognize and respond to these emotions (Picard
et al., 2001; Haag et al., 2004; Wagner et al., 2005;
Rainville et al., 2006; Kim and Andr
´
e, 2008; Bailen-
son et al., 2008; Chanel et al., 2009). A well known
example is Picard et al.’s study (Picard et al., 2001).
Their experimental study was aimed at discriminat-
ing eight emotions (anger, hate, grief, platonic love,
joy, love and no emotion) through physiological mea-
sures recorded on a trained actor who was asked to
express repeatedly these states over several days. In
addition to their impressive results (81% classifica-
tion of the 8 emotions), the most striking revelation of
their experiment was the difficulty associated to the
variability of physiological features. Even with this
single participant, they observed a significant day-to-
day variations. Therefore, there is a need to determine
which physiological signals and features give an opti-
mal results in discriminating between the given affec-
tive states in a real-time set-up.
2.2 Affect Recognition and Feature
Selection
In the domain of physiological computing, there have
been substantial novel models with the goal of dis-
criminating various classes of emotions from physi-
ological measures (Novak et al., 2012). In particu-
lar, such studies have made rigorous efforts to dis-
cover the most discriminant set of features relevant
for such emotionally intelligent systems. The aim is
to discover the optimal feature set for discriminating a
given set of emotions by use of a classification method
with feature selection procedure. For example in Kim
and Andr
´
e’s study (Kim and Andr
´
e, 2008), an exper-
iment was conducted with emotions evoked through
listening to songs in which participants were asked to
listen to music of their own liking corresponding to
the four classes in each of the two dimension emo-
tional axis: anger, joy, sadness and pleasure. Then,
110 features were extracted from the four physiolog-
ical recordings (electromyogram, electrocardiogram,
respiration and skin conductance) and extended linear
discriminant analysis was used as the machine learn-
ing method. Feature selection procedures were em-
ployed to extract the most relevant features for the
four emotions. Similar models have also been ex-
ploited in gameplay psychophysiological studies such
as in (Yannakakis and Hallam, 2008).
However, the optimal set of features tend to dif-
fer depending on the method used. For example, Pi-
card et al.’s study (Picard et al., 2001), depending on
whether Sequential Floating Forward search (SFFS)
or SFFS Followed by Fisher Projection or SFFS Fol-
lowed by Fisher Projection Using the Day Matrix was
followed, the optimal features were different for the
same set of emotions. It also becomes much more
difficult when comparing between different experi-
ments so as to develop generic psychophysiological
user models.
Currently, modeling of emotions from physiolog-
ical signals has mainly relied on classification meth-
ods such as linear discriminant methods, neural net-
works, k-nearest neighbors and decision trees. Al-
though these methods have been proved to be very ef-
ficient in classification, the goal is not only to discrim-
inate affective experiences (recognition) but also dis-
cover meaningful relations between physiology and
affective states (characterization psychophysiological
relations).
Therefore, there is a need for an develop mod-
els that can be used to measure the characterization
power of physiological features in relation to user af-
fective states. In this study, we propose an approach
based on typicality degrees to determine the most rel-
evant physiological signals. Typicality degrees are
computed depending on the similarity between exam-
ples in the same class and dissimilarities with exam-
ples in other classes. The use of typicality degrees has
not been applied in this domain before. Yet, as we
elaborate in the subsequent sections, the use of typi-
cality degrees is a systematic approach to characterize
physiological features.
In our context, the goal is to discover the most typ-
ical physiological patterns that best describe a given
affective state. This can be achieved by considering
several temporal segments during a given affective
state and computing the similarity to the other seg-
ments within that state and the dissimilarity with the
PhyCS2014-InternationalConferenceonPhysiologicalComputingSystems
352

physiological segments during other affective states.
Indeed, as we are dealing with temporal data, it is
natural that the physiological patterns will not be con-
stant over time within a given affective states but we
can extract some consistent patterns across the partic-
ipants. The segment with the highest typicality will
then be taken as the prototype for that state. Thanks
to these prototypes, we can study the cardinal physio-
logical characteristics in relation to the affective states
of interest.
3 TYPICALITY DEGREES BASED
APPROACH
3.1 Typicality and Prototypes from
Cognitive Science Perspective
The concept of typicality and prototypes has been
studied in the field cognitive science and psychology,
initially by Rosch and Mervis (Rosch and Mervis,
1975). According to their study, typicality relies on
the notion that some members of the same category
are more characteristic of the category they belong
to than others. This is contrary to the traditional
thoughts that have treated category membership of
items as possessing a full and equal degree of mem-
bership. Some members are more characteristic (typ-
ical) of the category they belong i.e have features that
can be said to be most descriptive of that category.
Thus, subjects can belong to the same category but
differing in their level of typicality. Typicality degree
of an item depends on two factors (Rosch and Mervis,
1975):
(i) internal resemblance: an object’s resemblance
to the other members of the same category, and
(ii) external dissimilarity: its dissimilarity to the
members of the other categories.
The concept of typicality can be used to define
prototypes for a given group or category as an object
that summarizes the characteristics of the group. In
this case, a prototype of a given category is the object
with the highest typicality in that category i.e closely
resembles the other members of the same class (in-
ternal resemblance) and significantly differs from the
members of the other classes (external dissimilarity).
3.2 Typicality Degrees
The aim is to discover pertinent psychophysiologi-
cal characteristics based on the concept of typical-
ity. Since the typicality degree of an object indicates
the extent to which it resembles the members of the
same group and differs from the members not in the
same group, we can measure its power to character-
ize i.e its ability to summarize the cardinal proper-
ties of a group. Specifically, we consider Rifqi’s for-
malism (Rifqi, 1996) that computes the typicality de-
grees of objects to automatically construct fuzzy pro-
totypes.
Formally, let X be a data set composed of m in-
stances in n dimensional space and labeled to be-
long to a particular state or class, k ∈ C and C =
{1, . . . k, . . . c} where c is the number of all possible
states or classes.
It computes for each example, x ∈ X, belonging to
a given class, k, its internal resemblance, R(x), the ag-
gregate of similarity to the members in the same class
and its external dissimilarity, D(x), the aggregate of
dissimilarity to members not in the same class. The
typicality degree, T (x), of x is then computed as the
aggregate of these two quantities given as:
R(x) =
1
|k|
∑
y∈k
r(x, y) (1)
D(x) =
1
|X\k|
∑
z6∈k
d(x, z) (2)
T (x) = t(R(x), D(x)) (3)
Where r is a similarity measure for computing inter-
nal resemblance, d is a dissimilarity measure for com-
puting external dissimilarity, and t is an aggregation
operator for aggregating resemblance and dissimilar-
ity. y is used to designate examples belonging to the
same class while z designates examples not belonging
to the same class as the given example x.
The choice of similarity measures, dissimilarity
measures and aggregation operators depends on the
nature of the desired properties and have been studied
in detail (Bouchon-Meunier et al., 1996; Detyniecki,
2001; Lesot et al., 2006; Lesot et al., 2008). In this
study, we choose to use the normalized euclidian dis-
tance as dissimilarity measure in Equation 2 and its
complement as a similarity measure in Equation 1.
This ensures that both the internal resemblance and
external dissimilarity on a comparative scale. Then,
to compute typicality degrees, as an aggregation of in-
ternal resemblance and external dissimilarity in Equa-
tion 3, we chose to use the symmetric sum. The sym-
metric sum has a reinforcement property (Detyniecki,
2001). In such a case, if both the similarity and the
dissimilarity are high, the aggregated value becomes
higher than any of the two and if both are low, the
aggregate becomes lower than any of the two values.
This ensures that the aggregation is high only if both
the similarity and the dissimilarity are high and vise
TypicalityDegreestoMeasureRelevanceofthePhysiologicalSignals-Assessinguser'sAffectiveStates
353

versa. Thus, the aggregation is not just a simple mean
which can be misleading when the example has high
similarity but lower dissimilarity and vise versa.
Also, our aim is to extract prototypes that best de-
scribe the cardinal characteristics of a particular class.
In this case, prototypes are defined based on the com-
puted typicality degrees for each example. Prototypes
are taken as the examples with the highest typicality
degree. We consider a prototype formulated by com-
puting typicality degrees attribute by attribute. For
each attribute, A, the typicality degree of each value
of A for each of the objects in the class is computed.
In our context, we exploit this concept of typical-
ity to determine the characterization power of a given
physiological feature from the typicality degree of its
prototypes. As the typicality degree of an example
indicates the extent to which it resembles the mem-
bers of the same group and differs from the members
not in the same group, we can measure an attribute’s
power to characterize. If an attribute typicality degree
is high, then it follows that the attribute is relevant in
characterizing the given state. On the contrary, if the
typicality is low, then the attribute alone, can not be
used as reference for characterizing the given states.
4 DATA
4.1 Experiment
In this study, we use data from two experimental
study in which physiological measures were recorded
on players involved in an action aimed at discover-
ing typical physiological signatures associated with
various gaming experiences (Levillain et al., 2010).
During this experiment, participants played succes-
sively four game sequences. The game session always
started with an introductory sequence (Sequence 1)
corresponding to the very first minutes of the game.
After having played Sequence 1, participants were
asked to complete three other sequences (Sequence 2,
Sequence 3 and Sequence 4), the order of presentation
of these sequences was counterbalanced.
The selected four sequences vary both in terms
of difficulty and in terms of the gameplay they pro-
pose. Sequence 4, which was the most difficult game
sequence. This reflects the fact that participants felt
their skills exceeded in this episode, with a feeling of
frustration as a consequence. On the opposite side,
Sequence 1, which was the introduction of the game,
was the least challenging sequence. In this case, the
lack of challenge is likely to lead to boredom. In be-
tween, Sequence 2 being the favorite of most partici-
pants.
In particular, Sequence 1, Sequence 2 and Se-
quence 4 were distinguished in terms of level of chal-
lenge and user’s affective states we classify the play-
ers’ experiences in relation to appraisal of challenge
in three distinct categories as follows:
i) boredom (due to an insufficient challenge i.e Se-
quence 1),
ii) flow/comfort (due to comfortable level of chal-
lenge i.e Sequence 2) and
iii) frustration (due to very high challenge i.e Se-
quence 4).
4.2 Physiological Measures and Data
Set Construction
Thirty (30) of participants physiological data from the
following signals was used:
i) Electrodermal activity measure (EDA)
ii) Heart Rate (HR)
iii) Respiration Rate (RR)
First, due to the fact that the length of the game
sequences varied from participant to participant and
also to minimize the effect of the transition periods,
only the physiological recordings of the last two min-
utes of each game sequence was used.
Secondly, to account for variations between par-
ticipants, each participant’s signal normalized value,
nS
i
, from the raw value, S
i
, was calculated using the
signal’s standard deviation, S
sdv
, and its mean, S
mean
as shown in Equation 4.
nS
i
=
S
i
− S
mean
S
sdv
(4)
To validate the homogeneity of the physiological
signatures throughout a given affective state session,
these game sequences were subdivided into 10 sec-
onds (2000 data points) segments, with a total of 12
segments for each game sequence. Thus, we have a
total of 1080 samples or segments.
Regarding the extraction of features from the
physiological signals, for each segment, the features
shown in Table 1 were calculated for each of the three
signals. The aim is to determine the most relevant
physiological feature from each of the physiological
signals based on typicality degrees.
5 RESULTS
As discussed before, typicality degrees for each seg-
ment/sample was computed for each signal. Based on
PhyCS2014-InternationalConferenceonPhysiologicalComputingSystems
354
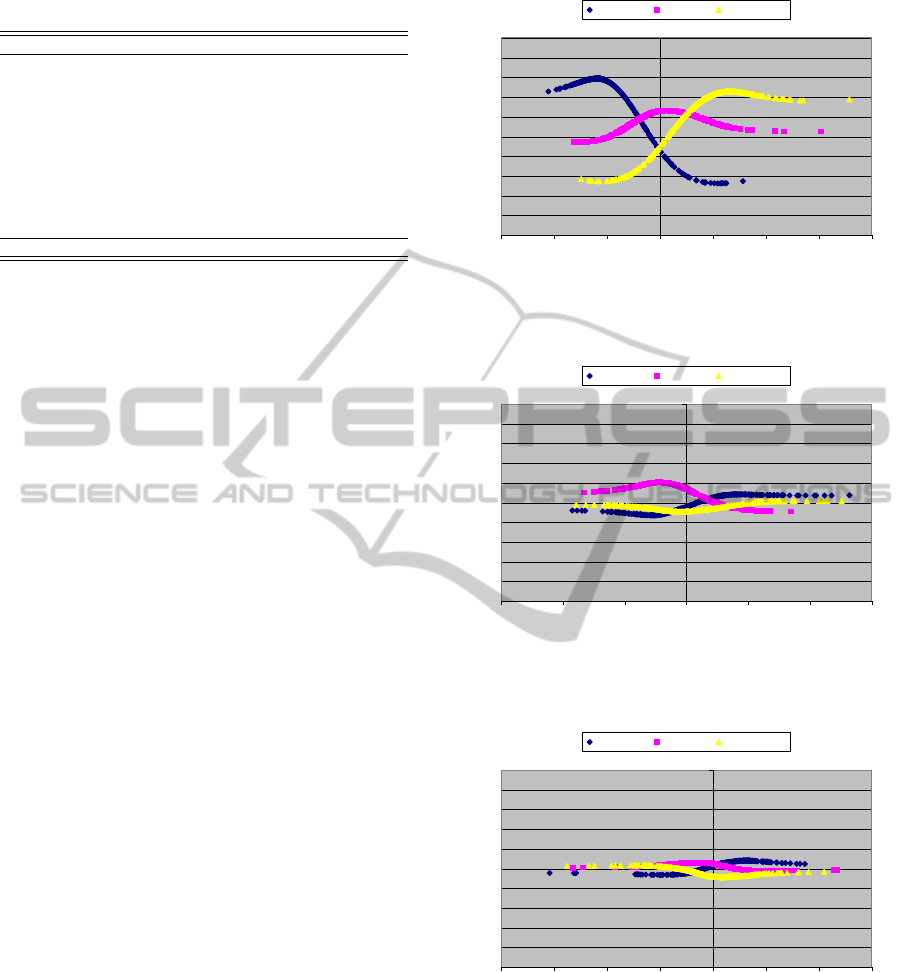
Table 1: Features from physiological measures.
Features Description
µEDA,µHR, µRR mean amplitude
δEDA,δHR, δRR standard deviation
R
1
EDA,
R
1
HR,
R
1
RR mean of absolute first derivative
R
x
EDA,
R
x
HR,
R
x
RR max gradient
Φ
1
EDA,Φ
1
HR, Φ
1
RR PSD 0.0. . . 0.2 frequency range
Φ
2
EDA,Φ
2
HR, Φ
2
RR PSD 0.2. . . 0.4 frequency range
Φ
3
EDA,Φ
3
HR, Φ
3
RR PSD 0.4. . . 0.6 frequency range
Φ
4
EDA,Φ
4
HR, Φ
4
RR PSD 0.6. . . 0.8 frequency range
minEDA,minHR, minRR min signal amplitude
maxEDA,maxHR, maxRR max signal amplitude
Total 30
HR: Heart Rate
EDA: Electrodermal Activity
RR: Respiration Rate
PSD: Power Spectrum Density
the typicality degrees, the three most typical features
from each of the three signals were: µEDA, minHR
and µRR, the average signal amplitude of electroder-
mal activity (EDA), the minimum heart rate (HR)
and average signal amplitude of respiration rate (RR)
respectively. We obtained typicality degree curves
shown in Figure 1, Figure 2 and Figure 3, for µEDA,
minHR and µRR, respectively.
µEDA was the most relevant feature for character-
izing these three states: its typicality degree curves
are clearly distinct for the three states. The boredom
state can be easily characterized by low µEDA (most
typical value of about −1.18 with typicality degree of
0.79). Similar behavior is seen in the case of frus-
tration state. The comfort state is less distinctive (the
most typical value of about 0.11 with typicality de-
gree of 0.63). These results reflect that there were dis-
tinct µEDA patterns for the three states which varied
in challenge level and thus inducing different arousal
levels. Therefore, our typicality results are consistent
with previous works in which EDA has been found to
correlate well with arousal (Lang, 1995).
On the other hand, the ability of HR to charac-
terize the three states was lower than EDA (Figure 2).
We found out that comfort state is better characterized
by HR (most typical value of about −0.43 with typ-
icality degree of 0.60) than boredom and frustration
states (with typicality degrees of 0.54 and 0.51, re-
spectively). Thus, when the participants are in a com-
fort state, the physiological characteristics are typical
across participants, but not for the other states. This
is consistent with the studies that have shown heart
rate to correlate with positive user experiences (Win-
ton et al., 1984).
However, although respiration rate has been pro-
posed as a measure to differentiate calm and excite-
ment (Lang, 1995; Bradley et al., 1993; Detenber
et al., 1998), our results did not show clearly this kind
of preposition. As shown on Figure 3, µRR ’s the char-
0
0.1
0.2
0.3
0.4
0.5
0.6
0.7
0.8
0.9
1
-3 -2 -1 0 1 2 3 4
Electrodermal Activity (Average)
Typicality Degree
Boredom Comfort Frustration
Figure 1: Flow states typical values for average electroder-
mal activity (µEDA).
0
0.1
0.2
0.3
0.4
0.5
0.6
0.7
0.8
0.9
1
-3 -2 -1 0 1 2 3
Heart Rate (min)
Typicality Degree
Boredom Comfort Frustration
Figure 2: Flow states typical values for minimum heart rate
(minHR).
0
0.1
0.2
0.3
0.4
0.5
0.6
0.7
0.8
0.9
1
-4 -3 -2 -1 0 1 2 3
Respiration Rate (Average)
Typicality Degree
Boredom Comfort Frustration
Figure 3: Flow states typical values for average respiration
rate (µRR).
acterization power is low for all the three states i.e:
the prototype typicality degree is less than 0.6 for all
the three states and their curves are almost horizontal.
This may be due to the signal noise associated with
the respiration measure and in this case is not appro-
priate for characterizing these three affective states.
TypicalityDegreestoMeasureRelevanceofthePhysiologicalSignals-Assessinguser'sAffectiveStates
355

6 CONCLUSIONS
In this study, we have tested the use of typicality de-
grees measure the relevance of physiological signals
to model users’ affective states. We considered typ-
icality as per cognitive and psychology principles of
categorization to discover pertinent psychophysiolog-
ical relations. We showed how this framework is a
powerful characterization tool.
Regarding characterization task, we were able to
extract key psychophysiological characteristics for
modeling real-life affective systems. Our experimen-
tal results revealed that Electrodermal activity (EDA)
measure is very powerful in characterizing all the
users’ states. When considering a player’s affective
states, we found that heart rate is less relevant than
EDA, but is critical to distinguish a state of comfort
from a state of frustration. On the contrary, the char-
acterization power of respiration recordings (RR) was
low. Thus, in relation to affective gaming, our results
show that it is possible to gain information from phys-
iological signals considering the optimal state of sat-
isfaction of a player.
However, still much is to be done before getting
access to the structure of the player’s emotional pro-
cesses. In particular, to consider multi-modal fusion
of measures such as audio-visual and various physio-
logical measures.
REFERENCES
Bailenson, J. N., Pontikakis, E. D., Mauss, I. B., Gross, J. J.,
Jabon, M. E., Hutcherson, C. A., Nass, C., and John,
O. (2008). Real-time classification of evoked emo-
tions using facial feature tracking and physiological
responses. International Journal of Human-Computer
Interaction, 6:303–317.
Boiten, F. A. (1998). The effects of emotional behaviour
on components of the respiratory cycle. Biological
Psychology, 49:29–51.
Boiten, F. A., Frijda, N. H., and Wientjes, C. J. (1994).
Emotions and respiratory patterns: review and critical
analysis. International Journal of Psychophysiology,
17:103–128.
Bouchon-Meunier, B., Rifqi, M., and Bothorel, S. (1996).
Towards general measures of comparison of objects.
Fuzzy Sets and Systems, 84:143–153.
Bradley, M., Greenwald, M. K., and Hamm, A. (1993).
Affective picture processing. In Birbaumer, N. and
Ohman, A., editors, The Structure of Emotion, pages
48–65. Hogrefe and Huber Publishers, Toronto.
Cacioppo, J., Bush, L., and Tassinary, L. (1992). Microex-
pressive facial actions as a function of affective stim-
uli: replication and extension. Personality and Social
Psychology Bulletin, 18:515–526.
Cacioppo, J. T., Tassinary, L. G., and Berntson, G. G.
(2007). Psychophysiological science: interdisci-
plinary approaches to classic questions about the
mind. In Cacioppo, J. T., Tassinary, L. G., and
Berntson, G. G., editors, Handbook of psychphysiol-
ogy, pages 1–18. New York: Cambridge University
Press.
Calvo, R. A. and D’Mello, S. (2010). Affect detection: an
interdisciplinary review of models, methods, and their
applications. IEEE Transactions on Affective Comput-
ing, 1:18 – 37.
Chanel, G., Kierkels, J., Soleymani, M., and Pun, T. (2009).
Short-term emotion assessment in a recall paradigm.
International Journal of Human-Computer Studies,
67:607–627.
Detenber, B., Simons, R., and Bennett, G. (1998). Roll’
em! the effects of picture motion on emotional re-
sponses. Journal of Broadcasting and Electronic Me-
dia., 21:112–126.
Detyniecki, M. (2001). Mathematical aggregation opera-
tors and their application to video querying. PhD the-
sis, Universit
´
e Pierre et Marie Curie, France.
Ekman, P., Levenson, R., and Friesen, W. (1983). Auto-
nomic nervous system activity distinguishes among
emotions. Science, 221:1208–1210.
Fairclough, S. (2009). Fundamentals of physiological com-
puting. Interacting With Computers, 21:133–145.
Haag, A., Goronzy, S., Schaich, P., and Williams, J. (2004).
Emotion recognition using bio-sensors: First stepts to-
wards an automatic system. Lecture Notes in Com-
puter Science, Affective Dialogue Systems, 3068:36–
48.
Kim, J. and Andr
´
e, E. (2008). Emotion recognition based on
physiological changes in music listening. IEEE Trans-
actions on Pattern Analysis And Machine Intelligence,
30(12):2067–2083.
Lang, P. (1995). The emotion probe studies of motivation
and attention. American Psychologist, 50(5):372–385.
Lesot, M.-J., Mouillet, L., and Bouchon-Meunier, B.
(2006). Fuzzy prototypes based on typicality degrees.
In Fuzzy Days04, Springer, Advances on Soft Comput-
ing.
Lesot, M.-J., Rifqi, M., and Bouchon-Meunier, B. (2008).
Fuzzy prototypes: from a cognitive view to a ma-
chine learning principle. Fuzzy sets and their exten-
sions: representation, aggregation and models. Stud-
ies in fuzziness and soft computing edition.
Levillain, F., Orero, J. O., Rifqi, M., and Bouchon-Meunier,
B. (2010). Characterizing player’s experience from
physiological signals using fuzzy decision trees. In
IEEE Conference on Computational Intelligence and
Games.
Novak, D., Mihelj, M., and Munih, M. (2012). A survey of
methods for data fusion and system adaptation using
autonomic nervous system responses in physiological
computing. Interacting with Computers, 24:154–172.
Picard, R., Vyzas, E., and Healey, J. (2001). Toward ma-
chine emotional intelligence: Analysis of affective
physiological state. IEEE Transactions Pattern Anal-
ysis and Machine Intelligence, 23:1175–1191.
PhyCS2014-InternationalConferenceonPhysiologicalComputingSystems
356

Rainville, P., Bechara, A., Naqvi, N., and Damasio, A. R.
(2006). Basic emotions are associated with distinct
patterns of cardiorespiratory activity. International
Journal of Psychophysiology, 61:5–18.
Rifqi, M. (1996). Constructing prototypes from large
databases. In International Confrence on Informa-
tion Processing and Management of Uncertainity in
Knowledge-Based System, IPMU.
Rosch, E. and Mervis, C. (1975). Family resemblance:
studies of the internal structure of categories. Cog-
nitive psychology, 7:573–605.
Wagner, J., Kim, J., and Andr
´
e, E. (2005). From physiologi-
cal signals to emotions: implementing and comparing
selected methods for feature extraction and classifica-
tion. In IEEE International Conference in Multimedia
and Expo, pages 940–943.
Winton, W., Putnam, L., and Krauss, R. (1984). Facial and
autonomic manifestations of the dimensional structure
of emotion. Journal of Experimental Social Psychol-
ogy, 20:195–216.
Yannakakis, G. N. and Hallam, J. (2008). Entertain-
ment modeling through physiology in physical play.
International Journal of Human-Computer Studies,
66:741–755.
TypicalityDegreestoMeasureRelevanceofthePhysiologicalSignals-Assessinguser'sAffectiveStates
357
