
Using Visualization and Text Mining to Improve Qualitative Analysis
Elis Montoro Hernandes
1,2
, Emanuel Teodoro
2
, Andre Di Thommazo
1,2
and Sandra Fabbri
1
1
LaPES - Software Engineering Research Lab, Federal University of São Carlos, UFSCar, São Carlos, SP, Brazil
2
IFSP - São Paulo Federal Institute of Education, Science and Technology, São Carlos, SP, Brazil
Keywords: Qualitative Analysis, Coding, Feasibility Study, Visualization, Experimental Software Engineering,
Empirical Software Engineering.
Abstract: Context: Qualitative analysis is a scientific way to deeply understand qualitative data and to aid in its
analysis. However, qualitative analysis is a laborious, time-consuming and subjective process. Aim: The
authors propose the use of visualization and text mining to improve the qualitative analysis process. The
objective of this paper is to explain how the use of visualization can support the Coding in multiple
documents simultaneously, which may allow codes standardization thus making the process more efficient.
Method: The Insight tool is being developed to make the proposal feasible and a feasibility study was
performed to verify if the proposal offers benefits to the process and improves its results. Results: The study
shows that the subjects who applied the proposal got more standardized codes and were more efficient than
the ones who applied the process manually. Conclusions: The results derived from the use of visualization
and text mining, even in a feasibility study, encourage proceeding with the project, which aims to combine
both techniques to obtain more benefits on qualitative analysis conduction.
1 INTRODUCTION
According to Basili, “The only way to discover how
applicable a new method, technique, or tool is in a
given environment is to experiment with its use in
that environment”. (Basili et al., 1996). Considering
it, one of the essential steps of any scientific
research is its evaluation, for obtaining results and
clarifying its contributions and limitations.
The evaluation of a scientific research should
apply a scientific method, adopting procedures for
planning, collecting and analyzing research data. In
general, these procedures are related to the different
kinds of experimental studies as surveys, case study
and controlled experiment (Wohlin et al., 2000).
For the data analysis step both the qualitative and
quantitative analysis can be applied. The major
differences between these methods are the type of
data – usually, text for qualitative analysis and
numbers for quantitative analysis – and the
procedure to draw the study conclusions.
For qualitative analysis, the basic procedure to
analyze data begins with the labelling of relevant
excerpts of the collected data, with the purpose of
identifying the differences and similarities among
them. The labels, called codes, shall facilitate the
identification and interpretation of the relevant
excerpts, called quotations (Hancock, 2002). After
this procedure, called Coding, new or
complementary information about the studied object
can be acquired.
However, as mentioned by Seaman (2008),
"qualitative analysis are sometimes boring, often
tedious, and always more time-consuming than
expected". When the amount of data is large, the
qualitative analysis process can be slower and more
tedious, inducing to relaxation of the label definition
criterion (coding), loss of relevant excerpts for the
study, or definition of different codes for similar
excerpts, which may affect the conclusions on the
data and consequently, the evaluation of the study.
Even though qualitative analysis is a method
usually applied by researchers from the medical and
humanities areas, Seaman (2008) explains that the
use of this method has been intensified in the
software engineering area since the human
behaviour can influence the use of the techniques of
this area.
Seaman (2008) mentions that one of the
advantages of using qualitative analysis methods is
201
Montoro Hernandes E., Teodoro E., Di Thommazo A. and Fabbri S..
Using Visualization and Text Mining to Improve Qualitative Analysis.
DOI: 10.5220/0004880102010208
In Proceedings of the 16th International Conference on Enterprise Information Systems (ICEIS-2014), pages 201-208
ISBN: 978-989-758-028-4
Copyright
c
2014 SCITEPRESS (Science and Technology Publications, Lda.)

that the researcher tends to get deeper into the
complexity of the issues from her/his study and is
not concerned with abstractions of the inquiry.
Moreover, this type of analysis requires more effort
compared to quantitative methods.
Considering the advantages of applying
qualitative analysis in software engineering area and
how difficult it is to apply this method when a study
involves a lot of data, we propose the use of
visualization and text mining techniques to support
the qualitative analysis process. We expect that these
techniques make the process easier, allowing the
documents to be handled simultaneously, providing
more consistent results, ie, quotations, codes and
categories (which organizes the codes) more concise
when compared to results obtained without the use
of such techniques.
The remainder of this paper is organized as
follows: Section 2 briefly presents qualitative
analysis, Section 3 presents the proposal and Section
4 the feasibility study performed to evaluate it.
Finally, Section 5 presents the conclusions and
further works.
2 QUALITATIVE ANALYSIS
According to Strauss and Corbin (2008), the
qualitative research aims to understand a specific
topic by means of descriptions, comparisons and
interpretations of data, unlike to quantitative
research, which uses numbers to understand a topic.
Thus, qualitative research concerns a type of
research in which the results are not achieved
through statistical procedures, since the data is
represented by words, pictures, videos, sounds, and
not just numbers.
Coleman and O'Connor (2007) argue that while
quantitative studies are concerned with questions
like "How much?" and "How often?", qualitative
studies are related to questions like "Why?", "How"
and "In what way?". Somewhat, the authors’
explanation highlighted that the research methods
are complementary and if used together, might
improve the research results.
Thus, this type of analysis can bring relevant
insights for software engineering researchers. For
instance, when two similar techniques are compared,
knowing the reasons why one of them is more
effective than the other may be more important than
just knowing which one is most effective.
Seaman (1999, 2008) presents two sets of
qualitative data analysis methods: Generation of
Theory: methods used for generating hypothesis that
are grounded in the data. For instance, Constant
Comparison Method and Cross-Case Analysis; and
Confirmation of Theory: methods used to construct
the "weight of evidence" that is necessary to confirm
hypothesis. The goal of these methods is not to
prove a theory. For instance, Validation,
Triangulation, Anomalies in the data, Negative case
analysis and Replication.
Though some of these methods could consider
quantitative data analysis, to analyze qualitative data
(usually textual data) the Coding technique is
usually applied.
The Coding technique can be split in three steps
(Seaman, 2008): (i) open coding: the researcher
shall read the text looking for references about the
research interest topic and shall insert labels (codes)
to each relevant excerpt (quotation or quote); (ii)
axial coding: the researcher shall cluster the codes
and excerpts creating categories to better understand
the data, and (iii) selective coding: the researcher
shall reanalyze the codes and categories and
elaborate a description that synthesizes the analyzed
data.
Hancock (2002) describes the Coding technique
as the following set of steps:
1) Read the textual data looking for excerpts
(quotations) with relevant information and write
a short note (code) that represents its topic;
2) Elaborate a list of all different codes;
3) Group the codes into categories that should
represent the main topic related to the codes and
elaborate a list of these categories;
4) If there are interrelated categories, create
another category and define a hierarchy of
categories;
5) Analyze and compare all categories, changing
their position in the hierarchy and creating new
categories if necessary;
6) Repeat steps 1 to 5 to all research documents;
7) Be sure that the excerpts tagged with the same
code are interrelated;
8) Be sure that the categories, their hierarchy and
all labels are representative;
9) Analyze possible relationships among the
categories because they may suggest important
insights about the research. This analysis should
be performed after the certainty that all codes
and excerpts are in the suitable categories;
10) Revise the documents taking the
categories into account and look for excerpts
not considered before but that now seem
relevant.
As these steps suggest, the Coding technique
seems an arduous activity and requires commitment
ICEIS2014-16thInternationalConferenceonEnterpriseInformationSystems
202

and skill of the researcher for analyzing qualitative
data. When the Coding technique must be applied on
a large amount of documents, problems may occur
that can hamper or jeopardize the results:
the process may be susceptible to relaxation of
the coding criterion, because the researcher
may start coding carefully, searching for
implicit details in the text, and after a while he
or she can become less detail-aware. Hence,
relevant excerpts about the research may be
lost in the last documents analyzed;
different codes may be assigned to similar
quotations once the documents may be
analyzed at different moments. In this case the
steps 7 and 8 may require additional effort.
Some software can support the researcher to
conduct this activity, for example, NVivo
(www.qsrinternational.com), Atlas.ti (atlasti.com),
The Ethnograph (www.qualisresearch.com) and
SaturateApp (www.saturateapp.com). Moreover,
some researchers have reported the use of
spreadsheets (Gu, Lago, 2009) and documents or
word processing software (Seaman, 1999).
Regardless of whether these software related to
Insight tool are free or not, they offer many
resources for supporting the Coding technique.
However, they do not provide computational
resources to facilitate the analysis of a set of
documents simultaneously. Although the codes
could be reused in different documents of the same
project, finding excerpts correlated should be done
exclusively by the researcher, a fact which does not
avoid the problems mentioned before.
3 THE CODING SUPPORTED
BY VISUALIZATION
AND TEXT MINING
As mentioned before, the qualitative analysis allows
exploring issues deeply, providing results and
drawing more relevant conclusions for the research
question. Considering the explanation presented in
the last section the proposal here presented intends
to make the qualitative analysis process more
efficient (faster) and effective (better results).
Despite of the fact that qualitative analysis can
also be applied on pictures and videos, the files
frequently investigated are textual documents. As
the codes are inserted in the documents under
analysis, the researcher’s goal is to find patterns,
such that the data is grouped according to them,
aiming to understand and discover new information
in an easier way.
Hence, considering the objective of the
qualitative analysis and our intention of improving
the process, the proposal is based on the use of two
resources: (i) treemap visualization (Johnson,
Shneiderman, 1991) to allow navigating on various
documents at the same time, in order to jointly
handle similar information contained in different
documents; and (ii) text mining techniques to
facilitate the search and identification of patterns in
the documents (Feldman, Sanger, 2007).
We observe that our hypothesis is that processing
many documents at the same time (combining the
use of these techniques) can help to standardize the
attribution of codes as well as make the activity
more efficient.
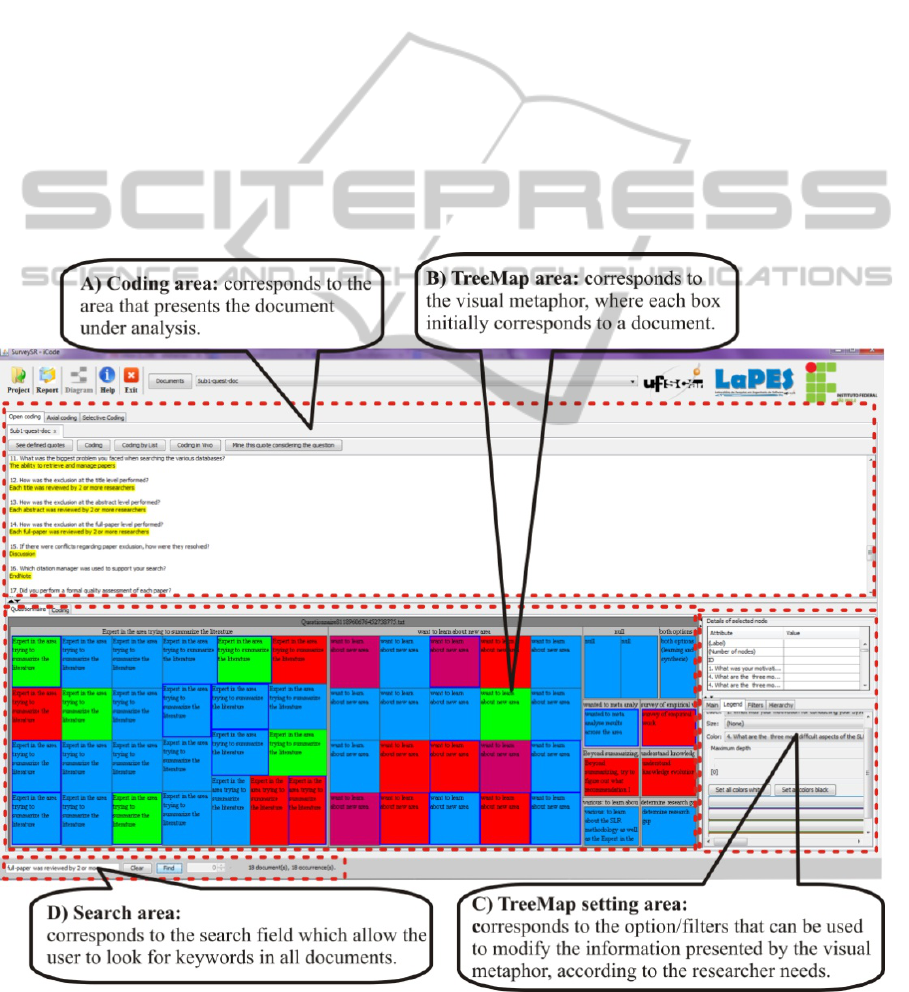
Aiming to implement the proposal, a tool named
Insight tool has been developing. Figure 1 shows the
main screen of the tool where some parts are tagged.
To explain the proposal through the support
available in the tool, let’s suppose that there is a set
of documents containing qualitative data to be
analyzed. After defining the project identification
(name, analysts and description), the documents
should be inserted into de project.
Initially, each box of the treemap visualization
represents a document. On the TreeMap setting area
(Figure1-C), the user can modify the visualization -
colors, labels and hierarchy – adopting a better
hierarchy for the analysis (e.g. based on similar
quotations).
To analyze and coding the documents using the
resources currently available in the tool, the user
must follow the steps:
Identify and select a relevant excerpt, and create
a label to code it. If appropriated, the option
"Apply this code for equal quotations" will be
labelled all the equal excerpts in all documents
with the same code. Also, a code equal to the
selected excerpt is created and stored;
Insert a keyword from the excerpt or the whole
excerpt in the Search area (Figure1-D). If other
documents (boxes) become highlighted (blue
border) in the visualization (Figure1-B), this
means that they also have the searched text;
Clicking on one of the highlighted boxes the
correspondent document will be showed in the
Coding area (Figure1-A) and the matched
keyword or excerpt will be highlighted in the
screen. ;
After reading the excerpt in the context of this
new document, codes previously created can be
reused, promoting their standardization;
UsingVisualizationandTextMiningtoImproveQualitativeAnalysis
203
If more than one document were highlighted, the
user can process all of them at this moment,
aiming to facilitate the interpretation of each
excerpt and, consequently, the attribution of
codes.
It is also possible to analyze and create a code
based on the similarity of excerpts. Selecting the
excerpt and choose the option "Mining this
quotation", a new Treemap is showed and boxes
which represents documents with similar excerpts
will be coloured according to a legend that indicates
their percentage of similarity. To determine the
similarity percentage between the excerpt selected
by the researcher (Insight user) and all the other
documents the Frequency Vector and Cosine
Similarity methods (Salton, Allan, 1994) are used.
Aiming to support the Axial Coding and
Selective Coding (Seaman, 1999), the Insight tool
allows grouping the codes by categories, and
categories into other categories, without restriction
of levels. Moreover, a simple text editor is available
for writing down comments, insights or a theory.
4 FEASIBILITY STUDY
According to the empirical methodology for
introducing software processes, presented by Shull,
Carver and Travassos (2001), we performed a
feasibility study to evaluate our proposal of using
visualization for enhancing the Coding process.
The original Coding process was adapted by the
introduction of visualization, providing facilities for
dealing with various documents at the same time a
document is being analyzed and codes are being
defined. This way of dealing with documents may
standardize the code definition and make the process
more efficient.
In the following subsections the steps of the
study are presented: Subsection 4.1 presents the
Figure 1: Main screen of the Insight tool.
ICEIS2014-16thInternationalConferenceonEnterpriseInformationSystems
204

identification, definition and planning of the study;
Subsection 4.2 comments the study conduction;
Subsection 4.3 presents the data analysis, results and
discussion; and finally, Subsection 4.4 presents the
threats to validity.
4.1 Identification, Definition
and Planning
The study was planned using the GQM template
(Basili, Caldiera, Rombach, 1996), presented by
Table 1.
Table 1: Goal of the feasibility study.
Analyze
the modified process for applying
the Coding technique
for the purpose of
evaluate the feasibility of applying
the process
with respect to
effectiveness (standardization of
codes)and efficiency (time spent) in
applying the Coding technique with
the tool and manually
from the point of
view of
Researchers
in the context of MsC and Ph.D students
The artefacts created to this study were nine:
lecture on Qualitative Analysis and Coding; lecture
on the Treemap technique; lecture on the Insight
tool, subject characterization questionnaire; a set of
newspaper articles about the 2014 World Cup;
feedback questionnaire; report form (for Group C);
consent form and reference model of the Coding
application
It is important mention that the reference model
was elaborated manually by one of the authors and
reviewed by another one, and was used just to
compare the subjects' results. We emphasize that it
was not considered as a correct version, but a
version created by people who know the Coding
technique more deeply than the subjects.
The study design was defined aiming to identify
the effects of applying Coding in a set of documents
according to two different procedures: analyzing
various documents simultaneously using the Insight
tool, and analyzing one document at a time. In the
latter case, there were two possibilities – with and
without the tool.
To select the subjects, a message was sent to an
e-mail list of graduate students. One MsC. and five
Ph.D. students have participated in the study as
volunteers. A characterization questionnaire was
applied aiming to define the groups. Table 2
summarizes the subjects’ profile.
Based on the result of the characterization
questionnaires, the six subjects, labelled as P1, P2,
P3, P4, P5 and P6, were distributed into the 3
groups. Group C is the control group since this
option is the usual way to apply Coding and the
other two groups – A and B – are the treatment
groups since these options are the ones we want to
evaluate. Table 3 presents the study design.
Table 2: Subjects’ characterization.
Question
Wide
knowledge
Little
knowledge
No
knowledge
1) What is your level of
qualitative analysis
knowledge (theoretical)?
P1, P2, P4 P3, P5, P6
2) What is your level of
Coding technique
knowledge?
P5, P6
P1, P2, P3,
P4
3) What is your level of
Treemap visualization
technique knowledge?
P5, P6 P1, P3 P2, P4
4) What is your level of
Treemap tool knowledge?
P5, P1, P3, P6 P2, P4
Table 3: Study design.
Group Group A Group B Group C
Subjects ID (P1 & P2) (P3 & P4) (P5 & P6).
Way to
conduct the
Coding
activity
(Insight tool
+ simultaneous
analysis);
(Insight tool
+ one
document at a
time)
(manually +
one document
at a time)
4.2 Conduction
The study was carried out in two days. In the first
day, an instructor (one of the authors) explained the
purpose of the feasibility study, and got the subjects’
agreement in the Consent Form. The subjects also
have answered the characterization form. Moreover,
the subjects of Groups A and B received training
about the Insight tool and the Treemap technique to
understand how the tool works and how
visualization should be used for applying the
modified process.
During the second day the Coding technique was
applied by the three groups. The document set was
composed of newspaper articles about the 2014
World Cup and the objective was to identify any
topic highlighted in the articles. The subjects
performed the activity in the same place and no
communication was allowed among them.
4.3 Data Analysis, Results
and Discussion
Aiming to verify if it is feasible to apply the Coding
process dealing with many documents at the same
time, the collected data was analyzed based on the
UsingVisualizationandTextMiningtoImproveQualitativeAnalysis
205

meaning of codes, the number of categories, codes
and quotations, the time spent by treatment groups
and finally, the qualitative analysis of the subjects'
feedback questionnaire.
Moreover, a rate of number of quotations divided
by number of codes was measured aiming to observe
the consistency of defined codes. In other words,
this rate means how much the codes were reused to
label similar excerpts.
4.3.1 Analysis of the Subjects’ Results
Considering that in the context of qualitative analysis
it is not viable to argue that some result is wrong or
better than another one, we analyzed the results of this
study mainly from the semantic point of view.
The steps applied for analyzing the results were:
i) tabulating the codes of subjects and the reference
model; ii) based on the meaning, the codes of each
subject were compared to the codes of the reference
model to identify the ones that were interrelated and,
iii) the coincidental codes were identified. Table 4
summarizes the results, showing the number of
agreements and disagreements between each subject
result and the reference model. Complementary data
is presented in Table 5.
We highlight that every code defined in the
reference version was also defined by at least one
subject. Besides, five from the six subjects have
more than 50% of codes semantically similar to the
codes of the reference model. This suggests that the
subjects understood the objective of the activity as
well as the Coding technique.
In relation to the effectiveness, i.e., the
standardization of codes, Group A presents the most
standardized results, once the number of codes
defined by its subjects (19 and 15) were the smallest
ones, and the rate (#quotations/#codes) of subjects
was similar (see Table 5). This information gives
insights that analyzing the set of documents
simultaneously, may facilitate the reuse of codes
created by the user as the coding technique is
executed.
The subjects of Group B presented the most
different results in semantically (Table 4) and
numbers (Table 5), when compared to each other. P3
created many codes but a number of categories
similar to the others, except for P4 who created few
categories. The subjects of Group C presented codes
and categories similar in numbers, but a little
different in meaning. Observe that this group
defined few codes. Probably this occurs due to the
fact that conducting Coding manually is a boring
and laborious activity.
The number of codes is not a crucial data to
qualitative analysis, unless the coding is being
performed to transform qualitative data into
quantitative data. However, comparing the codes
defined by the subjects P5 and P6 with the codes of
the reference model, we can observe that relevant
information was not identified by them. This fact
may jeopardize the final summary of the analysis.
The time spent by the Group C was higher than
the time spent by the Groups A and B. This result
was expected and corroborated the known
information that applying the Coding technique
manually is a laborious task.
Table 4: Summary of subjects' results.
Reference
model
(22 codes)
Group A Group B Group C
P1 P2 P3 P4 P5 P6
# and % of
agreements
13
59%
15
68%
12
54%
8
36%
13
59%
11
50%
# of
disagreements
6 0 12 12 7 6
Table 5: Number of categories, codes and quotations and
time spent by each subject.
Group
#
Categories
#
Codes
#
Quotations
Quot./Code
s
Time
spent
GroupA -
P1
8 19 40 2,1 0:40h
GroupA -
P2
6 15 34 2,2 0:52h
GroupB -
P3
7 24 80 3,3 1:16h
GroupB -
P4
3 20 32 1,6 1:00h
GroupC -
P5
6 20 24 1,2 1:30h
GroupC -
P6
7 17 21 1,2 1:56h
Comparing the lowest and highest spent time by
each subject, it can be noticed that Group A was
about 55% more efficient than Group C and Group
B was about 33% more efficient than Group C:
Group A x C: (i) highest time - P2 was 55.56% more
efficient than P6; (ii) lowest time - P1 was 55.18%
more efficient than P5; Group B x C: (i) highest time
- P3 was 34.49% more efficient than P6; (ii) lowest
time – P4 was 33.34% more efficient than P5.
In summary, the time spent in conjunction to the
result presented in the previous section shows that
analyzing various documents as the codes are being
defined is a promising approach that deserves the
continuity of our research.
4.3.2 Analysis of the Feedback
Questionnaires
After the Coding application each subject answered
a short feedback questionnaire, according to the
ICEIS2014-16thInternationalConferenceonEnterpriseInformationSystems
206

participation group.
Question 1 was related to the use of the Treemap
technique and according to the subjects, the use of it
is useful to: (i) quickly identify the results of a
search aiming to manage various documents
simultaneously; (ii) help in the Coding application,
aiming to visualize and reuse the codes that were
previously created. These benefits mentioned by the
subjects are in accordance with the intention of the
authors’ proposal.
Question 2 was related to the search
functionality that combined with visualization helps
the simultaneous analysis of documents. According
to the subjects, this functionality was used all the
time and helped to locate the excerpts in the
documents and reuse the codes, promoting their
standardization. Question 3 was related to the
simultaneous analysis of documents. According to
the subjects, the possibility to deal with various
documents simultaneously also helps the reading of
documents and the standardization of codes.
Question 4 was related to text mining
functionality. According to the subjects, this
functionality was used when a long quotation was
identified and the participant wanted to check if
there were any excerpt of similar text in which the
same code could be applied.
Question 5 was related to the difficulties faced
by the subjects who conducted the analysis
manually. These subjects reported that the manual
application of the Coding technique leads to the
analysis of one document at a time, since dealing
with all documents at the same time is hard. The
main difficulties mentioned were the definition of
different codes for the same topic and the difficulty
to define the categories. Moreover, the
functionalities requested by the subjects were to
comb through relevant information in the
documents, to prevent the definition of different
codes for similar excerpt, and to aid the analysis of
more than one document at the same time.
In summary, the analysis of the feedback
questionnaire showed functionalities that should be
inserted into the Insight project and that the search
functionality combined with visualization provides
evidences that the proposal is feasible and the
project should be continued.
4.4 Threats to Validity
Threats to validity are inherent to experimental
studies, despite the experimental design. Then,
according to (Jedlitschka, Ciolkowski, Pfahl, 2008),
every study report should expose its threats.
In relation to the study presented in this paper,
the authors could identify the following threats to
internal, external and conclusion validity.
The topic to be analyzed can represent a threat to
Internal Validity because the subjects may have
different knowledge on it. Hence, to minimize it, the
authors have chosen a set of documents about a
generic topic - the 2014 World Cup. Although the
newspaper articles do not represent a research
domain, it was the way found to guarantee the same
level of domain knowledge of the subjects.
We understand that the results can be different in
a different sample of subjects. The subjects of this
study were graduate students and most of them have
little knowledge about Qualitative Analysis and
Treemap technique, which is considered an threat to
External Validity. However, considering the
positive results even in this non-experienced group,
we understand that the proposal can be considered as
a benefit for this activity.
One of the challenges of this study was analyzing
the coding results of each subject and characterizing
the effectiveness of the proposal. For minimizing the
risks related to the wrong application of the Coding,
the authors have used for comparison a reference
model, even though this comparison may be
considered a threat to Conclusion Validity, since
the comparison itself, as well as the reference
version, are both subjective.
5 CONCLUSIONS
Qualitative analysis is relevant to software
engineering considering that this area is a blend of
technical and non-technical issues (Seaman, 2008) -
the success of a process depends on the process and
on who perform the process as well.
Despite the advantages that this kind of analysis
can offer to researchers, its application is laborious,
time consuming, error prone, and requires ability to
be conducted correctly. These characteristics are
emphasized when there is a large volume of data
distributed in many documents. In addition, for
conducting qualitative analysis, the main used
technique is Coding, which, in general, is applied on
a document at a time. This procedure makes the
Coding application more difficult and leads to few
standardization of the created codes.
Considering this context, to enhance the Coding
application, we are proposing the use of
visualization and text mining to allow that various
documents are analyzed at the same time. This
simultaneous analysis of various documents can
UsingVisualizationandTextMiningtoImproveQualitativeAnalysis
207

make the Coding application more agile and more
standardized, because when a quotation is identified
and a code is created, this action is evaluated on all
the documents that are being analyzed.
Hence, this paper presented the concept of
simultaneous analysis, explaining the steps that
compose its application. The use of visualization and
text mining makes the proposal feasible. To apply
these techniques, a tool is indispensable and this is
the reason why Insight tool is being developed.
Therefore, through an experimental study we
explained the proposal and have conducted a first
feasibility study.
In relation to effectiveness, the results of this
study showed that Group A presented the most
standardized and homogeneous results. This result
gives insights that analyzing the set of documents
simultaneously, may facilitate the reuse of codes. In
relation to efficiency, the results showed that the
proposal makes the Coding (qualitative analysis)
procedure more agile than when this procedure is
conducted manually, what was expected.
Based on the subjects’ feedback questionnaire
we drew evidences that the search functionality
combined with visualization make the Coding
activity easier, which may improve the qualitative
analysis process.
Considering the experience of conduct this study,
we can cite two lessons learned. First, the difficulty
to analyze the subject’s results, since in the context
of qualitative analysis it is not appropriate to
establish an oracle. Hence, we created a reference
model for comparing the results, just to minimize the
assumption that the subjects could apply the Coding
technique in a wrong way. Second, in this study we
required that the subjects extracted all relevant
information contained in the newspaper documents;
maybe, if we establish a specific topic for the
Coding application (perspective), the analysis of the
results could be easier and more precise.
Despite these questions, we consider that the
proposal is feasible and promising. As future works
we plan to conclude the development of the proposal
through the Insight tool and make it available under
the GLP license. Besides, we will explore the
proposal in the context of experimental studies for
analyzing the characterization form and feedback
questionnaires and a study to compare Insight tool
with Atlas.ti software.
In addition to these further works realized, the
proposal has been used for analyzing primary studies
in the context of secondary studies (Thematic
Synthesis (Cruzes, Dybå, 2011)) and in the context of
software inspection process for analyzing defects lists.
REFERENCES
Basili, G, Basili., V., Green, S. Laitenberger, O., Lanubile,
F., Shull, F., Sorumgard, S., Zelkowitz, M., 1996.
Packaging researcher experience to assist replication
of experiments. In ISERN Meeting, Sydney, pp. 3-6.
Basili, V., Caldiera, C., Rombach, H., 1996. Goal
Question Metric Paradigm, In Marciniak, J.,
Encyclopedia of Software Engineering, London: John
Wiley & Sons.
Coleman, G., O'Connor, T., 2007. Using grounded theory
to understand software process improvement: A study
of Irish software product companies. Information and
Software Technology. vol.49, n.6, p. 654-667.
Cruzes, D., Dybå, T. 2011. Recommended Steps for
Thematic Synthesis in Software Engineering. In
International Symposium on Empirical Software
Engineering and Measurement, ESEM’11, Banff,
Canada, PP. 275-284
Feldman, R., Sanger, J., 2007. The Text Mining Handbook.
Cambridge: Cambridge Univ. Press.
Gu, Q., Lago, P. Exploring service-oriented system
engineering challenges: A systematic literature review.
Service Oriented Computing and Applications, vol. 3,
n. 3, p.171-188.
Hancock, B., 2002. Trent Focus for Research and
Development in Primary Health Care: An
Introduction to Qualitative Research. Trent Focus.
Jedlitschka, A, Ciolkowski, M., Pfahl, D., 2008. Reporting
guidelines for controlled experiments in software
engineering, In Shull, F., Singer, J., Sjoberg, D., Guide
to Advanced Empirical Software Engineering, Eds.
London: Springer.
Johnson, B, Shneiderman, B., 1991. Tree-maps: a space-
filling approach to the visualization of hierarchical
information structures, In IEEE Conf. on
Visualization, October 1991, pp. 284-291, San Diego.
Salton, G., Allan, J. 1994. Text Retrieval Using the Vector
Processing Model, In 3rd Symp. Document Analysis
and Information Retrieval, March 1994. Las Vegas
Seaman, C., 1999. Qualitative methods in empirical
studies of software engineering, IEEE Transactions on
Software Engineering, vol. 25, n. 4, p.557-573.
Seaman, C., 2008. Qualitative Methods. In Shull, F.,
Singer, J., Sjoberg, D., Guide to Advanced Empirical
Software Engineering, Eds. London: Springer.
Strauss, A., Corbin, J., 2008. Basics of qualitative
research: techniques and procedures for developing
grounded theory. Sage Publications, 3ed.
Shull, F., Carver, J., Travassos, G., 2001. An empirical
methodology for introducing software processes, IN
European Software Eng. Conf. , September 2001, pp.
288-296, Helsinki.
Wohlin, C., Runeson, P., Höst, M., 2000. Experimentation
in Sof. Eng. - An Introduction, Sweden: Springer.
ICEIS2014-16thInternationalConferenceonEnterpriseInformationSystems
208
