
Fuzzy DEMATEL Model for Evaluation Criteria of Business
Intelligence
Saeed Rouhani
1
, Amir Ashrafi
2
and Samira Afshari
2
1
Faculty of Managment, University of Tehran, Tehran, Iran
2
Department of Management, Allameh Tabataba’i University, Tehran, Iran
Keywords: Business Intelligence, Evaluation Criteria, Fuzzy DEMATEL, Casual and Effect Model.
Abstract: In response to an ever increasing competitive environment, today’s organizations intend to utilize business
intelligence (BI) in order to promote their decision support. In other words, BI capabilities for enterprise
systems would be essential to evaluate the enterprise systems. Hence, the key factors for evaluating
intelligence-level of enterprise systems have been determined in past studies. More in this research, the
causal relationships between criteria of each factor have been obtained to construct impact-relation map. To
this aim, this study presents a new hybrid approach containing fuzzy set theory, and the decision making
trial and evaluation laboratory (DEMATEL) method. This study considered six main factors for evaluation
of BI for enterprise system include: analytical and intelligent decision-support, providing related experiment
and integration with environmental information, optimization and recommended model, reasoning,
enhanced decision-making tools, and stakeholders’ satisfaction; and have determined the root or cause
criteria in each factor. In general, the outcomes of this study can be used as a basis for roadmap of
differentiation of BI capabilities in the form of evaluation criteria. Also, it can provide an effective and
useful model by separating criteria into cause group and effect group in an uncertainty environment.
1 INTRODUCTION
Traditional enterprises are often involved issues
such as overflow of data, shortage of
information/knowledge and inadequacy of reports
(Lin et al., 2009, Mikroyannidis and Theodoulidis,
2010, Yigitbasioglu and Velcu, 2012), naturally
makes disorder in organizational decision making
process. Thus, with regard to the importance of
information in business environment and managerial
decision making process (Bucher et al., 2009) as
well as to achieve the main objective of any
corporation that is “right access to information
quickly” (Sahay and Ranjan, 2008), utilizing the
decision support is considered as one of the
organizational requirements of current and future, to
support management decision making and planning
(Power and Sharda, 2007).
In the past studies, decision support systems are
considered as an island system besides the other
information systems in organization (Kristianto et
al., 2012, Gunasekaran and Ngai, 2012, Xu et al.,
2007, Sancho et al., 2008, Doumpos and
Zopounidis, 2010). However, as (Alter, 2004) states
today’s approach to decision support creates an
integrated decision support environment, and takes
the intelligence requirements of enterprise systems
into consideration. It means that business
intelligence (BI) are capabilities of enterprise
systems which enable organization in decision
support process and tools (Ranjan, 2008).
In most evaluation model, BI has been
considered as tools or independent systems. In our
previous research (Ghazanfari et al., 2011, Rouhani
et al., 2011), we have found 34 criteria and 6 core
categories about BI of enterprise systems by
considering BI as an umbrella concept to create a
comprehensive decision support environment.
However, due to this fact that there is no evident
study to evaluate BI of an enterprise system from an
overall perspective, determining the importance
level and effect of the given criteria on the overall
system performance is so important. Hence, this
study proposes a novel model combining the fuzzy
set theory to deal with the vagueness of human
thought, and the Decision Making Trial and
Evaluation Laboratory (DEMATEL) method to
construct impact-relation map and determine cause
group and effect group. In general, the main
456
Rouhani S., Ashrafi A. and Afshari S..
Fuzzy DEMATEL Model for Evaluation Criteria of Business Intelligence.
DOI: 10.5220/0004882404560463
In Proceedings of the 16th International Conference on Enterprise Information Systems (ICEIS-2014), pages 456-463
ISBN: 978-989-758-027-7
Copyright
c
2014 SCITEPRESS (Science and Technology Publications, Lda.)
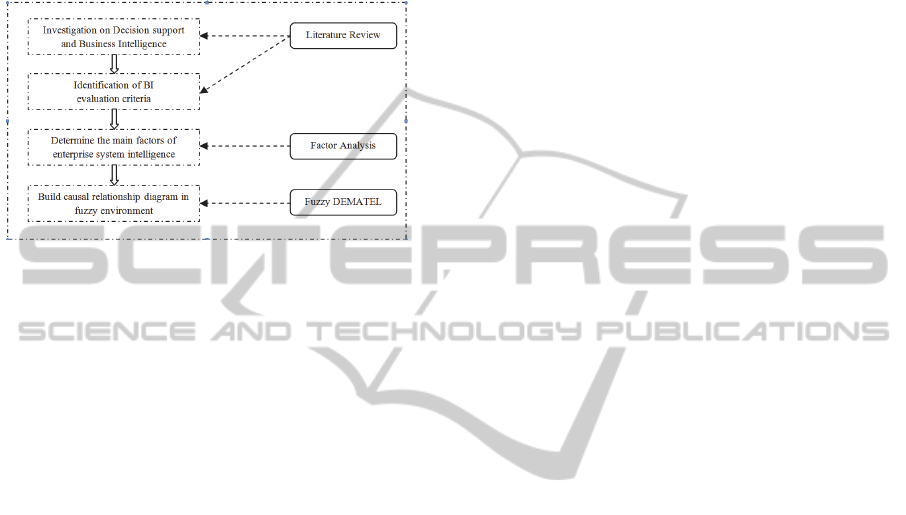
objectives of this study can be grouped into 3 as
follows: (1) determine the cause and effect criteria
of BI for enterprise systems; (2) build impact-
relation diagram between the evaluation criteria in
each factor; (3) determine the key criterion of each
factor. The summary view of this research can be
seen in Fig. 1.
Figure 1: The main steps of the evaluation procedure.
Indeed, this research was carried out to find
answers to the above research objectives. Therefore,
the remainder of this study is structured as follows.
In section 2, a wide-range of review from prior
studies both in context of BI are presented. In
section 3, research methods are discussed in detail.
The findings of this research and comprehensive
discussion about the empirical study are described in
section 4. Finally, section 5 contains the conclusion
and future direction of the research.
2 BUSINESS INTELLIGENCE
Managers know that traditional analysis tools and
methods could not be afforded to meet the decision-
making requirements in terms of timely and
accurately response (Bucher et al., 2009,
Mikroyannidis and Theodoulidis, 2010, Duan et al.,
2011). Hence, many organizations are seeking to
adopt BI applications as a Data-driven DSS to
efficiently manage corporate operations and improve
organizational decision making (Isik et al., 2011,
Petrini and Pozzebon, 2009, Cheng et al., 2009).
The term BI was introduced by (Luhn, 1958) as a
set of techniques based on statistical procedures with
proper communication facilities and input-output
equipment in order to accommodate all information
problems of an organization. In other words, BI
integrates the analysis of data with decision support
system to provide information to people throughout
the organization in order to improve strategic and
tactical decisions (Li et al., 2008).
In this regard, BI has been proposed as a generic
term to describe leveraging the organizations
internal and external information assets for adopting
better business decisions (Kimball and Ross, 2002).
In here, we label BI among system-enabler
approach comprised of broad capabilities and
functions to support the strategic decision-making
process by preparing an appropriate decision support
environment.
In this paper, according to previous studies,
factors and related criteria of each factor in context
of business intelligence of enterprise systems has
determined .A brief description in relation to each
factor is presented as follows (Ghazanfari et al.,
2011):
Analytical and Intelligent Decision-support (F1).
This factor includes capabilities and competencies of
an enterprise system to support decision makers by
visual reports and to inform them by alarms and
warnings utilizing agents and through channels. The
base of these information, knowledge’s and reports
is data warehouse of enterprise.
Providing Related Experiment and Integration
with Environmental Information (F2). In this
factor, decision makers get support and assist via
importing data from business environment and
providing them with groupware to decide by
collective intelligence.
Optimization and Recommended Model (F3).
This factor covers criteria and specifications which
attempt to optimize decision making results using
optimization methods and simulation techniques. In
this factor interactive optimizing via dynamic and
evolutionary prototyping are considered and base on
them, recommendations to decision maker would be
offered.
Reasoning (F4). In each organizational deciding,
reason presenting is important for giving rationality
to decision makers, in this factor capability of
knowledge reasoning and forward and backward
reasoning are spotted as business intelligence
evaluation criteria in enterprise systems and
software.
Enhanced Decision-making Tools (F5). Decision
makers are often more interested in verbal and
conceptual judgments rather than crisp and certain
values. Regarding this advantage, in this factor, the
capability of enterprise systems in analyzing fuzzy
values and multi criteria decision making are
considered as BI evaluation criteria.
Stakeholders’ Satisfaction (F6). This factor
includes the points of view of organizational
stakeholders about consequences of decisions which
FuzzyDEMATELModelforEvaluationCriteriaofBusinessIntelligence
457

made by supporting of BI. Accusation and precision
of the decision are considered as satisfaction criteria
of organizational stakeholders in this factor.
3 METHODOLOGY
This study proposed an integrated approach to
evaluate BI criteria for enterprise systems based on
hybrid model combined fuzzy set theory, and
DEMATEL method. The DEMATEL method is a
comprehensive method in order to build a structural
model based on digraphs, which can separate
involved factors into cause and effect groups (Wu
and Lee, 2007). Then, due to the fuzzy nature of this
study, the fuzzy logic is applied to deal with the
vagueness of human thought in such fuzzy
environment.
3.1 Fuzzy Set Theory
In today’s environment of uncertainty with different
daily decision making problems of diverse intensity,
the results can be misleading if the fuzziness of
human decision-making is not taken into account
(Tsaur et al., 2002). Furthermore, the crisp values
are insufficient and unrealistic for a subjective
judgment, especially when the information is vague
or imprecise (Chang and Wang, 2009). Thus, fuzzy
logic can be employed to measure ambiguous
concepts related with human beings subjective
judgments (Zhou et al., 2011). Indeed, fuzzy set
theory is designed to deal with the vagueness of
human thought. According to (Zadeh, 1965), “a
fuzzy set is a class of objects with a continuum of
grades of membership”.
3.2 Decision Making Trial and
Evaluation Laboratory
The Decision Making Trial and Evaluation
Laboratory (DEMATEL) technique emerged at
Battelle Memorial Institute through its Geneva
Research Center (Fontela and Gabus, 1976), is
especially pragmatic way for constructing a causal
relationship with matrices or digraphs (Büyüközkan
and Çifçi, 2012). As a result, alternatives having
more effect on another are considered cause and
those receiving more influence from another are
embedded in effect group (Seyed-Hosseini et al.,
2006). Furthermore, the DEMATEL method
displays which factors have more fundamental
importance on the whole system and which have not
(Zhou et al., 2011). According to (Lee et al., 2010),
DEMATEL is employed to find all causal
relationships includes (direct and indirect) and
strength of influence between all variables of a
complicated system through matrix calculation.
In general, due to demonstration capabilities of
directed relationships of sub-systems, they are more
valuable than directionless graphs. Also, digraph
portrays a contextual relation between the elements
of the system, in which the numeral indicates the
strength of influence. Hence, the DEMATEL
method can convert the relationship among the
causes and effects of factors into an intelligible
structural model of the system (Wu and Lee, 2007).
Currently, DEMATEL method has been adopted in
various fields (Liou et al., 2008, Tseng, 2009, Hu et
al., 2011, Wu, 2012, Wu, 2008, Tzeng et al., 2007,
Vujanović et al., 2012, Chou et al., 2011, Tseng et
al., 2012, Rouhani et al., 2013). In this study, the
DEMATEL method takes complex systems and
directly compares the relative relationship among
different BI characteristic, using a matrix to
calculate all direct and indirect cause and effect
relationships and level of influence between BI
characteristics, especially through the use of impact-
relation map to simplify the decision making.
Essential definitions of DEMATEL method are
described as follows:
Definition 1: (Construct the initial direct relation
matrix). The initial relation matrix A is a nn
matrix can be obtained through pairwise comparison
in which A
is denoted as the degree to which the
criterion i affects the criterionj, i.e. Aa
.
Definition 2: (Normalize the direct relation
matrix). The normalized direct relation matrix D can
be acquired by using the formula (1), in which all
elements of the matrix D are between
0,1
and all
elements on the principal diagonal elements are
equal to zero.
1
max
∑
(1)
Definition 3: (Build total relation matrix). The total
relation matrix T is calculated by using formula (2).
T DI D
(2)
Where I is denoted as the identity matrix.
Furthermore, the sum of rows and sum of
columns of matrix T can be acquired through the
formulas (3) and (4), in which R denote the sum of
rows and C denote the sum of columns.
R
t
(3)
ICEIS2014-16thInternationalConferenceonEnterpriseInformationSystems
458
C
t
(4)
Definition 4: (Set a threshold value to establish
impact-relation map (IRM)). Threshold value must
be set in order to explain the structural relation
between factors. Also, it is necessary for removing
insignificant effects in matrix T. Here, the threshold
value has been obtained by expert opinion.
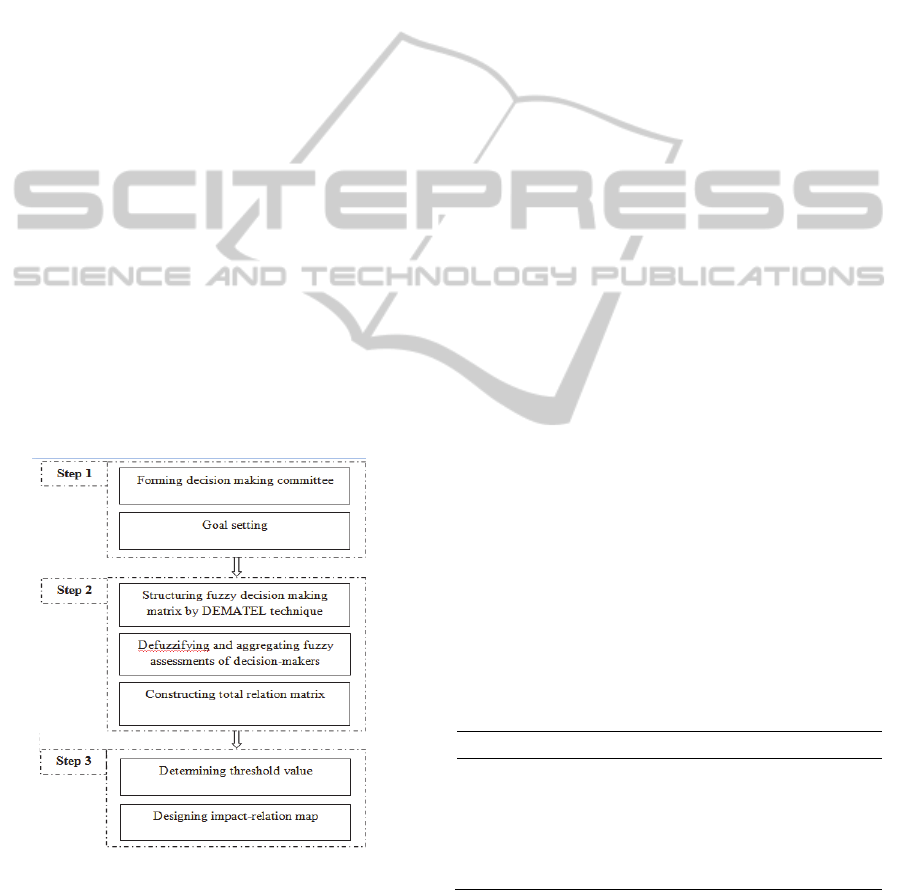
3.3 The Proposed Method
In the following, the complete procedure of the
hybrid model in uncertainty environment is
explained.
Step 1: goal setting and forming a committee. At
first, in the decision making process a goal should be
identified. Also, Advantages and disadvantages are
evaluated and optimal alternative are selected. So, it
is essential to form a committee in order to collect
group knowledge and solve the problem.
Step 2: aggregate decision-makers assessments
by interpreting the linguistic information into fuzzy
scale. To obtain the relationship between evaluation
criteria’s a group of experts were invited to make
assessments in context of influences and directions.
Furthermore, in order to deal with the imprecise
assessments by experts the linguistic variables is
applied
Figure 2: The main steps of the proposed method.
Step 3: designing and analyzing the impact-
relation map. Evaluation in DEMATEL methods is
based on expert opinions and builds causal
relationship diagram. Indeed, the DEMATEL is used
to separate criteria into cause and effect group. The
normalized direct-relation matrix D is calculated
based on Eq. (1). Then, Eq. (2) is used to obtain the
total relation matrix T. Next, by using Eqs (3) - (4),
the causal relationship diagram can be acquired. At
this stage, if the value of RC is positive, it means
that the criteria has more impact on other criteria.
Finally, to find suitable effects, the threshold value
of each factors were defined by expert’s decisions.
The complete procedure of the proposed method is
shown in Fig 2.
4 EMPIRICAL RESULTS
In this section, the empirical study shows how
organizations applied the proposed method to
determine the BI criteria of enterprise systems for to
enhance the competitive advantage. Sub-section 4.1
contains description about the problem,
questionnaire and the expert interview. Applications
of the proposed method are described in sub-section
4.2. Finally, the results of total relation matrix and
impact-relation maps are discussed in sub-section
4.3.
4.1 Materials
In recent decades enterprise systems have been used
to help managers in decision making process. But
due to the lack of BI in enterprise systems,
organizations need to evaluate these systems in
terms of intelligence-level before buying and
deploying them. Therefore, in this study, we develop
an overall perspective using hybrid model
combining fuzzy logic and causal and effect decision
making model based on 34 criteria and 6 core factors
had been identified in our previous research
(Ghazanfari et al., 2011).
Table 1: The correspondence of linguistic terms and
values.
Linguistic terms Triangular fuzzy numbers
Very high influence (VH) (0.75,1,1)
High influence (H) (0.5,0.75,1)
Low influence (L) (0.25,0.5,0.75)
Very low influence (VL) (0,0.25,0.5)
No influence (No) (0,0,0.25)
Hence, the questionnaire for DEMATEL analysis
is used based on factor analysis results to specify
interrelationships between criteria of each factor
using 5 point linguistic scale includes “Very high,
High, Low, Very low, and No” which is expressed
FuzzyDEMATELModelforEvaluationCriteriaofBusinessIntelligence
459

in positive triangular fuzzy numbers as shown in
Table 1. The prepared questionnaire were distributed
between expert committee includes IT Managers,
System Analysts, and BI experts.
4.2 Applications of the Proposed
Method
The proposed method is divided into three steps. In
first step, the committee defined the goal to gain
structural model, and specify the importance-level
and impact-level of each criteria in order to evaluate
enterprise systems in viewpoint of BI. In step 2,
based on factor analysis results 6 main categories
includes analytical and intelligent decision-support
(F1), providing related experiment and integration
with environmental information (F2), optimization
and recommended model (F3), reasoning (F4),
enhanced decision-making tools (F5), stakeholders’
satisfaction (F6) had been explored.
More, the inter-relationships between criteria of
each factor for each decision-maker were obtained
by using fuzzy linguistic scale. Then, the CFCS
method was used to defuzzify aggregate all
assessments data. Finally, the total relation matrix
was acquired in this step.
In step 3, the threshold value was obtained based
on expert’s opinion to construct impact relation
diagram. Therefore, the threshold value for
analytical and intelligent decision-support (F1),
providing related experiment and integration with
environmental information (F2), optimization and
recommended model (F3), reasoning (F4), enhanced
decision-making tools (F5), stakeholders’
satisfaction (F6) were 0.137, 0.574, 0.414, 1.481,
3.332, and 0.488. These threshold means that only
value over them were considered and the others
were insignificant. Finally, the impact-relation map
for each factor could be obtained based on those
threshold values. The values of (R+C) and (R-C)
were obtained to construct impact-relation map in
Tables (2-7).
Table 2: The values of (R+C) and (R-C) for (F1).
Criteria R C R+C R-C
Visual graphs (X1) 1.489 2.118 3.607 -0.629
Alarms and warnings (X2) 1.369 2.401 3.770 -1.032
Online analytical processing
(X3) 1.809 1.566 3.375 0.243
Data mining techniques (X4) 2.196 1.261 3.457 0.935
Data warehouses (X5) 2.531 0.544 3.075 1.987
Web channel (X6) 1.326 0.903 2.229 0.423
Mobile channel (X7) 0.687 1.265 1.952 -0.578
Intelligent agent (X8) 1.850 1.782 3.632 0.068
Multi agent (X9) 1.517 1.285 2.802 0.232
Summarization (X10) 1.278 2.170 3.448 -0.892
E-mail channel (X11) 0.482 1.239 1.721 -0.757
Table 3: The values of (R+C) and (R-C) for (F2).
R C R+C R-C
Groupware (X12) 6.863 5.711 12.574 1.152
Flexible models (X13) 3.935 5.931 9.866 -1.996
Problem clustering (X14) 3.613 5.469 9.082 -1.856
Import data from other
systems (X15)
5.323 3.794 9.117 1.529
Export reports to other
systems (X16)
4.740 3.433 8.173 1.307
Combination of experiments
(X17)
6.345 5.633 11.978 0.712
Situation awareness
modeling (X18)
4.896 5.282 10.178 -0.386
Group decision-making
(X19)
4.756 6.180 10.936 -1.424
Environment awareness
(X20)
5.992 5.030 11.022 0.962
Table 4: The values of (R+C) and (R-C) for (F3).
R C R+C R-C
Optimization technique (X21) 4.740 1.921 6.661 2.819
Learning technique (X22) 3.031 2.991 6.022 0.040
Simulation models (X23) 4.798 2.584 7.382 2.214
Risk simulation (X24) 1.795 3.010 4.805 -1.215
Evolutionary prototyping model (X25) 2.406 3.649 6.055 -1.243
Dynamic model prototyping (X26) 2.684 3.417 6.101 -0.733
Dashboard/recommender (X27) 0.798 2.680 3.478 -1.882
Table 5: The values of (R+C) and (R-C) for (F4).
R C R+C R-C
Financial analysis tools
(X28)
4.955 3.234 8.189 1.721
Backward and forward
reasoning (X29)
4.653 4.956 9.609 -0.303
Knowledge reasoning
(X30)
3.715 5.133 8.848 -1.418
Table 6: The values of (R+C) and (R-C) for (F5).
R C R+C R-C
Fuzzy decision-making
(X31)
7.163 6.162 13.325 1.001
MCDM tools (X32) 6.163 7.164 13.327 -1.001
4.3 Discussion
The aim behind the DEMATEL method is to find
the relation between the identified criteria and
construct impact-relation map. Hence, in this study
the DEMATEL method was adopted to define the
weighted significance of each criterion in related to
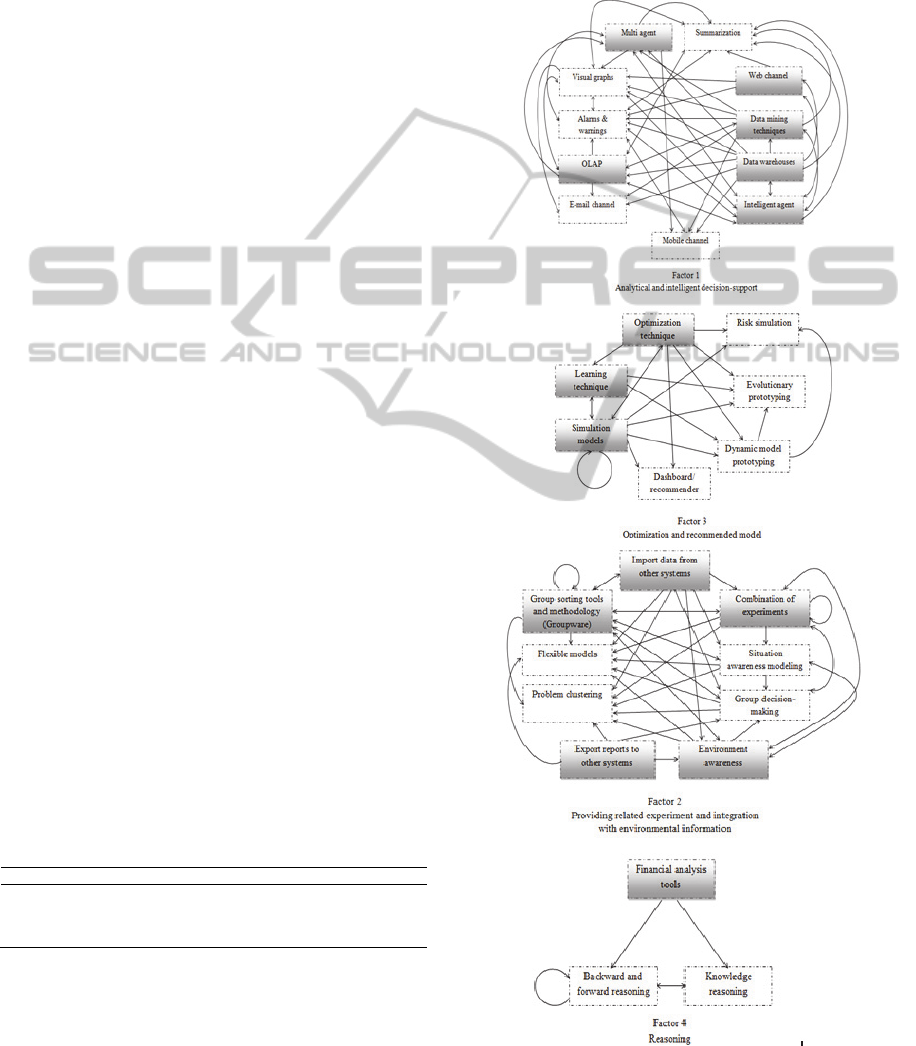
each factor and map out the impact-level of each of
them as shown in impact-relation map (Fig. 3).
In respect to Tables (2-7) the criteria of each
factor were classified into positively affected and
negatively affected group. Positively affected group
ICEIS2014-16thInternationalConferenceonEnterpriseInformationSystems
460
are those with have positive (R-C) value. In the
simplest sense, the criteria in this group influence
the other criteria most and are influenced the other
criteria least. In here, we show these criteria as
shadowed object. Liekwise, negatively-affected
group are those with have negative (R-C) value
between the other criteria. In here, we show these
criteria as non-shadowed object.
Whit respect to the above arguments, in factor
F1, online analytical processing (X3), data mining
techniques (X4), data warehouses (X5), web channel
(X6), intelligent agent (X8), and multi agent (X9)
were considered as the positively affected criteria
and the other factors include visual graphs (X1),
alarms and warnings (X2), mobile channel (X7),
summarization (X10), and finally e-mail channel
(X11) were considered as the negatively affected
criteria. The key criterion of factor F1 was found to
be “data warehouses (X5)”. In a similar vein, the
criteria of providing related experiment and
integration with environmental information (F2)
include groupware (X12), import data from other
systems (X15), export reports to other systems
(X16), combination of experiments (X17),
environment awareness (X20) were the positively
affected criteria and flexible models (X13), problem
clustering (X14), situation awareness modelling
(X18), group decision-making (X19) were the
negatively affected criteria. The key criterion of
factor F2 was found to be “import data from other
systems (X15)”.
In terms of optimization and recommended
model factor (F3), the criteria optimization
technique (X21), learning technique (X22),
simulation models (X23) were grouped into the
positively affected criteria and risk simulation
(X24), evolutionary prototyping model (X25),
dynamic model prototyping (X26),
dashboard/recommender (X27) were grouped into
the negatively affected criteria. The key criterion of
factor F3 was found to be “optimization techniques
(X21)”.
Table 7: The values of (R+C) and (R-C) for (F6).
R C R+C R-C
Stakeholders’ satisfaction (X33) 0.476 1.476 1.952 -1
Reliability and accuracy of
analysis (X34)
1.476 0.476 1.952 1
In reasoning factor (F4), financial analysis tool
(X28) was a positively affected criterion. Also,
backward and forward reasoning (X29), and
knowledge reasoning (X30) were the negatively
affected criteria. The key criterion of factor F4 was
found to be “financial analysis tools (X28)”. Also,
in regard to factor F5, fuzzy decision-making (X31)
was considered as positively affected criteria and
MCDM tools (X32) was considered as negatively
affected criteria. The key criterion of factor F5 was
found to be “fuzzy decision-making (X31)”.
Figure 3: The impact-relation maps of six factors derived
by fuzzy DEMATEL method.
FuzzyDEMATELModelforEvaluationCriteriaofBusinessIntelligence
461

Finally, reliability and accuracy of analysis (X34)
was a positively affected criteria and stakeholders’
satisfaction (X33) was a negatively affected criterion
in factor F6. The key criterion of factor F6 was
found to be “reliability and accuracy of analysis
(X34)”.
5 CONCLUSIONS
Nowadays, various types of enterprise systems (ES)
have been used by organizations to enhance
competitive advantage through data integration and
analysis in real environment. Due to this fact that
these systems are presented as one of the integral
part of organizational decision making process,
evaluating BI for enterprise systems and determining
the importance-level of each intelligent tools is so
important to create decision support environment for
managers in decision-making process. In this study,
after reviewing on prior BI evaluation model, by
considering BI in viewpoint of system-enabler, an
evaluation model based on hybrid model containing
fuzzy logic and DEMATEL technique was
developed. In here, fuzzy DEMATEL method was
fully described. Based on proposed method, the
factors and criteria were assessed through expert
committee, all responses were aggregated and
finally, the total relation matrix of each factor was
acquired. Then, with considering expert opinions,
the threshold values for each factor were determined
in order to identifying significant relationship
between criteria of each factor and removing
insignificant relationships. Here, a new evaluation
model was developed using hybrid concept to assess
importance-level and influence level of each criteria.
Furthermore, the key criterions of each factor were
determined in terms of intelligence for enterprise
system. So, further researches are needed to rich
cause and effects model by gathering universal data.
Applying other MCDM methods in a fuzzy
environment to arranging BI evaluation criteria, and
comparing the results of these methods is also
recommended for future research.
REFERENCES
Alter, S. 2004. A Work System View Of Dss In Its Fourth
Decade. Decision Support Systems, 38, 319-327.
Bucher, T., Gericke, A. & Sigg, S. 2009. Process-Centric
Business Intelligence. Business Process Management
Journal, 15, 408-429.
Büyüközkan, G. & Çifçi, G. 2012. A Novel Hybrid Mcdm
Approach Based On Fuzzy Dematel, Fuzzy Anp And
Fuzzy Topsis To Evaluate Green Suppliers. Expert
Systems With Applications, 39, 3000-3011.
Chang, T. H. & Wang, T. C. 2009. Using The Fuzzy
Multi-Criteria Decision Making Approach For
Measuring The Possibility Of Successful Knowledge
Management. Information Sciences, 179, 355-370.
Cheng, H., Lu, Y.-C. & Sheu, C. 2009. An Ontology-
Based Business Intelligence Application In A
Financial Knowledge Management System. Expert
Systems With Applications, 36, 3614-3622.
Chou, Y. C., Sun, C. C. & Yen, H. Y. 2011. Evaluating
The Criteria For Human Resource For Science And
Technology (Hrst) Based On An Integrated Fuzzy Ahp
And Fuzzy Dematel Approach. Applied Soft
Computing.
Doumpos, M. & Zopounidis, C. 2010. A Multicriteria
Decision Support System For Bank Rating. Decision
Support Systems, 50, 55-63.
Duan, Y., Ong, V. K., Xu, M. & Mathews, B. 2011.
Supporting Decision Making Process With “Ideal”
Software Agents–What Do Business Executives
Want? Expert Systems With Applications.
Fontela, E. & Gabus, A. 1976. The Dematel Observer.
Battelle Institute, Geneva Research Center.
Ghazanfari, M., Jafari, M. & Rouhani, S. 2011. A Tool To
Evaluate The Business Intelligence Of Enterprise
Systems. Scientia Iranica.
Gunasekaran, A. & Ngai, E. W. T. 2012. Decision Support
Systems For Logistics And Supply Chain
Management. Decision Support Systems, 52, 777-778.
Hu, H. Y., Chiu, S. I., Cheng, C. C. & Yen, T. M. 2011.
Applying The Ipa And Dematel Models To Improve
The Order-Winner Criteria: A Case Study Of
Taiwan’s Network Communication Equipment
Manufacturing Industry. Expert Systems With
Applications, 38, 9674-9683.
Isik, O., Jones, M. C. & Sidorova, A. 2011. Business
Intelligence (Bi) Success And The Role Of Bi
Capabilities. Intelligent Systems In Accounting,
Finance And Management.
Kimball, R. & Ross, M. 2002. The Data Warehouse
Toolkit: The Complete Guide To Dimensional
Modelling. New York Ua.
Kristianto, Y., Gunasekaran, A., Helo, P. & Sandhu, M.
2012. A Decision Support System For Integrating
Manufacturing And Product Design Into The
Reconfiguration Of The Supply Chain Networks.
Decision Support Systems, 52, 790-801.
Lee, Y. C., Li, M. L., Yen, T. M. & Huang, T. H. 2010.
Analysis Of Adopting An Integrated Decision Making
Trial And Evaluation Laboratory On A Technology
Acceptance Model. Expert Systems With Applications,
37, 1745-1754.
Li, S. T., Shue, L. Y. & Lee, S. F. 2008. Business
Intelligence Approach To Supporting Strategy-Making
Of Isp Service Management. Expert Systems With
Applications, 35, 739-754.
Lin, Y. H., Tsai, K. M., Shiang, W. J., Kuo, T. C. & Tsai,
C. H. 2009. Research On Using Anp To Establish A
ICEIS2014-16thInternationalConferenceonEnterpriseInformationSystems
462

Performance Assessment Model For Business
Intelligence Systems. Expert Systems With
Applications, 36, 4135-4146.
Liou, J. J. H., Yen, L. & Tzeng, G. H. 2008. Building An
Effective Safety Management System For Airlines.
Journal Of Air Transport Management, 14, 20-26.
Luhn, H. P. 1958. A Business Intelligence System. Ibm
Journal Of Research And Development, 2, 314-319.
Mikroyannidis, A. & Theodoulidis, B. 2010. Ontology
Management And Evolution For Business
Intelligence. International Journal Of Information
Management, 30, 559-566.
Petrini, M. & Pozzebon, M. 2009. Managing
Sustainability With The Support Of Business
Intelligence: Integrating Socio-Environmental
Indicators And Organisational Context. The Journal
Of Strategic Information Systems, 18, 178-191.
Power, D. J. & Sharda, R. 2007. Model-Driven Decision
Support Systems: Concepts And Research Directions.
Decision Support Systems, 43, 1044-1061.
Ranjan, J. 2008. Business Justification With Business
Intelligence. Vine, 38, 461-475.
Rouhani, S., Ashrafi, A. & Afshari, S. 2013. Segmenting
Critical Success Factors For Erp Implementation
Using An Integrated Fuzzy Ahp And Fuzzy Dematel
Approach. World Applied Sciences Journal, 22.
Rouhani, S., Ghazanfari, M. & Jafari, M. 2011. Evaluation
Model Of Business Intelligence For Enterprise
Systems Using Fuzzy Topsis. Expert Systems With
Applications.
Sahay, B. & Ranjan, J. 2008. Real Time Business
Intelligence In Supply Chain Analytics. Information
Management & Computer Security, 16, 28-48.
Sancho, J., Sánchez-Soriano, J., Chazarra, J. A. &
Aparicio, J. 2008. Design And Implementation Of A
Decision Support System For Competitive Electricity
Markets. Decision Support Systems, 44, 765-784.
Seyed-Hosseini, S., Safaei, N. & Asgharpour, M. 2006.
Reprioritization Of Failures In A System Failure Mode
And Effects Analysis By Decision Making Trial And
Evaluation Laboratory Technique. Reliability
Engineering & System Safety, 91, 872-881.
Tsaur, S. H., Chang, T. Y. & Yen, C. H. 2002. The
Evaluation Of Airline Service Quality By Fuzzy
Mcdm. Tourism Management, 23, 107-115.
Tseng, M. L. 2009. Using The Extension Of Dematel To
Integrate Hotel Service Quality Perceptions Into A
Cause–Effect Model In Uncertainty. Expert Systems
With Applications, 36, 9015-9023.
Tseng, M. L., Chen, Y. H. & Geng, P. Y. 2012. Integrated
Model Of Hot Spring Service Quality Perceptions
Under Uncertainty. Applied Soft Computing.
Tzeng, G. H., Chiang, C. H. & Li, C. W. 2007. Evaluating
Intertwined Effects In E-Learning Programs: A Novel
Hybrid Mcdm Model Based On Factor Analysis And
Dematel. Expert Systems With Applications, 32, 1028-
1044.
Vujanović, D., Momčilović, V., Bojović, N. & Papić, V.
2012. Evaluation Of Vehicle Fleet Maintenance
Management Indicators By Application Of Dematel
And Anp. Expert Systems With Applications.
Wu, W. W. 2008. Choosing Knowledge Management
Strategies By Using A Combined Anp And Dematel
Approach. Expert Systems With Applications, 35, 828-
835.
Wu, W. W. 2012. Segmenting Critical Factors For
Successful Knowledge Management Implementation
Using The Fuzzy Dematel Method. Applied Soft
Computing, 12, 527-535.
Wu, W. W. & Lee, Y. T. 2007. Developing Global
Managers’ Competencies Using The Fuzzy Dematel
Method. Expert Systems With Applications, 32, 499-
507.
Xu, L., Li, Z., Li, S. & Tang, F. 2007. A Decision Support
System For Product Design In Concurrent
Engineering. Decision Support Systems, 42, 2029-
2042.
Yigitbasioglu, O. M. & Velcu, O. 2012. A Review Of
Dashboards In Performance Management:
Implications For Design And Research. International
Journal Of Accounting Information Systems, 13, 41-
59.
Zadeh, L. A. 1965. Fuzzy Sets. Information And Control,
8, 338-353.
Zhou, Q., Huang, W. & Zhang, Y. 2011. Identifying
Critical Success Factors In Emergency Management
Using A Fuzzy Dematel Method. Safety Science, 49,
243-252.
FuzzyDEMATELModelforEvaluationCriteriaofBusinessIntelligence
463
