
PRIMROSe
A Tool for Enterprise Architecture Analysis and Diagnosis
David Naranjo, Mario S
´
anchez and Jorge Villalobos
Department of Systems and Computing Engineering, Universidad de los Andes, Bogot
´
a, Colombia
Keywords:
Enterprise Architecture, Visual Analysis, Enterprise Models, Model Analysis.
Abstract:
Enterprise Models are the central asset that supports Enterprise Architecture, as they embody enterprise and
IT knowledge and decisions. Static analysis over this kind of models is made by inspecting certain properties
and patterns, with the goal of gaining understanding and support decision making through evidence. However,
this is not a straightforward process, as the model in its raw form is rarely suitable for analysis due to its
complexity and size. As a consequence, current approaches focus on partial views and queries over this
model, leading to partial assessments of the architecture. In this paper, we propose a different approach to EA
analysis, which consists on the incremental assessment of the architecture based on the interaction of the user
with visualizations of the whole model. We implemented our approach in a visual analysis tool, PRIMROSe,
where analysts can rapidly prototype custom functions that operate on topological properties of the model,
combine partial insights for sounder assessments, associate these findings to visual attributes, and interact
with the model under several visualization techniques.
1 INTRODUCTION
Thirty years since its inception, Enterprise Architec-
ture (EA) has evolved from a method for reconciling
business and IT to a relatively mature discipline. En-
terprise Modelling is one of the subjects where EA
can deliver real value on the organization, and con-
sists on the development of Enterprise Models (EMs),
which are the embodiment of all the collected infor-
mation about the enterprise under several perspec-
tives. Building EMs typically comes with a high price
tag that is payed for when they are analyzed, that is,
when additional knowledge is created by processing
and reworking previously defined facts (Buckl et al.,
2010). The knowledge gained from analyzing EMs
serves to support decision making processes in archi-
tectural and stakeholders boards, and to lower risk.
A very important concern with analysis is that it
is far from being a trivial task. Most of the times,
analyzing an EM involves the formulation and refor-
mulation of hypotheses, as well as the composition of
different insights in order to get to sound assessments.
Furthermore, the scope of analysis processes is arbi-
trary and not necessarily known a priori. It may range
from a full-fledged impact analysis over the entire
model, to an in-depth analysis on a specific domain
where issues were detected during the early stages of
the analysis process. For instance, if an analyst needs
to assess the business process architecture of an en-
terprise, he would use a pertinent and proven method
(e.g. Flow Analysis) for this evaluation, which differs
from say, a security (e.g. vulnerability) assessment.
Furthermore, it would be a good idea to use a combi-
nation of several methods, in order to arrive to more
powerful insights.
On top of that, the reasoning process behind an
analysis is rarely expressed and documented because
it heavily depends on the experience of the analyst.
This lack of a traceability mechanism forces the ana-
lyst to guess the rationale behind past decisions.
Also, we have to take into account that EA mod-
elling tools offer different features and thus restrict
the kind of analysis that they support (Schekkerman,
2006). Some of the characteristics that result in lim-
itations include a) the modelling approach, b) the
metamodels supported, and c) their analytical capa-
bilities, which range from model conformity checks
to generation of pre-defined views and the possibility
to query the model.
Given known and important characteristics of
EMs, such as being large, complex, typed, and struc-
tural in nature (Naranjo et al., 2013), visualizations
are becoming more and more used to support analysis
methods. However, most modelling tools only pro-
201
Naranjo D., Sánchez M. and Villalobos J..
PRIMROSe - A Tool for Enterprise Architecture Analysis and Diagnosis.
DOI: 10.5220/0004884702010213
In Proceedings of the 16th International Conference on Enterprise Information Systems (ICEIS-2014), pages 201-213
ISBN: 978-989-758-029-1
Copyright
c
2014 SCITEPRESS (Science and Technology Publications, Lda.)

vide the capacity to visualize (by means of diagrams
or views) partial models that are subsets of an EM.
While there is the notion of an integration of these
views to form an unified model, it is rarely possible to
apply analysis techniques over the whole EM.
The problem with this, as evidence suggests, is
that applying analysis without an overview of the
whole model can possibly lead to information loss
and reaching false conclusions (Naranjo et al., 2012).
Furthermore, interactive exploration of the large vol-
umes of data by visual means, appears to be “... use-
ful when a person simply does not know what ques-
tions to ask about the data or when the person wants to
ask better, more meaningful questions” (Fekete et al.,
2008). This precisely reflects what precedes most
ad-hoc analyses and explains why visualizations are
progressively considered less as a product (diagrams)
than a medium.
Taking into account the issues discussed above,
we consider that a platform that enables structural
analysis of EMs, and is supported by its visual ex-
ploration and interaction, can facilitate the tasks of an
analyst. Thus, we can formulate our research ques-
tion as follows: How can we provide an useful and
flexible method for inspecting facts on an Enterprise
Model, and what is the architecture behind an anal-
ysis tool that supports the visualization of the whole
model, displaying these facts incrementally?
The goal of this paper is to present a conceptual
framework –and a tool that implements it– that ad-
dresses these issues. This framework supports the
formulation of analytical functions that enrich the
model, and allows their visualization through an ex-
tensible set of visualization techniques. This work is
based on the usage of overview visualizations that dis-
play the underlying topology of an Enterprise Model
and help the analyst to incrementally find new struc-
tural properties and patterns. This conceptual frame-
work was implemented in PRIMROSe, an advanced
platform for the analysis of metamodel-independent
EMs, which provides feedback continuously as new
insights are generated during an analysis process.
The structure of this paper is as follows: First, in
Section 2 we will provide a literature review of sim-
ilar approaches. Section 3 offers an overview of our
approach, followed by Section 4, which describes the
conceptual framework and the architecture of PRIM-
ROSe. Then, Section 5 will describe in depth the anal-
ysis component of the tool, and Section 6 will explain
how to map analysis results into visualizations. Fi-
nally, Section 7 will discuss results and future steps.
2 RELATED WORK
In general, Visual Analysis of Enterprise Architec-
tures is grounded in the wide array of previous work
in Software Visualization. The contribution of (Panas
et al., 2005) is a framework and an architecture
that supports the configuration of model-to-view and
view-to-scene transformations, under a graph-based
approach.
Based on the relation between visual attributes and
views, the authors start from a model graph, which
is translated almost directly to a view graph, filtering
unused properties from the model. Visual Metaphors
are a collection of common Visual Representations,
i.e. families of visual objects fitting together, and are
used to visualize properties of a model under a given
visualization, such as graphs, trees, or more complex
3D representations (e.g. city maps).
However, this architecture does not support the
differentiation of edges, an important requirement on
EA Analysis (Naranjo et al., 2013). Moreover, as the
framework deals just with the visual mapping, so the
platform requires a pre-processing of the model that
is left to the user. Finally, it is not clear how to travel
the way back from visualization to further analysis,
i.e. the representation is static.
(Chan et al., 2010) describe a Visual Analysis tool
for bottom-up enterprise analysis, based on the incre-
mental reconstruction of hierarchical data. Analysis
is made by the exploration of the model, starting with
an initial view of an entity, and adding elements to
a graph visualization by selecting concepts and rela-
tions in the metamodel. This is complemented with a
set of filtering, searching, and abstraction methods.
This bottom-up exploration is useful to manage
the complexity of models, and can be a complement
to top-down analysis. However, this approach as-
sumes that the analyst knows where to start, which
is a problem in models of thousands to millions
of elements. Moreover, previous processing and
analysis is again a prerequisite, and custom views
have to be coded a priori, as there is no integration
with graphical frameworks. Finally, EMs are semi-
hierarchical (Naranjo et al., 2013), which means that
non-hierarchical edges are eliminated.
In the field of Model Driven Engineering, Zest
(The Eclipse Foundation, 2013), based on the work
of (Bull, 2008), amplifies visual capabilities of mod-
elling editors based on the Graphical Editing Frame-
work with Spring, Tree, Radial and Grid layout algo-
rithms, or in general, families of graph visualizations.
The framework allows the processing of the model
graph, e.g. to search for paths, operating in terms of
the attributes of the model elements. Also, it is pos-
ICEIS2014-16thInternationalConferenceonEnterpriseInformationSystems
202

sible to selectively highlight elements and relations,
developing view operations that modify visual at-
tributes. However, each view must be developed from
scratch, and while the authors focus on an easily to
program framework, there is no explicit way to com-
pose and process independent view operations. Also,
despite there is an effort to provide custom visualiza-
tions, and support for other graph formats has been re-
cently added (such as the DOT format of the Graphviz
library), visualization is bounded to the techniques of-
fered by their visualization toolkit.
Recent approaches on the Visual Analysis of EA
focus on view-based modelling and analysis. (Buckl
et al., 2007; Schaub et al., 2012) describe the concep-
tual framework and requirements behind the genera-
tion of domain independent interactive visualizations
that comply to pre-defined stakeholder Viewpoints,
linking an abstract View Model with the EA Infor-
mation Model.
With a focus on non-technological stakeholders,
the authors provide a tool (Hauder et al., 2013) that
allows the design of ad hoc visualizations that filter
the model taking into account aspects such as access
rights of a stakeholder to the information.
In (Roth et al., 2013), the authors further enhance
this framework with a pattern matching algorithm that
supports the mapping of information and view mod-
els, based on the information demand and offering.
The tool provides a set of configurable visualization
techniques, such as a Gantt Charts, Matrices, Bubble
Charts, and Cluster Maps.
While this allows the analysis of the Enterprise
Model by non-technical business experts, it makes
difficult to provide flexible and specialized analysis
to architects. As described in Section 1, the genera-
tion of these views deal with the communication of
the architecture.
In summary, there are some aspects that current
research is not addressing, leaving a gap in the field
of Enterprise Model Analysis:
• We could not find approaches that allow the com-
position/combination of different analysis meth-
ods, i.e. incremental processing of the model by
operating on previous analysis routines.
• Approaches seldom provide a clear division be-
tween analysis and visualization, the latter com-
monly being just a product of the analysis, e.g. di-
agrams, instead of a medium for interactive anal-
ysis.
• Support for ad-hoc analysis is limited, and often
implies the development of tailored analysis tools
from scratch.
• We could not find approaches that take full advan-
tage of the several topological properties of Enter-
prise Models seen as networks/graphs, such as the
differentiation of relations between elements, dis-
covery of paths, clusters, or graph metrics.
• Current approaches are often tied to a concrete
graphical library/framework, offering a limited set
of visualization techniques. Moreover, the com-
position of several techniques on the same repre-
sentation is not possible.
3 VISUAL ANALYSIS OF EA
MODELS
Visual Analysis takes advantage of the ability of peo-
ple to discover patterns easily, and revolves around
giving shape - or Finding the Gestalt (Buja et al.,
1996)- of information, in order to uncover outliers,
bad smells, and interesting or unusual groups/clusters.
In this aspect, the human visual system is one of the
most sophisticated in nature, and shape is one of the
most important visual attributes to characterize ob-
jects (Backes et al., 2009).
On the other hand, the complexity of Enterprise
Models demands new methods for inspecting their
properties and finding interesting facts about them.
Thus, Visual Analysis appears as a valuable field with
several ideas that we can take advantage of.
This section will describe the Visual Analysis pro-
cess that starts with an Enterprise Model and ends
with the results of analysis that derive on assessments
about the architecture. This kind of analysis is in-
cremental, and it is guided by the interaction of the
analyst with the model.
3.1 Visual Exploration and Interaction
In their study about the interactive nature of visu-
alizations, (Chi and Riedl, 1998) provide a concep-
tual model and a classification of interactive tasks.
They propose the notion of operators that transform a
data model under a series of stages in a Visualization
Pipeline (see Fig. 1). This results on a view of the
data, mediated by Analytical and Visualization mod-
els.
(Wickham et al., 2009) take this idea further, as-
serting that any visualization technique has the (of-
ten implicit) notion of a pipeline. However, they also
mention the fact that this pipeline metaphor breaks
down when user interaction is considered: on each
transformation stage of the process, user interaction
(e.g., grouping, collapsing, zooming) can take the vi-
sualization to another transformation step. Thus, in-
PRIMROSe-AToolforEnterpriseArchitectureAnalysisandDiagnosis
203
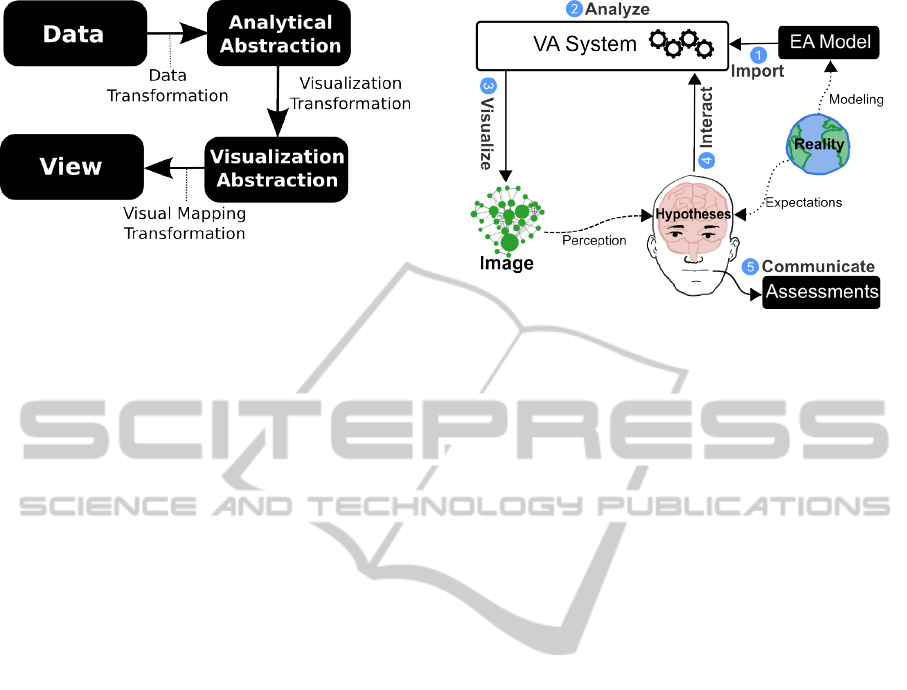
Figure 1: Visualization Pipeline from (Chi and Riedl,
1998).
stead of being sequential, the Visual Analysis pro-
cesses operate in a sense-making loop, or dialog, be-
tween the user and the data in a visual form.
In the context of EA, (Schaub et al., 2012) de-
scribe a conceptual framework with requirements for
interactive visualizations of EA models. In particular,
the interaction type is selected depending on the type
of analysis required. For example, in order to perform
‘what-if’ analyses, it provides the means to generate
dynamic views conformant to a viewpoint metamodel
aligned to the concerns of a stakeholder, and his ac-
cess to information.
3.2 A Process for EA Visual Analysis
At this point we want to make a parallel with the field
of Visual Analytics, which can be regarded as the
transformation from data to insights by a concatena-
tion of several sub processes, such as visualizing data
sets and generating hypothetical models from them.
Visualization is a semi-automated analytical pro-
cess, where humans and systems cooperate using their
respective distinct capabilities for the most effective
results (Kohlhammer et al., 2009). The user mod-
ifies visualization parameters repeatedly (Jankun-
Kelly et al., 2007), allowing the analyst to gain in-
sights by directly interacting with the data, and com-
ing up with new hypotheses that can be validated,
again with visual interaction (Keim, 2002).
This process is based on the economic model of
visualization proposed by van Wijk (van Wijk, 2005;
Fekete et al., 2008), where a visualization is a time-
dependent image (instead of a static one), and a gain
in knowledge is based on the perception of the image
and knowledge acquired from previous interactions.
Inspired by this model, we define EA Visual Anal-
ysis as an iterative process between an Analyst and a
VA System, where hypotheses are generated and re-
fined by the means of interaction with visualizations.
This process (described in Fig. 2) begins with an
Figure 2: The EA Visual Analysis process.
initial Import of the Enterprise Model, which is trans-
formed into a graph structure (part of the Analytical
Abstraction - see Fig. 1). This model can be Ana-
lyzed, i.e. processed under a series of functions that
operate in terms of its structure, adding new informa-
tion. For the first iteration of the process, this stage
will be a lightweight processing, as our priority is to
visualize and explore the model in its totality.
Posterior to this processing, the analyst is able to
Visualize the model structure with several Visualiza-
tion Techniques. We use these visual representations
as a memory aid to amplify cognition - that means,
we transform data into images to derive insights, us-
ing pattern recognition from the human visual system
to process visual information.
As the analyst starts to Interact with visualiza-
tions of the model, Hypotheses (which start as expec-
tations, i.e. weak formulations) get refined over time.
This interaction modifies the parameters of a visual-
ization, both with view and data operators. These last
operators parametrize and activate Analytical Func-
tions for further processing of the model.
Within each iteration, these formulations are con-
firmed or denied, as the analyst starts to associate vi-
sual patterns with EA patterns (Buckl et al., 2008) that
are present from knowledge and experience. Finally,
when the Analyst has acquired sound insights on the
model, he is able to Communicate results from the
analysis in terms of Assessments of the architecture.
This last stage is out of the scope of this paper.
3.3 Requirements for Visual EA
Analysis
The complexity of depicting large models has been
largely examined, and two key concerns that surface
in their visualization are: a) the use of algorithms for
the automatic placement of elements of the model to
ICEIS2014-16thInternationalConferenceonEnterpriseInformationSystems
204
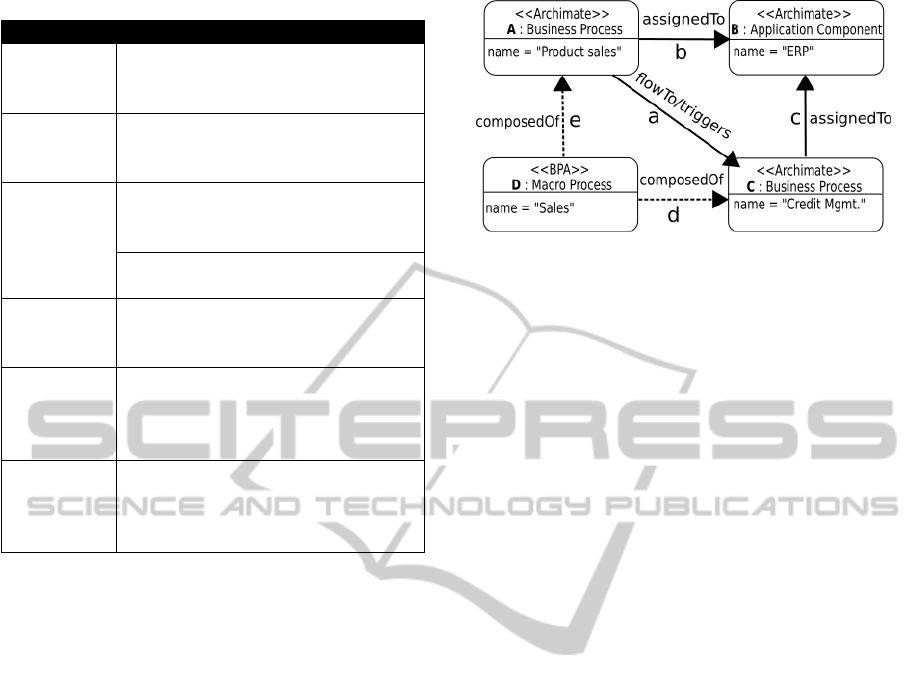
Table 1: EA Analysis Requirements (Naranjo et al., 2012).
Category Description
Identify
and Relate
Domains
Differentiate architecture do-
mains/perspectives, and show the
dependencies between them.
Emphasize
Key Ele-
ments
Selectively give emphasis to certain
elements based on key concepts of
the metamodel or other criteria.
Offer a Fo-
cus of In-
terest
Create groups of interesting ele-
ments, in order to define a fo-
cus/scope for the analysis.
Navigate the model under various
levels of abstraction.
Support
Structural
Diagnosis
Display different visual patterns to
discover critical elements, struc-
tural anomalies and outliers.
Display
Semantic
Character-
istics
Take into account the different rela-
tion types of the metamodel,as their
meaning is valuable information.
Uncover
Archi-
tectural
Qualities
Provide a continuous visual rep-
resentation to offer assessments in
terms of the whole architecture.
minimize visual complexity (Fruchterman and Rein-
gold, 1991), and b) the need of automated abstrac-
tion mechanisms that reduce information overload
(Egyed, 2002).
With these issues in mind, (Naranjo et al., 2012)
defined a collection of requirements from the Visual
and EA Analysis perspectives. By exploring the con-
cept of ‘holistic’ or ‘total’ overview visualizations,
and in the context of Visual Analysis applied to Enter-
prise Models, these requirements were used to evalu-
ate the gap between what is currently offered by popu-
lar EA modelling tools, and what is possible with gen-
eral purpose visualization toolkits. EA Analysis Re-
quirements (see Table 1) provide the guidelines that
complement and support the process described in Sec-
tion 3.2.
These requirements reflect how and what we can
emphasize in an Enterprise Model. For instance, an
Analyst can start by identifying the domains of the
model, and in an incremental manner point to certain
facts from the architecture, e.g. by focusing on groups
that have common characteristics in terms of its enti-
ties (Emphasize Key Elements) and/or relations (Dis-
play Semantic Characteristics).
Another important, but often overlooked issue,
is to maximize the effectiveness of these visualiza-
tions, that means, to provide an overview of the model
that is expressive enough to support the tasks of an
analyst. (Naranjo et al., 2013) examine the effec-
Figure 3: Excerpt of an Enterprise Model.
tiveness of four overview visualization techniques:
Force-directed graphs, Radial graphs, Sunbursts and
Treemaps, and further prescribe use cases (i.e. Ana-
lytical Scenarios) for EA Visual Analysis.
These cases include the diagnosis of Enterprise
Models, that is, to discover anomalies in their struc-
ture, such as isolated sub-graphs of the model. This
pre-emptive aspect of analysis is largely unexplored,
but we consider that it is where valuable insights are
generated, in the same manner as a physician can
identify pathologies with a view to a MRI Scan.
4 PRIMROSe - enterPRIse Model
gRaphical Overview AnalysiS
The goal of this section is twofold. On the one hand,
it will present the architecture of PRIMROSe, the tool
that we developed for performing visual analysis of
EMs. On the other hand, it will present the conceptual
framework at the base of PRIMROSe, and the way it
is structured to support the application of analysis and
visualization functions.
Figure 3 presents a trivial model that will be used
throughout this section to illustrate our conceptual
framework. This figure represents a small excerpt of
an Enterprise Model that relates elements from do-
mains, such as Strategy, Infrastructure, or Business
Process Architecture. In this model, A and C are Busi-
ness Processes, while B is an Application Component
and D is a Macro Process that references processes A
and C. For the purpose of illustrating an analysis over
this model, we will try to assess the consequences of
removing process A. This should have an impact on
B, C and D, and also implies the removal of relations
a, b and e.
4.1 Conceptual Framework: Data
Structures
In order to support even simple analysis such as the
one presented in the previous section, it is necessary
PRIMROSe-AToolforEnterpriseArchitectureAnalysisandDiagnosis
205
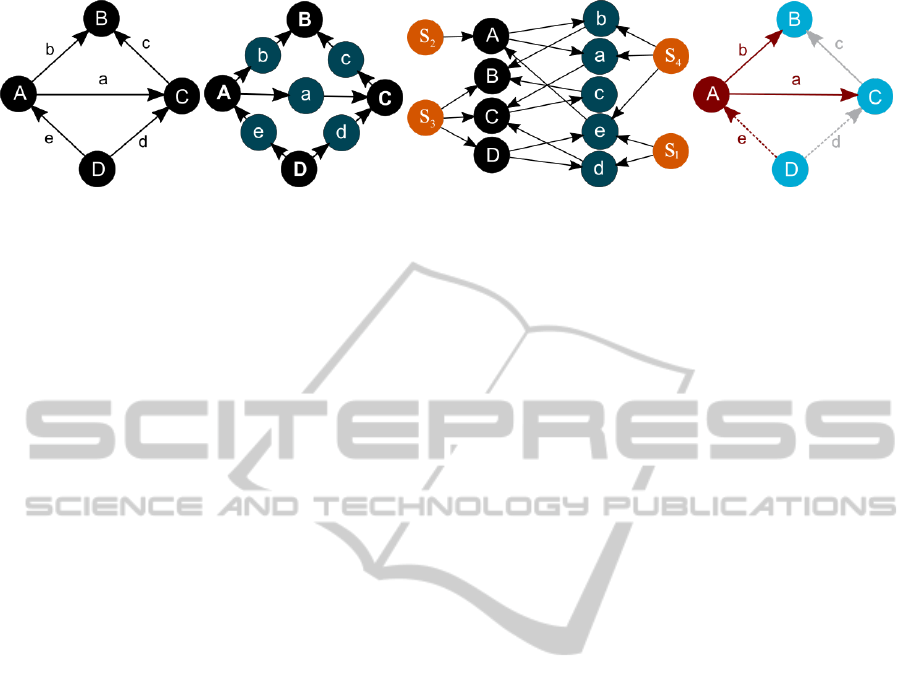
(a) Model Graph G
M
(b) Expanded Graph G
E
(c) Analysis Graph G
A
(d) Visual Result
Figure 4: Transformation stages of the Enterprise Model, from the Model Graph to a Visualization.
to have the capacity to identify or select, and group,
individual elements in the model. Taking into account
that in Enterprise Architecture analysis working with
the relations is as important as working with the ele-
ments, the underlying data structures for the analysis
are not the raw Enterprise Models. Instead of that, the
approach is based on graphs that are an homeomor-
phism on the EM, which means that they are topolog-
ically equivalent to it (Ray, 2012), but make relations
first-level elements. We now describe these graphs
and the way in which they are built, starting from what
we call Model Graph (see Fig. 4(a)).
Model Graph: It is a directed graph G
M
=
(V (G
M
), E(G
M
)), where V (G
M
) is a set of ver-
tices and E(G
M
) is a set of edges. Each vertex
in V (G
M
) references one element of the original
EM, and each edge in E(G
M
) references a rela-
tionship in the model between the corresponding
pair of elements. Furthermore, each vertex can
have attributes that will be added during the anal-
ysis process.
The second data structure, which can be automatically
built from the Model Graph, is what we call the Ex-
panded Graph (see Fig. 4(b)).
Expanded Graph: It is a directed and bipartite
graph G
E
= (V (G
E
), E(G
E
)), where V (G
E
) =
V (G
M
)
S
E(G
M
) is the set of vertices, and E(G
E
)
is the set of edges. Each of these edges connects a
vertex from V (G
M
) and an edge on E(G
M
), or the
other way around.
The Expanded Graph contains exactly the same infor-
mation as the original EM, that is, no new knowledge
has been added. In order to do so, and thus really
start the analysis process, we need to define the third
data structure, which is precisely called the Analysis
Graph. Where this graph differs from the previous
one is on the introduction of an additional type of ver-
tex called selector, which serves to group vertex in a
G
E
, which stand for elements or relationships of the
original EM (see Fig. 4(c)). More precisely, Analysis
Graph and Selectors are defined as follows:
Analysis Graph: A directed graph G
A
=
(V (G
A
), E(G
A
)), where V (G
A
) = V (G
E
)
S
S
is the set of vertices, and E(G
A
) is the set of
edges, each one connecting a pair of vertices. S
is the set of new vertices that are not present in
V (G
E
), and they are called Selectors.
Selector: A node in V (G
A
) that is not present in
V (G
E
), but has edges that point to vertices of
V (G
E
).
4.2 Conceptual Framework: Functions
Ultimately, selectors are the elements in an Analysis
Graph that reify the knowledge acquired through an
analysis process. Within the proposed framework, se-
lectors are added by means of the application of func-
tions that operate over Analysis Graphs. These func-
tions, which should be specifically defined depending
on the kind of analysis been performed, can be of two
types: Analysis Functions, and Decorator Functions.
Analysis Function: It is a function f : G
A
× P →
G
A
that inserts selectors on an Analysis Graph. In
order to be applied, an analysis function requires a
source graph, and a set of parameters which vary
depending on the specific function.
Decorator Function: It is an Analysis Function that
produces a graph with the same vertices and edges
as the original one, but complements the vertices
with additional attributes.
Considering these two types of functions, and the
available data structures, we can now illustrate the
analysis process applied to the sample model. For
this, we now define 5 atomic functions which incre-
mentally process G
A
(see Fig. 5) and ultimately result
in a graph where it is trivial to answer the question
“which elements will be affected by the removal of
process A (Product Sales)?”.
• f
0
is a decorator that adds the domain of an el-
ement as an attribute. In the case of the exam-
ple, elements A, B and C are grouped in the same
domain because they represent ArchiMate (The
ICEIS2014-16thInternationalConferenceonEnterpriseInformationSystems
206
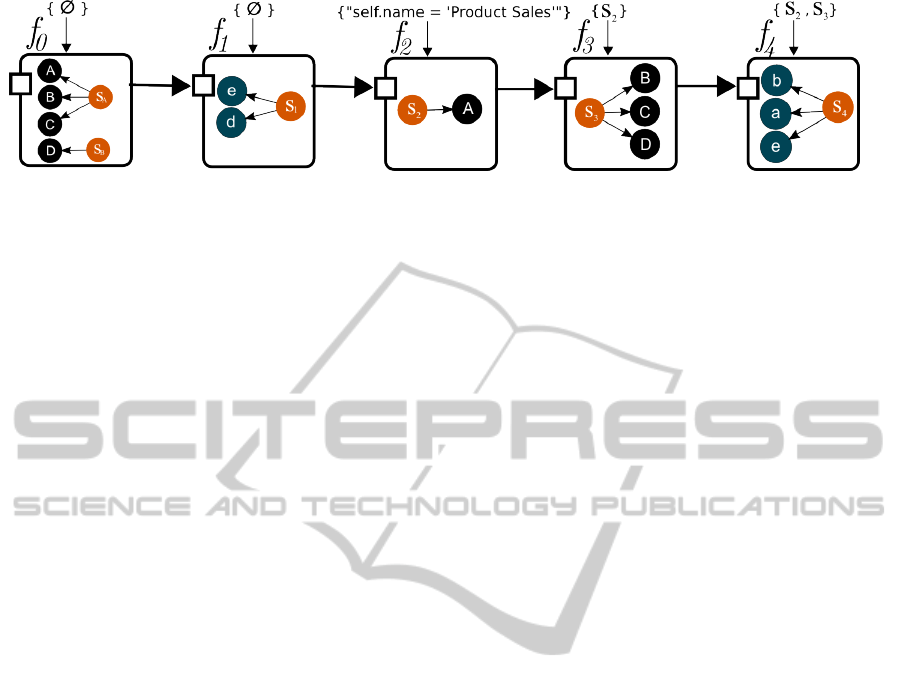
Figure 5: Analysis Pipeline for the example.
Open Group, 2012) concepts, while element D is
classified in another domain.
• f
1
is a function that adds a selector (S
1
) which
groups edges that connect elements from different
domains.
• f
2
is a function that adds a selector (S
2
) to ver-
tices that satisfy an expression entered as a pa-
rameter. In this case, the only element selected is
A, which refers to the Process where the attribute
name equals “Product Sales”.
• f
3
is a function that selects model elements that
are referenced by a selector received as a parame-
ter. In this case, it selects the elements B, C and D,
and introduces the selector S
3
to reference them.
• f
4
is a function that selects the relations between
elements in groups of elements defined by selec-
tors. In this case, it select a, b, and c, which are
the relations between elements selected by S
2
and
S
3
.
4.3 Additional Requirements
In order to describe the architecture of the tool, we
have another set of requirements that are introduced
by the conceptual framework:
1. Incremental Analysis: As described by the pro-
cess in Fig. 2, EA Visual Analysis is incremen-
tal, starting with lightweight processing (or even
no processing at all) in the initial stage of anal-
ysis, and with the application of additional pro-
cessing on demand, given by the interaction of the
user with the tool. In this order of ideas, Anal-
ysis Functions should be applied in a composite
manner, e.g. as a pipeline (see Sec. 5.3), with
functions given in terms of Selectors created on
previously applied functions (see f
3
and f
4
of Fig.
5).
2. Reusable and extensible functions: One of the pil-
lars of Primrose are user-defined analysis func-
tions defined in terms of elements of the model
and/or metamodel, complemented with basic
graph functions (see Sec. 5.1) that are indepen-
dent of the EM and its metamodel.
3. Non-destructive Analysis: As it could be noted by
the reader in Section 4.1, Analysis Functions can-
not remove nodes from the Analysis Graph. Fil-
tering is made explicit by the user in terms of the
visualization, not the data, i.e. elements are visu-
ally hidden, but present in the Analysis Graph.
4. Independence from the Visualization Framework:
Currently, there is no general-purpose graphical
toolkit that satisfies all of the visual requirements
for the Visual Analysis of EMs (Naranjo et al.,
2012). Each one has its own strengths in vari-
ous aspects, so the user should select which one to
use, depending on the visualization technique and
capabilities needed for a specific analysis. Also,
specialized users can design their graphic library
for EA-specific visualizations.
5. Customizable Visualizations: Selectors of the
Analysis Graph must be mapped to visual at-
tributes (see Sec. 6.2) of a visualization. This
mapping has to be translated into toolkit-specific
code and input data.
4.4 Architecture
PRIMROSe architecture is divided into four main
components (see Fig. 6):
Model Container
This component manages the Enterprise Model (i.e.
the Data from Fig. 1) and the Model, Expanded,
and Analysis Graphs. The EM and its metamodel
are imported and converted into the Analysis Graph
G
A
through the transformations defined in Section
4.1. This component communicates with the Anal-
ysis Component, which operates over G
A
and updates
it as necessary.
Analysis Component
Its purpose is to manage and apply the Analysis Func-
tions over the graph G
A
, which is provided by the
Model Container. In order to do so, this component
has an Engine that composes and applies the func-
tions sequentially and using a pipeline design pattern.
PRIMROSe-AToolforEnterpriseArchitectureAnalysisandDiagnosis
207
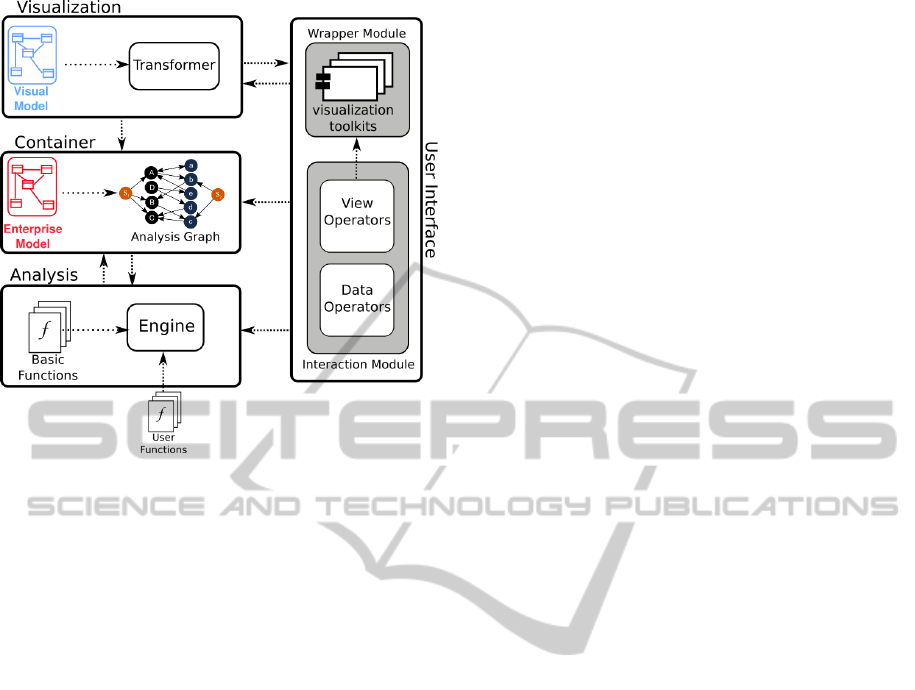
Figure 6: PRIMROSe Architecture.
The order and parameters of these functions are given
by the user that interacts with the UI using Data Op-
erators.
Basic Functions are a set of reusable functions
provided by the framework, and are independent of
the enterprise model and metamodel. Instead, they
operate on the structure of any EM, using several
graph algorithms. On the other side, User Functions,
which operate in terms of the EM, are provided in an
appropriate package (e.g. a jar file) by the user.
We will cover these aspects in detail on Sec. 5.
Visualization Component
As outlined by the fourth requirement (Independence
from the Visualization Framework) of Section 4.3, the
variability in the visual capabilities of the different vi-
sualization toolkits has an impact in the visual results
from the analysis.
Taking into account that each toolkit ‘knows’ how
to visualize a graph (or a similar structure) in its own
fashion, a Transformer Module translates the pro-
cessed graph G
A
(provided by the Model Container)
into tool-specific artifacts, such as code and/or input
files, e.g. a GraphML or a Json file that contains the
data to be visualized. This transformation is mediated
by the Visual Model, and includes the merging of se-
lected attributes from the Enterprise Model, as well as
additional properties inserted by Decorator Functions.
We will cover this component on Sec. 6.
User Interface
This component manages the View, i.e. the visualiza-
tions of the EM. The user explores the model through
View Operators that modify the view without fur-
ther processing or visual mapping (e.g. zooming or
panning). These operators are translated into toolkit-
specific instructions by the means of wrappers, which
are adapters that also contain the canvas that displays
the visualized image.
On the other hand, Data Operators cover two
fronts: a) Operators that modify visual mapping in
the Visualization Component, e.g. the association of
a visual attribute (such as color) to a selector, and b)
operators that modify the parameters and order of ex-
ecution of the pipeline in the Analysis Component.
Finally, the UI also has a panel that communi-
cates with the Model Container and displays all the
attributes of a selected element of the EM, as well
as additional analysis properties inserted by Analysis
Functions.
4.5 Implementation
With the conceptual and functional requirements in
mind, we implemented PRIMROSe, with the follow-
ing considerations in its components:
• Model Container: Supported by the Eclipse
Modeling Framework (EMF), the tool receives
as input the enterprise model and metamodel in
ecore format, which is then processed under a
Model Transformation Chain that creates a Model
Graph G
M
that cross-references elements from the
enterprise model, and finally generates the Analy-
sis Graph G
A
by the expansion of G
M
.
• Analysis Component: Analysis Functions are
defined in the Java language, extending the logic
of the abstract class AnalysisFunction. Processing
of the graph was made using the Java Universal
Network/Graph (JUNG) Framework. Finally, the
Engine is supported by the commons-chain library
of the Apache Software Foundation, which imple-
ments the Chain of Responibility pattern (Gamma
et al., 1994). User-defined functions are inserted
by leaving a jar file in a given folder that the tool
is observing, adding new files to the classpath.
• Visualization Component: The Visual Model
is developed with the help of a Graphical Mod-
eling Framework(GMF) editor, and transforma-
tions into toolkit-specific artifacts were made us-
ing XPAND templates.
• User Interface: Considering that processing
power and supported formats of web navigators
ICEIS2014-16thInternationalConferenceonEnterpriseInformationSystems
208
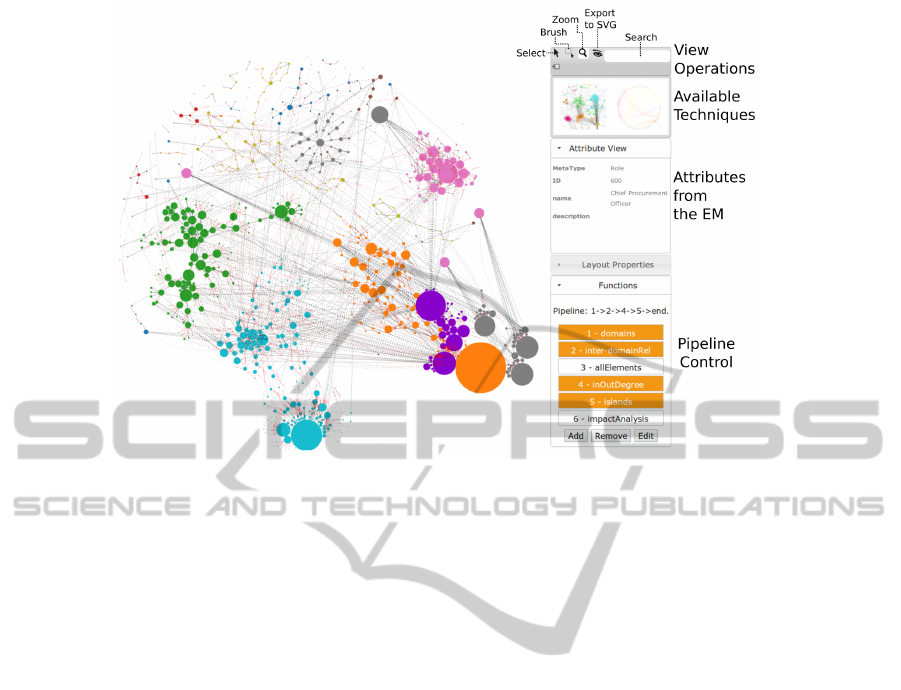
Figure 7: Screenshot of the User Interface.
has improved greatly, we selected Data-Driven
Documents – d3.js (Bostock et al., 2011) as Vi-
sualization toolkit. This library is a JavaScript
graphical framework for creating visualizations
using standards such as SVG, HTML and CSS,
with better performance and flexibility than simi-
lar frameworks in other languages (see Fig. 7).
5 ANALYSIS COMPONENT
As described in Section 3, analysis is a dynamic pro-
cess where the flow of control is constantly chang-
ing between the user and the system, with incremen-
tal processing oriented by the interaction through data
operators.
In this section we will offer more detail of the
Analysis component of PRIMROSe, given in terms
of its most relevant elements.
5.1 Functions
Each Analysis and Decorator Function comes with an
unique identifier, and receives as input the Analysis
graph, in addition to custom parameters defined by the
creator of the function. Their output is the modified
graph, with additional selectors and/or new attributes.
The following snippet of code shows the abstract
Java class that is used to implement specific functions:
public abstract class AnalysisFunction{
String id;
Engine engine;
// Constructor
public AnalysisFunction(String i,Engine e){
...
}
public abstract AnalysisGraph
process(Map<Object> parameters) {
...
}
}
In order to avoid having to start from scratch each
time a new function has to be defined, we built a set
of basic functions which are all reusable and indepen-
dent of the metamodel. The following is a brief de-
scription of some of the most representative functions
among this basic set.
• allElements: Adds a selector for all the elements
of the Enterprise Model.
• allRelations: Adds a selector for all the relations
of the Enterprise Model.
• inOutDegree: A Decorator Function that inserts
as attributes the number of incoming and outgoing
relations of a model element.
• pathsBetween: Using an Adjacency Matrix, this
function inserts a selector for each path between a
set of vertices pointed by a selector that is received
as a parameter.
• spanningTree: Inserts a selector for the edges
that form a spanning tree of the model, navigat-
ing through its composition relations.
PRIMROSe-AToolforEnterpriseArchitectureAnalysisandDiagnosis
209

• islands: Selects all the isolated sub-graphs and
unconnected elements of the model.
5.2 Selectors
The selection of relevant vertices is the backbone of
Analysis Functions. In order to select subsets of
model elements on the graph, the Model Container
exposes methods that allow to query the model in
terms of Object Constraint Language (OCL) expres-
sions (Object Management Group, 2012).
The following fragment of an Analysis Function
shows how we point Selectors to existing vertices of
G
A
:
Selector s1 = new Selector();
String query = "self.name=’Product Sales’";
ExpressionParser ep =
new OCLExpressionParser(query, container);
AnalysisGraph graph = container.getGraph();
graph.addNode(s1);
Collection<Vertex> vertices =
container.getVertices(ep.parse());
for(Vertex v : vertices){
graph.addEdge(s1,v);
}
5.3 Pipeline Engine
The pipeline for analysis consists of an ordered series
of functions (see Fig. 5) that are applied by an Engine
that encapsulates the control flow of the pipeline, act-
ing as a Commander (Wickham et al., 2009).
As described by the Incremental Analysis require-
ment (see Sec. 4.3), the user would need to process
a subset of the model, pointed by a selector in a pre-
vious step of the pipeline. However, at the same time
we would like to preserve the encapsulated nature of
each function. For these reasons, the Engine also has
a registry of the selectors created on each function,
and a method that returns them given a function ID:
public class F5 extends AnalysisFunction{
@Override
public AnalysisGraph process(
Map<Object> parameters){
String selectorName =
(String) parameters.get(‘‘selector’’);
Collection<Selector> selectors =
engine.getSelectors(selectorName);
for(Selector s : selectors){
degree(s);
}
}
/* inserts the in/out degree
as an attribute to every node */
private void degree(Selector s){
Collection<Vertex> vertices =
s.getMembers();
....
}
}
6 VISUALIZATION COMPONENT
The Analysis Component is responsible for the pro-
cessing of the Analysis Graph, which is managed by
the Container. However, after each processing, the vi-
sualization needs to be updated with the new informa-
tion. In this case we need to map analytical and model
properties to previously defined visual attributes of
a visualization technique. Also, the abstract Visual
Model needs to be transformed into toolkit-specific
code.
As we have discussed, each visualization toolkit
has a very different way of doing the conversion be-
tween data and images. For instance, some tools may
require the data to be in a format such GraphML
or JSON, while others handle tool-specific formats.
Moreover, the logic behind the association of visual
properties such as position, color or transparency to
data elements can differ greatly from tool to tool.
While there is an effort to make transparent this con-
version –see (Fekete et al., 2011)–, currently we have
to describe the visual capabilities of a visualization
technique, the mapping of analysis results into this
visualization, and the way that a tool implements the
visualization.
6.1 Overview Visualization Techniques
for EA Analysis
An important task when designing a tool for Visual
Analysis is the selection of techniques that improve
the understanding of the underlying data, and also
support the analysis tasks of the user.
In the process of giving shape to this informa-
tion, several visualization techniques come at hand
(see Fig. 8). In this case, it is useful to describe visu-
alizations independently of the tool that implements
them, and of the data to be depicted. For this reason,
(Naranjo et al., 2013) provide an abstract definition of
a Visualization Technique:
A visualization technique can be seen as the combi-
nation of marks (Bertin, 1983; Mackinlay, 1986)
(atomic graphical elements, e.g. circles, squares,
ICEIS2014-16thInternationalConferenceonEnterpriseInformationSystems
210
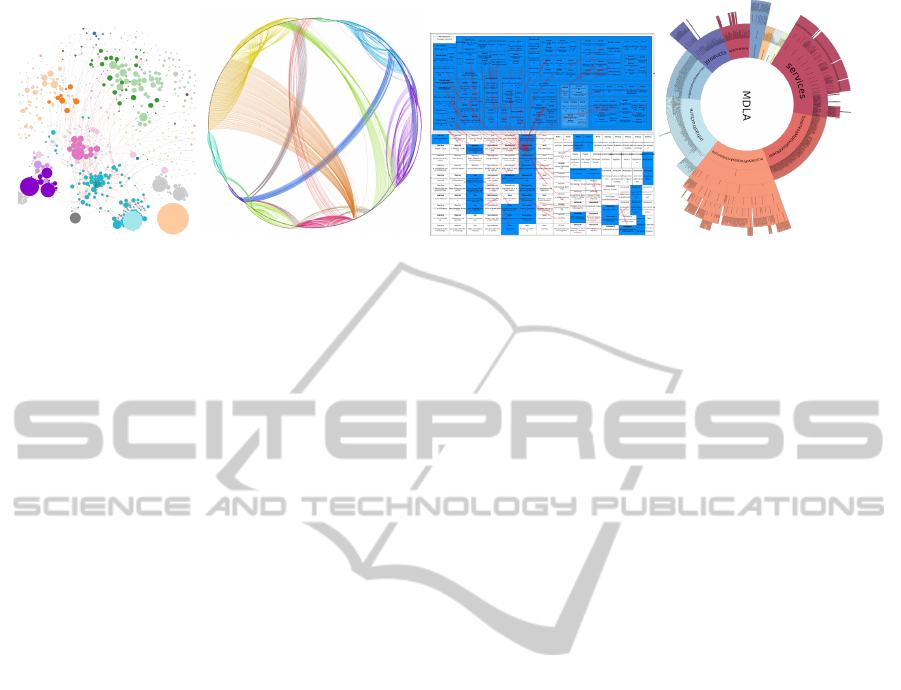
(a) Force-dir. Graph (b) Radial Graph (c) Treemap (d) Sunburst
Figure 8: Selected visualization techniques.
or lines), a layout algorithm, some visual at-
tributes (e.g. color, size, shape), a set of sup-
ported interactive operations and a mapping be-
tween data and such visual attributes.
6.2 Visual Metamodel and Mapping
The mapping of a given visualization technique is the
translation between data and visualization domains.
In order to perform this translation, we require three
elements: 1) A Visual Model of the technique that
describes its supported Visual Variables, independent
of the data and graphical toolkit employed, 2) con-
crete values for the Visual Representation of ele-
ments and relations of Enterprise Model, and 3) A
series of transformations between this visual model
and toolkit-specific code and input files, including the
model data.
A Visual Model represents this mapping on an in-
dividual technique, and conforms to a visualization
metamodel (see Fig. 9). Despite being one single ar-
tifact, for clarity purposes we will separate the Visual
Model into Technique and Representation Models.
Technique Model
A Technique Model instance represents the way a
Visualization Technique is depicted, in terms of the
symbols it uses (marks), and how they are visually
distinguishable, i.e. its visual attributes.
For instance, a Force-directed Graph (see Fig.
8(a)) has two main elements, i.e. marks: nodes, that
represent EM elements, and edges, which represent
relations of the Enterprise Model. Nodes can have
different size, depending on a property of each ele-
ment, or even a custom attribute inserted by a Deco-
rator Function (e.g. the in/out degree, see Sec. 5.1).
Representation Model
This is where we make the real mapping between ab-
stract Technique Models and the Analysis Graph. For
instance, go back to our example in Fig. 4(d), and
consider we are using a Force-Directed Graph. The
user can assign a value of red to the color Visual Vari-
able, mapping this value to Selectors S
2
of the func-
tion f
2
, and S
4
from f
4
(see Fig. 5). In the same fash-
ion, we can assign a blue color to Selector S
3
, and
gray to other relations.
Transformations
Having connected the visual and data domains, we
would like to actually view the model on our screen.
This requires the transformation of our abstract Vi-
sual Model into toolkit-specific instructions and input
files. This can be made with Model to Model (M2M)
and Model to Text (M2T) transformations, starting
with a Visual Model. For instance, this is a generated
JavaScript snippet, using the d3.js toolkit, that assigns
the color and size visual variables:
//size - weight attribute of each node
node.attr("r", function(d){return size(d.weight)})
//color
.style("fill", function(d) {
if(d.selectors.indexOf("S2")>-1){
return ’red’;
}
if(d.selectors.indexOf("S3")>-1){
return ’blue’;
}});
7 CONCLUSION
This paper delineates the Visual Analysis of Enter-
prise Models, emphasizing on the interactive nature
of this activity, and taking into account that there is
a reasoning process – which goes in parallel– in the
brain of the analyst.
Seeing this analysis more as a dialogue than the
production of automated and partial results, the con-
tribution of this paper lies in the conceptual frame-
work and architecture that enables the incremental
PRIMROSe-AToolforEnterpriseArchitectureAnalysisandDiagnosis
211
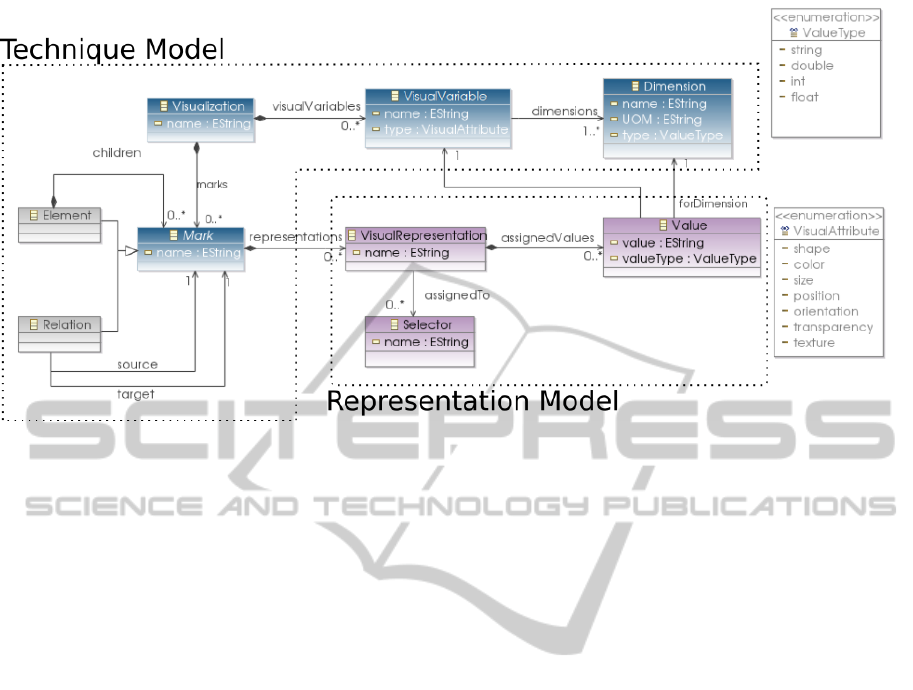
Figure 9: Visual Metamodel with two zones: the Technique Model, which describes constituent elements of a visualization
technique, and a Representation Model, which assigns concrete values to groups of elements of the EM pointed by Selectors.
production and refinement of hypotheses that end in
assessments that support decision making.
We designed this PRIMROSe framework (and
tool architecture) supported by a set of requirements
from various perspectives, also taking into account
the structural properties of Enterprise Models. Anal-
ysis over these models is made with non-destructive
functions that select and decorate an analytical ab-
straction. This Analytical Model is then mapped to
a Visual Model representing overview visualization
techniques, which is transformed into the necessary
artifacts that are needed to depict the results on a
given visualization toolkit. The user interacts with
the visualization and returns the flow of control to the
system, allowing the user to deepen on more detailed
analyses.
We omitted the last stage of the process, Commu-
nicate (see Fig. 2), which deals with the transforma-
tion of a visualization and its associated insights into
assessments. We think this is the meeting point be-
tween PRIMROSe and similar approaches (see Sec-
tion 2) that complement and enhance analysis.
Extension points for the framework include the
traceability of the whole process, which seems a
promising field for complementing and enhancing EA
documentation, as it would provide evidence of the
rationale behind analysis. Moreover, the Analysis
Graph should be preserved throughout the lifecycle
of the Enterprise Model, as it allows the preservation
of the additional facts that are introduced.
On the other hand, we are currently evaluating and
augmenting the tool with more complex scenarios in-
volving different EMs of large enterprises that span
several thousands of elements and relations. As with
every Visual Analysis tool, user feedback shapes the
supported functionality, as well as design considera-
tions that involve its usability. This evaluation con-
sists of a given Enterprise Model and a set of Analyt-
ical Scenarios, which are complex questions that re-
quire some method of analysis to answer. Users will
be invited to use PRIMROSe and fill a questionnaire
addressing both the Analysis Component and the Vi-
sualization Component, in functional (e.g. accuracy,
efficiency) and usability (e.g. location of elements, in-
teractive operations) aspects. This will help us shap-
ing the limitations of the tool, measure its effective-
ness, and assess the minimal set of basic functions
that are useful for the different kinds of EA Analysis.
REFERENCES
Backes, A. R., Casanova, D., and Bruno, O. M. (2009). A
complex network-based approach for boundary shape
analysis. Pattern Recognition, 42(1):54 – 67.
Bertin, J. (1983). Semiology of graphics. University of Wis-
consin Press.
Bostock, M., Ogievetsky, V., and Heer, J. (2011). D3:
Data-driven documents. IEEE Trans. Visualization &
Comp. Graphics (Proc. InfoVis).
Buckl, S., Ernst, A., Lankes, J., Matthes, F., and Schweda,
C. (2008). Enterprise architecture management pat-
terns – exemplifying the approach. In Enterprise Dis-
tributed Object Computing Conference, 2008. EDOC
’08. 12th International IEEE, pages 393 –402.
Buckl, S., Ernst, A. M., Lankes, J., Schweda, C. M., and
Wittenburg, A. (2007). Generating visualizations of
ICEIS2014-16thInternationalConferenceonEnterpriseInformationSystems
212

enterprise architectures using model transformations.
In EMISA, volume P-119 of LNI, pages 33–46. GI.
Buckl, S., Gulden, J., and Schweda, C. M. (2010). Support-
ing ad hoc analyses on enterprise models. In EMISA,
volume 172 of LNI, pages 69–83. GI.
Buja, A., Cook, D., and Swayne, D. F. (1996). Interactive
high-dimensional data visualization. Journal of Com-
putational and Graphical Statistics, 5(1):pp. 78–99.
Bull, R. I. (2008). Model driven visualization: towards a
model driven engineering approach for information
visualization. PhD thesis, Victoria, B.C., Canada,
Canada.
Chan, Y.-H., Keeton, K., and Ma, K.-L. (2010). Interactive
visual analysis of hierarchical enterprise data. In Pro-
ceedings of the 12th IEEE International Conference
on Commerce and Enterprise Computing, CEC ’10,
pages 180–187, Washington, DC, USA. IEEE Com-
puter Society.
Chi, E. H.-h. and Riedl, J. (1998). An operator interaction
framework for visualization systems. In Proceedings
of the 1998 IEEE Symposium on Information Visual-
ization, INFOVIS ’98, pages 63–70, Washington, DC,
USA. IEEE Computer Society.
Egyed, A. (2002). Automated abstraction of class diagrams.
ACM Trans. Softw. Eng. Methodol., 11:449–491.
Fekete, J.-D., Hemery, P.-L., Baudel, T., and Wood, J.
(2011). Obvious: A meta-toolkit to encapsulate in-
formation visualization toolkits, one toolkit to bind
them all. In Visual Analytics Science and Technology
(VAST), 2011 IEEE Conference on, pages 91 –100.
Fekete, J.-D., van Wijk, J., Stasko, J., and North, C. (2008).
The value of information visualization. In Informa-
tion Visualization, volume 4950 of Lecture Notes in
Computer Science, pages 1–18. Springer Berlin / Hei-
delberg.
Fruchterman, T. M. J. and Reingold, E. M. (1991). Graph
drawing by force-directed placement. Softw. Pract.
Exper., 21:1129–1164.
Gamma, E., Helm, R., Johnson, R., and Vlissides, J.
(1994). Design Patterns: Elements of Reusable
Object-Oriented Software. Addison-Wesley Profes-
sional, 1 edition.
Hauder, M., Roth, S., Pigat, S., and Matthes, F. (2013). A
configurator for visual analysis of enterprise architec-
tures. In ACM/IEEE 16th International Conference
on Model Driven Engineering Languages and Systems
(MODELS 2013), Miami, USA.
Jankun-Kelly, T., Ma, K.-L., and Gertz, M. (2007). A model
and framework for visualization exploration. Visual-
ization and Computer Graphics, IEEE Transactions
on, 13(2):357 –369.
Keim, D. A. (2002). Information visualization and visual
data mining. IEEE Transactions on Visualization and
Computer Graphics, 8(1):1–8.
Kohlhammer, J., May, T., and Hoffmann, M. (2009). Visual
analytics for the strategic decision making process. In
GeoSpatial Visual Analytics, NATO Science for Peace
and Security Series C: Environmental Security, pages
299–310. Springer Netherlands.
Mackinlay, J. (1986). Automating the design of graphical
presentations of relational information. ACM Trans.
Graph., 5(2):110–141.
Naranjo, D., S
´
anchez, M., and Villalobos, J. (2012). Vi-
sual analysis of enterprise models. In Workshops Pro-
ceedings of the 16th IEEE International Enterprise
Distributed Object Computing Conference, EDOCW
2012. IEEE Computer Society.
Naranjo, D., S
´
anchez, M., and Villalobos, J. (2013). Con-
necting the dots: Examining visualization techniques
for enterprise architecture model analysis. In Grabis,
J., Kirikova, M., Zdravkovic, J., and Stirna, J., editors,
PoEM, volume 1023 of Short Paper Proceedings of
the 6th IFIP WG 8.1 Working Conference on the Prac-
tice of Enterprise Modeling, pages 29–38. CEUR-WS.
Object Management Group (2012). OMG Object
Constraint Language (OCL), Version 2.3.1.
http://www.omg.org/spec/OCL/2.3.1/.
Panas, T., Lincke, R., and Lwe, W. (2005). Online-
configuration of software visualizations with vizz3d.
In Naps, T. L. and Pauw, W. D., editors, SOFTVIS,
pages 173–182. ACM.
Ray, S. (2012). Graph Theory with Algorithms and its
Applications: In Applied Science and Technology.
Springer.
Roth, S., Hauder, M., Zec, M., Utz, A., and Matthes, F.
(2013). Empowering business users to analyze enter-
prise architectures: Structural model matching to con-
figure visualizations. In 7th Workshop on Trends in
Enterprise Architecture Research (TEAR 2013), Van-
couver, Canada.
Schaub, M., Matthes, F., and Roth, S. (2012). Towards a
conceptual framework for interactive enterprise archi-
tecture management visualizations. In Modellierung,
volume 201 of LNI, pages 75–90. GI.
Schekkerman, J. (2006). How to survive in the jungle of en-
terprise architecture frameworks: creating or choos-
ing an enterprise architecture framework. Trafford.
The Eclipse Foundation (2013). Zest: The eclipse visual-
ization toolkit. http://www.eclipse.org/gef/zest/. Re-
trieved on Oct. 15, 2013.
The Open Group (2012). ArchiMate 2. 0 Specification. Van
Haren Publishing.
van Wijk, J. (2005). The value of visualization. In Visual-
ization, 2005. VIS 05. IEEE, pages 79 – 86.
Wickham, H., Lawrence, M., Cook, D., Buja, A., Hofmann,
H., and Swayne, D. (2009). The plumbing of interac-
tive graphics. Computational Statistics, 24:207–215.
PRIMROSe-AToolforEnterpriseArchitectureAnalysisandDiagnosis
213
