
Towards the Effectiveness of the SMarty Approach for Variability
Management at Sequence Diagram Level
Anderson Marcolino, Edson Oliveira Jr and Itana M. S. Gimenes
Informatics Department, State University of Maring
´
a, Avenida Colombo, 5790, Maring
´
a-PR, Brazil
Keywords:
Sequence Diagram, Empirical Validation, SMarty, Software Product Line, UML, Variability Management,
Effectiveness.
Abstract:
SMarty is a variability management approach for UML-based software product lines. It allows the identifica-
tion, delimitation and representation of variabilities in several UML models by means of a UML profile, the
SMartyProfile, and a systematic process with guidelines to provide user directions for applying such a profile.
SMarty, in its first versions did not support sequence models. In recent studies, SMarty was extended support
to these types of UML models. Existing UML-based variability management approaches in the literature,
including SMarty, do not provide empirical evidence of their effectiveness, which is an essential requirement
for technology transfer to industry. Therefore, this paper presents empirical evidence of the SMarty approach
to recent extension to UML sequence level models.
1 INTRODUCTION
The search to increase the reuse in software develop-
ment lead the creation of software product line (SPL)
approach, that gained increasing attention in recent
years due to the competition in the software devel-
opment segment (Pohl et al., 2005). Its main objec-
tive is the derivation of products for a specific domain.
Such an approach comprises a set of essential activi-
ties, such as variability management, which is a key
issue for the success of SPLs. Several approaches
for variability management have been proposed in the
literature, as pointed out by Chen et al.(Chen et al.,
2009).
Amongst existing variability management ap-
proaches there are SMarty (OliveiraJr et al., 2010)
and the Ziadi et al. approach (Ziadi et al., 2003).
SMarty aims to manage variabilities in UML mod-
els supported by a profile and a set of guidelines for
applying such a profile to use cases, classes, compo-
nents, activities and the recent extension to sequence
models. Ziadi et al. approach is used to manage
variabilities with an UML profile and allows explicit
modeling of common and variable features supported
by UML extensions for class and sequence models.
Therefore, this paper aims to identify the effec-
tiveness of the SMarty approach comparing it to the
Ziadi et al. approach by means of an experimental
study.
The remainder of this paper is organized as fol-
lows: Section 2 presents essential concepts with re-
gard to variability management, the SMarty and the
Ziadi et al. approaches; Section 3 presents the plan-
ning, execution and analysis and interpretation of this
experimental study; and Section 4 presents conclu-
sion and directions for future works.
2 BACKGROUND
2.1 Variability Management
The Variability management activity is one of the es-
sential activities in SPL (Capilla et al., 2013; Chen
et al., 2009). It allows the derivation of specific prod-
ucts for a given domain. It brings out important bene-
fits, such as, increases the reusability of the SPL core
assets, while decreases the time to market and justify
the return on investment (ROI) (Pohl et al., 2005).
There are four main concepts with regard to vari-
ability management (Pohl et al., 2005), which are:
Variability, which is “the ability of a software or
artifact to be changed, customized or configured for
use in a particular context.”. Variabilities can be
composed of variation point, variant and variant con-
straints; Variation Point, which “identifies one or
more locations at which the variation will occur.”
249
Marcolino A., Oliveira Jr E. and Gimenes I..
Towards the Effectiveness of the SMarty Approach for Variability Management at Sequence Diagram Level.
DOI: 10.5220/0004889302490256
In Proceedings of the 16th International Conference on Enterprise Information Systems (ICEIS-2014), pages 249-256
ISBN: 978-989-758-028-4
Copyright
c
2014 SCITEPRESS (Science and Technology Publications, Lda.)

Thus, a variation point may take place at generic arti-
facts and at different levels of abstraction (Pohl et al.,
2005); Variant, which represents the possible ele-
ments through which a variation point may be re-
solved; and Variant Constraints, which state the re-
lationships between two or more variants to resolve a
variation point or a variability.
The relevance of the variability management ac-
tivity for SPLs has been gained attention of many re-
searches, as we can see in several existing studies in
the literature (Gomaa, 2004; Ziadi et al., 2003; Chen
et al., 2009).
Several existing variability management ap-
proaches do not make it clear how to identify, repre-
sent and trace variabilities in different artifacts (Chen
et al., 2009), especially those based on UML models.
This kind of approach most takes into account stereo-
types and tagged values for representing SPL variabil-
ities. However, they fail on presenting the rationale on
how to apply such stereotypes and their relationships.
Industry needs evidence on the effectiveness of these
approaches to make their adoption feasible.
In order to provide a more precise UML-based ap-
proach for variability management, we have been de-
veloped the SMarty approach (OliveiraJr et al., 2010;
Fiori et al., 2012), which is supported by a profile and
a set of guidelines for applying its stereotypes and re-
lationships. In recent study SMarty (version 4.0) was
extend to support UML sequence model (SMarty ver-
sion 5.0). The SMarty extension was proposed based
on two main reasons: the results of a systematic lit-
erature review of variability management approaches,
which identified the lack of approaches that guarantee
an identification and representation of variabilities in
UML sequence models and the need for representing
the dynamic aspects of a SPL by means of interaction
models, as sequence diagrams do.
After proposing the sequence model extension to
the SMarty approach, there is the need of identify
the SMarty effectiveness, as in the study conducted
in (Marcolino et al., 2013). To do so, a similar ap-
proach was chosen, throughout a systematic literature
review: the Ziadi et al. approach (Ziadi et al., 2003;
Ziadi and Jezequel, 2006). Ziadi et al. proposed an
UML Profile with a set of stereotypes to identify vari-
abilities in class and sequence models.
Therefore, gathering initial evidence with regard
to the effectiveness of the SMarty approach was con-
ducted by means of the current experimental study.
The Next sections present the Ziadi et al. and the
SMarty approaches essential concepts.
2.2 The Ziadi et al. Approach
Ziadi et al. propose one of the most representative ap-
proaches for managing variabilities in UML sequence
models (Chen et al., 2009).
The Ziadi et al. approach (Ziadi et al., 2003; Ziadi
and Jezequel, 2006), is supported by an UML profile,
which allows its integration with UML tools to iden-
tify and represent variabilities for the following UML
models: class and sequence.
There is a set of explicit meta-attributes (tagged
values) and meta-classes for performing variability
modeling activity. Ziadi et al. approach uses stereo-
types to provide identification of variation points and
variants, for class and sequence.
The stereotypes proposed by Ziadi et al. to se-
quence models are as follows: optionalLifeline,
used to indicate optional and alternative lifelines;
optionalInteraction, used to represent interac-
tions that might or not might be present in SPL spe-
cific products; variation, used to represent the
variation point of alternative inclusive or exclusive
variants; variant, used to represent the variants
of a variation point; and virtual, used to indicate
that an interaction is a virtual part. It might be rede-
fined by another sequence diagram, and it might be
represent variabilities. It is used in specific cases, in
which the SPL needs to model a behavior that can be
modified.
For extending the semantic for class models and
sequence trough a UML profile, its stereotypes must
be apply to the elements that were extended from
meta-class from UML meta-model, and it represent
a problem for the Ziadi proposal.
The Ziadi et al. approach uses elements, such as
UML Frame. However, this element is not present in
UML modeling tools, such as Poseidon 8.0
1
, Mag-
icDraw 11
2
and Astah 6
3
. The absence of such an
element makes it difficult the process of identification
of variabilities based on the Ziadi et al. approach as
Frame is essential for representing variants of a given
variation point. Variation points must not exist with
any associated variants. Therefore, in a practical way,
there is no support for such variability modeling in
current mentioned UML tools. Despite of such an is-
sue, the Ziadi et al. approach can be taken into con-
sideration in this study.
1
http://www.gentleware.com/.
2
http://www.nomagic.com/.
3
http://astah.net/.
ICEIS2014-16thInternationalConferenceonEnterpriseInformationSystems
250

2.3 The SMarty Approach
SMarty (OliveiraJr et al., 2010) is an approach for
UML Stereotype-based Management of Variability
in SPL. It is composed of an UML 2 profile, the SMar-
tyProfile, and a process, the SMartyProcess.
The SMartyProfile: contains a set of stereotypes
and tagged values to represent variability in SPL mod-
els. Basically, SMartyProfile uses a standard object-
oriented notation and its profiling mechanism, both to
provide an extension of UML and to allow graphical
representation of variability concepts. Thus, there is
no need to change the system design structure to com-
ply with the SPL approach.
The SMartyProcess: is a systematic process that
guides the user through the identification, delimita-
tion, representation, and tracing of variabilities in SPL
models. It is supported by a set of application guide-
lines as well as by the SMartyProfile to represent vari-
abilities.
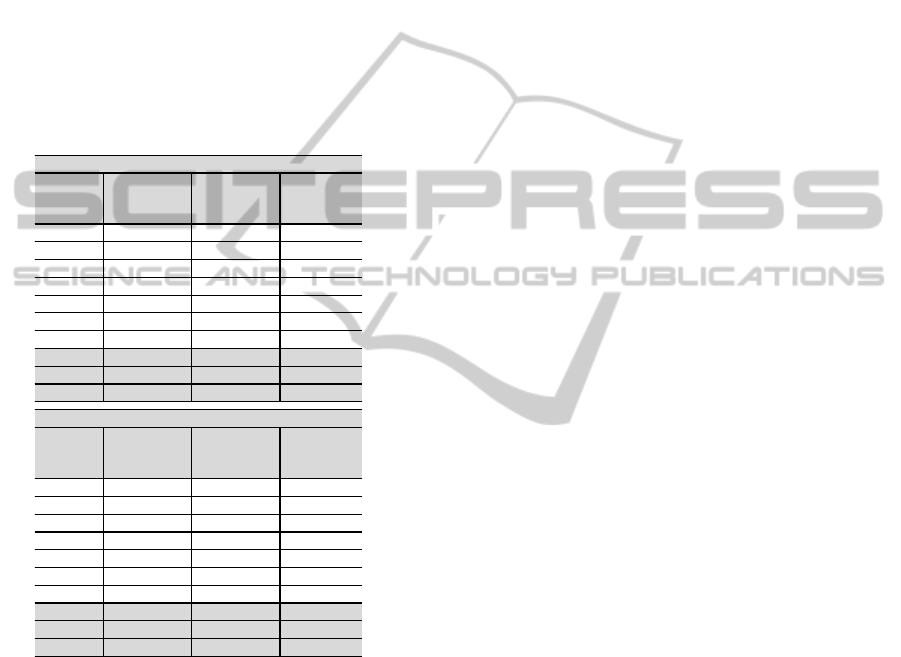
Table 1: SMarty and Ziadi et al. Approaches Support for
Sequence Diagrams.
SMarty
Ziadi et al.
þ þ
þ þ
þ ý
þ þ
þ þ
Optional
þ þ
Inclusive (OR)
þ ý
Exclusive
(XOR)
þ þ
þ ý
Complement
þ
OCL
Mutually
Exclusion
þ
OCL
þ ý
þ ý
þ ý
Legend:
þ
ý
Criterion
Approach supports the concept.
Approach does not support the concept.
Sequence Model
Approaches
Support UML Model
UML Profile
Guidelines for Identification and
Representation of Variability
Use UML Stereotypes
Explicit representation of
Variantion Point
Variability
Constraints
between
variants
Cardinality
Binding time delcaration
Addition of new variants
The SMartyProfile: comprises the follow-
ing stereotypes, which can be applied to UML
use case, class, component, activity, and re-
cent extension to sequence models, taking
into account the variability concepts of Sec-
tion 2.1: variability; mandatory,
optional, alternative OR an inclusive
variant; alternative XOR a mutually exclusive
variant; mutex mutually exclusion among
variants; and requires the presence of another
given variant.
Table 1 summarizes and compares the main fea-
tures of SMarty and Ziadi et al. approaches. Note that
the Ziadi approach does not support the representation
of inclusive variants as well as variabilities. Ziadi et
al. approach does not make it clean meta-attribute of
variabilities, such as, binding time and the addition of
new variants to a given variation point. These issues
might lead to inconsistent products derivation.
The well-known PLUS method (Gomaa, 2004)
was not taken into consideration as it does not sup-
port variability representation in sequence diagrams.
3 THE EXPERIMENTAL STUDY
This study is characterized as a quasi-experiment
(Wohlin et al., 2000) that relaxes the conditions im-
posed by probability distributions and statistical in-
ferences for the population. Therefore, we performed
the non-equivalent grouping method, considering that
the population distribution was not random (discussed
in Section 3.5).
3.1 Definition
The goal of the experiment was to compare the Ziadi
et al. and the SMarty approaches, for the purpose
of identify the most effectiveness, with respect to the
capability of identification and representation of vari-
abilities in Software Product Line sequence models,
from the point of view of software product line archi-
tects, in the context of master and Ph.D. students of
the Software Engineering area from the Federal Uni-
versity of Paran
´
a - UFPR and State University of Mar-
ing - UEM.
According to the GQM model, it was established
two research questions (R.Q.) for the study:
R.Q.1 Which methodology is more effective in iden-
tify and representing variabilities in SPL sequence
models?
R.Q.2 Does the prior subject SPL knowledge influ-
ence the application of the method/approach to
UML sequence models?
3.2 Planning
1. Local Context: a SPL for Banking Transactions,
proposed by Ziadi et al. (Ziadi and Jezequel,
2006) and a pedagogical SPL for Arcade Game
Maker, proposed by (SEI, 2012), were taken into
consideration to apply the Ziadi et al. and the
SMarty approaches aiming the representation of
variabilities in sequence models.
2. Training: subjects were trained with regard to
essential concepts of SPL and variability and se-
quence model variability identification and rep-
TowardstheEffectivenessoftheSMartyApproachforVariabilityManagementatSequenceDiagramLevel
251

resentation using Ziadi et al. UML Profile or
SMarty.
3. Pilot Project: a pilot project was performed for
evaluating the study instrumentation taking into
account two lecturers of software engineering.
Thus, adjustments on the instrumentation were
made based on the pilot project results.
4. Selection of Subjects: the subjects must be grad-
uate students, lecturers or practitioners of the
software engineering area with at least minimal
knowledge in modeling classes. In addition, af-
ter the training sessions, each subject must be fa-
miliar with the essential variability management
concepts (Section 2.1).
5. Instrumentation: every subject was giving the
following documents:
• the consent term to the experimental study;
• a characterization questionnaire, in which the
subjects must indicate their academic back-
ground, area of expertise and experience, their
level of experience with the UML notation and
the SPL approach; and
• the description of the Banking and Arcade
Game Maker SPLs and their sequence models
with no variabilities represented.
Subjects were separated into two groups, balanced
by their knowledge. One group focused on the
X approach (the Ziadi et al. approach) and one
group focused on the Y approach (the SMarty
approach). One group was trained to identify
and represent variabilities according to the X ap-
proach and the other group was trained to identify
and represent variabilities according to the Y ap-
proach.
6. Hypothesis Formulation: the following hypoth-
esis were tested in this study:
• Null Hypothesis (H
0
): both X and Y ap-
proaches are equally effective in terms of rep-
resenting variabilities in sequence models.
H
0
: µ(effectiveness(X)) = µ(effectiveness(Y));
• Alternative Hypothesis (H
1
): X approach is
less effective than Y approach.
H
1
: µ(effectiveness(X)) < µ(effectiveness(Y));
and
• Alternative Hypothesis (H
2
): X approach is
more effective than Y approach.
H
2
: µ(effectiveness(X)) > µ(effectiveness(Y)).
7. Dependent Variables: the effectiveness calcu-
lated for each variability management approach
(X and Y) as follows:
effectiveness(z) =
(
nVarC, if nVarI = 0
nVarC −nVarI, if nVarI > 0
where:
• z is the variability management approach
• nVarC is the number of correct identified vari-
abilities elements according to the z approach
• nVarI is the number of incorrect identified vari-
abilities elements according to the z approach
A variability element might be either a variation
point or a variant.
8. Independent Variables: the variability manage-
ment approach, which is a factor with two treat-
ments (X and Y) and the SPL, which is a factor
with two treatments: Banking and Arcade Game
Maker.
9. Qualitative Analysis: aims to evaluate the re-
sults obtained in this study with respect to the re-
sults obtained by means of descriptive statistical
analysis, based on the effectiveness obtained from
the resolution of the sequence variability model
by each subject, according to the X and Y ap-
proaches.
10. Random Capacity: the selection of the subjects
was not random within the universe of the volun-
teers which was quite restricted. The random ca-
pacity took place at the assignment of the variabil-
ity management approach (X or Y) to each sub-
ject.
11. Block Classification: because the application of
two different approaches to represent variability
in class models, it was performed the random
sampling, where the population was divided into
two blocks, one for the X approach and one for
the Y approach, with level of knowledge balanced
by the characterization questionnaire.
12. Balancing: tasks were assigned in equal numbers
to a similar number of subjects.
13. Review Mechanism: for reviewing the study
analysis it was used the calculation of the effec-
tiveness for each treatment.
3.3 Execution
1. Selection of Subjects: a total of 14 masters and
Ph.D. students of the Software Engineering area
were selected for this study.
2. Instrumentation: the main assessment tools
were the Banking and Arcade Game Maker se-
ICEIS2014-16thInternationalConferenceonEnterpriseInformationSystems
252
quence models with variabilities represented ac-
cording to the X and Y approaches. Both, the
Banking and Arcade Game Maker sequence mod-
els, were distributed and ordered in equal numbers
and, randomly. The subjects were warned to not
change the order of SPLs and their respective res-
olutions.
The main task for each subject was reading and
understanding the Banking and Arcade Game
Maker SPLs overviews. Then, the subjects an-
notated variabilities in the Banking and Arcade
Game Maker sequence models.
Table 2: Banking and AGM SPLs Collected Data and De-
scriptive Statistics: X (Ziadi et al.) and Y (SMarty) Ap-
proaches.
Subject #
Correct
Identified
Variabilities
Incorrect
Identified
Variabilities
Effectiveness
Calculation
1 19.0 13.0 6.0
2 19.0 9.0 10.0
3 4.0 28.0 -24.0
4 31.0 1.0 30.0
5 23.0 9.0 14.0
6 28.0 4.0 24.0
7 16.0 16.0 0.0
Mean 20.0 11.4 8.6
Std. Dev. 8.2 8.2 16.3
Median 19.0 9.0 10.0
Subject #
Correct
Identified
Variabilities
Incorrect
Identified
Variabilities
Effectiveness
Calculation
1 29.0 3.0 26.0
2 32.0 0.0 32.0
3 32.0 0.0 32.0
4 32.0 0.0 32.0
5 29.0 3.0 26.0
6 32.0 0.0 32.0
7 13.0 19.0 -6.0
Mean 28.4 3.6 24.9
Std. Dev. 6.4 6.4 12.9
Median 32.0 0.0 32.0
The Y Approach (Smarty)
The X Approach (Ziadi et al.)
3. Participation Procedure: standard procedures
were adopted for each subject participation, which
are:
(a) the subject came along the place where the
study was conducted;
(b) the experimenter gives the subject a set of doc-
uments:
• the experimental study consent term;
• the characterization questionnaire;
• essential concepts on variability management
in SPL;
• the description of the Banking and Arcade
Game Maker SPLs; and
• the description of main graphical elements
and paths from UML sequence models.
(c) the subject reads each given document;
(d) the experimenter explains the given documents;
(e) the experimenter randomly associates each sub-
ject to the X or Y approach;
(f) the experimenter trains the subjects on the re-
spective approach;
(g) the subject reads and clarifies possible doubts
about the subject assigned approach; and
(h) the subject identifies and represents variabili-
ties in the Banking and Arcade Game Maker
sequence models according to his/her given ap-
proach.
4. Execution: collected data is presented in Table
2 and analyzed using appropriate statistical meth-
ods, which are properly discussed in Section 3.4.
For each subject (“Subject #” column), it was
collected the following data for his/her given ap-
proach: the number of correct and incorrect iden-
tified and represented variabilities; and the effec-
tiveness calculation.
3.4 Analysis and Interpretation
Based on the results obtained by analyzing the ap-
plication of the X and Y approaches to the Banking
and Arcade Game Maker SPLs, the following steps
were taken for answering the study research questions
(Section 3.1):
• analyze and interpret the X and Y collected data
(sample) by means of the Shapiro-Wilk normal-
ity test and the T Test, to validate their statistical
power; and
• analyze and interpret the correlation between
the effectiveness of the approaches and the
subjects characterization questionnaire by means
of Shapiro-Wilk normality tests and the Pearson’s
ranking correlation techniques.
3.4.1 Effectiveness of the Approaches (R.Q.1)
• Collected Data Normality Tests: the Shapiro-
Wilk normality test was applied to the Banking
and Arcade Game Maker samples (Table 2)
providing the following results:
The X approach (N=7):
Banking SPL Effectiveness: mean value (µ) 2.71,
standard deviation value of (σ) 3.9175, the effec-
tiveness for the X approach for the Banking SPL
TowardstheEffectivenessoftheSMartyApproachforVariabilityManagementatSequenceDiagramLevel
253

was p = 0.1333 for the Shapiro-Wilk normality
test.
In the Shapiro-Wilk test for a sample size (N) 7
with 95% of significance level (α = 0.05), p =
0.1333 (0.1333 > 0.05) and calculated value of W
= 0.8538 > W = 0.8030, the sample is considered
normal.
Arcade Game Maker SPL Effectiveness: mean
value (µ) 5.85, standard deviation value (σ)
14.4956, the effectiveness for the X approach for
the Arcade Game Maker SPL was p = 0.4813 for
the Shapiro-Wilk test.
In the Shapiro-Wilk test, for (α = 0.05), p = 0.4813
(0.4813 > 0.05) and calculated value W = 0.9215
> W = 0.8030, the sample is considered non-
normal.
Total Effectiveness: mean value (µ) 8.57, standard
deviation value of (σ) 16.3432, the total effec-
tiveness for X approach was p = 0.9456 for the
Shapiro-Wilk test.
Finally, for (α = 0.05), p = 0.9456 (0.9456 >
0.05) and calculated value of W = 0.9456 < W =
0.8030, the sample is considered normal.
The Y Approach (N=7):
Banking SPL Effectiveness: mean (µ) 4.71, stan-
dard deviation of (σ) 3.1036, the effectiveness for
the Y approach for the Banking SPL was p =
0.0111 for the Shapiro-Wilk test.
In the Shapiro-Wilk test, for a sample size of 7
with 95% of significance level (α = 0.05), p =
0.0111 (0.0111 < 0.05) and calculated value W
= 0.7444 > W = 0.8030, the sample is considered
non-normal.
Arcade Game Maker SPL Effectiveness: mean (µ)
20.14, standard deviation value of (σ) 10.3568,
the effectiveness for the Y approach for Ar-
cade Game Maker SPL was p = 0.00003 for the
Shapiro-Wilk test.
In the Shapiro-Wilk test, for (α = 0.05), p =
0.00003 (0.00003 < 0.05) and calculated value of
W = 0.5276 > W = 0.8030, the sample is consid-
ered normal.
Total Effectiveness: mean (µ) 24.8, standard devi-
ation (σ) 12.8666, the total effectiveness for the
Y approach was p = 0.0002 for the Shapiro-Wilk
test.
Finally, for (α = 0.05), p = 0.0002 (0.0002 > 0.05)
and calculated value W = 0.5988 > W = 0.8030,
the sample is considered normal.
• T-test: this kind of test can be applied for both
independent and paired samples (Wohlin et al.,
2000). In the case of this study, Sample X and
Sample Y are independent. As each sample size
is less than 30 and both samples are normal, it was
defined the following hypothesis:
– Null Hypothesis (H
0
): approach X has the
same effectiveness of approach Y.
H
0
: µ(effectiveness(X)) - µ(effectiveness(Y)) =
0;
– Alternative Hypothesis (H
1
): approach Y is
more effective than approach X.
H
1
: µ(effectiveness(Y)) - µ(effectiveness(X)) >
0.
First we obtained the value of T, which allows the
identification of the range entered in the statistical
table t (student). This value is calculated using
the average of Sample Y (µ1 = 8.5714) and Sam-
ple X (µ2 = 24.8571), standard deviation value of
both (σ1 = 16.3432 and σ2 = 12.8666), and the
sample sizes (N = 7). It was obtained the value
t
calculated
= 8.4014.
By taking the sample size (N = 7), we obtained the
degree of freedom (df ), which combined to the t
value indicates which value of p in the t table must
be selected. The p value is used to accept or reject
the T-test null hypothesis (H
0
).
By searching the index d f = 12 and defining the
value t at the t table (student), was found a value
for critial t of 2.1790 (t
critial
= 2.1790), with a
significance level (α) of 0.05. Thus, comparing
the t
critial
with the t
calculated
the null hypothesis
H
0
must be rejected and (H
1
) must be accepted
(t
calculated
(8.4014) >= t
critial
(2.1790)).
Therefore, based on the result from the T test, the
null hypothesis (H
0
) of this experimental study
(Section 3.2) must be rejected and the alternative
hypothesis must be accepted. It means that the
Y approach (SMarty Approach) is more effective
than the X approach (Ziadi et al. Approach) for
representing variability at SPL sequence level for
this experimental study.
3.4.2 Correlation Between the Approaches
Effectiveness and the Subjects Variability
Characterization (R.Q.2)
• Knowledge Level in SPL for Subjects from X
Approach: sample size of (N) 7, with mean (µ)
2.5, standard deviation value of (σ) 0.9574, the
knowledge level of subjects was p = 0.4817 for
the Shapiro-Wilk test.
In the Shapiro-Wilk, for a sample size of 7 with
95% of significance level (α = 0.05), p = 0.4817
(0.4817 > 0.05) and calculated value W = 0.9215
ICEIS2014-16thInternationalConferenceonEnterpriseInformationSystems
254
less than W = 0.8030 the sample is considered
normal.
• Knowledge Level in SPL for subjects from Y
Approach: sample size of (N) 7, with mean
value (µ) 4.5, standard deviation of (σ) 0.5000, the
knowledge level p = 0.4817 for the Shapiro-Wilk
test.
In this Shapiro-Wilk test, for a sample size of 7
with 95% of significance level (α = 0.05), for
the Y approach, p = 0.4817 (0.4817 < 0.05) and
calculated value W = 0.9215 greater than W =
0.8030, the sample is considered normal.
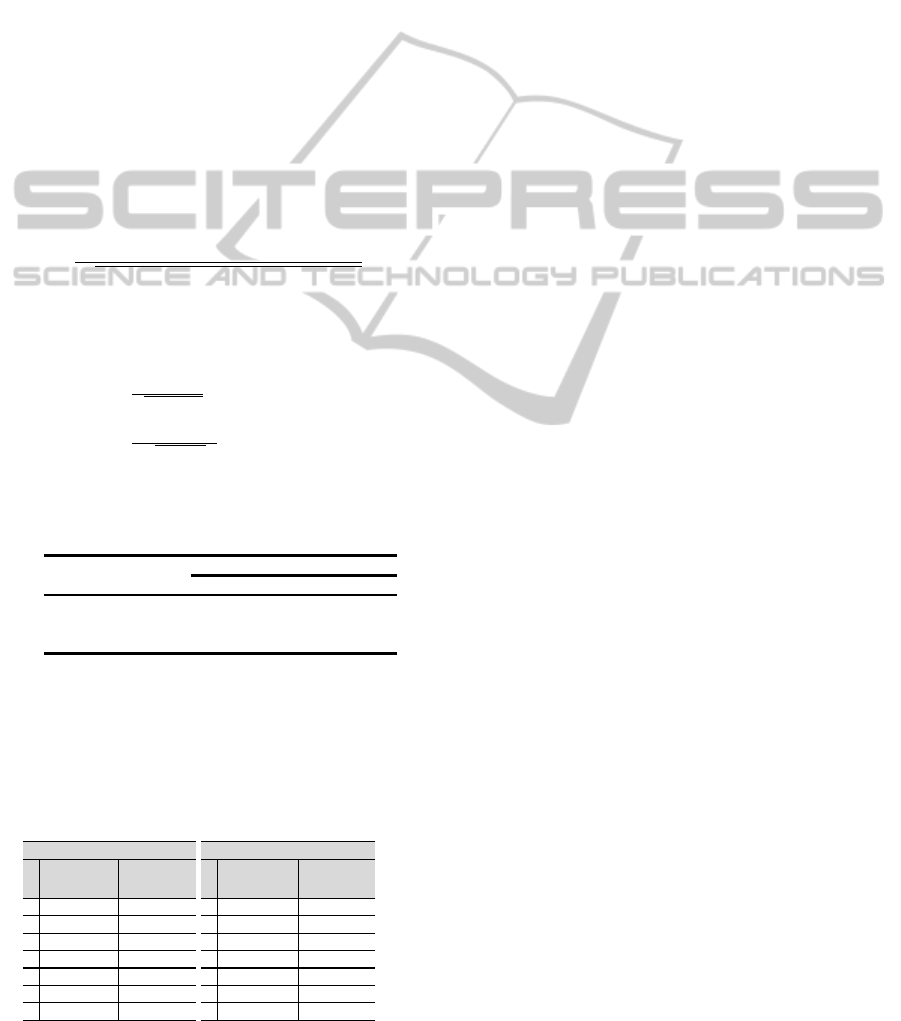
• Pearson’s Correlation: this technique was ap-
plied to identify whether there is a correlation be-
tween the effectiveness of each approach (X and
Y) and the level of knowledge of the subjects, for
parametric values. The values from Table 1 were
applied on the equation 1 that shows the formula
to calculate the Pearson’s ρ correlation.
r =
n(Σab) −(Σa)(Σb)
p
[n(Σa
2
) −(Σa)
2
][n(Σb
2
) −(Σb)
2
]
(1)
The calculation for each correlation, according to
the approach and SPLs is shown in Equations 2,
3.
r(Corr.1) =
994−60∗16
√
13088∗52
= 0.0412
o
(2)
r(Corr.2) =
4774−174∗26
√
8112∗52
= 0.3849
o
(3)
Thus, it was obtained the following values for r
as well as the classification scale by Pearson and
(Higgins and Ed.D., 2005) shown in Figure 1:
Strength of Association Positive Negative
Weak 0.1 to 0.29 -0.1 to -0.29
Moderate 0.3 to 0.49 -0.3 to -0.49
Strong 0.5 to 1.0 -0.5 to -1.0
Coefficient, r
Figure 1: Pearson’s Correlation Scale.
– Result correlation for X and Knowledge Level
in SPL: r = 0.0412 - Weak positive relation-
ship;
Table 3: Pearson’s correlation for knowledge level of sub-
jects for the X and Y approaches.
# Effectiveness
Knowledge
Level in SPL
# Effectiveness
Knowledge
Level in SPL
1
6 1
1 26
4
2
10 1
2 32
5
3
-24 2
3 32
4
4
30 2
4 32
5
5
14 3
5 26
2
6
24 3
6 32
3
7
0 4
7 -6
3
The X Approach (Ziadi et al.)
The Y Approach (SMarty)
– Result correlation for Y and Knowledge Level
in SPL: r = 0.3849 - Moderate positive rela-
tionship.
Analyzing the results obtained by means of the
Pearson correlation, it was observed that, for the
X approach the knowledge level in SPL of each
subject there is a weak positive relationship, and
for the Y approach, there is a moderate positive
relationship. It means that the greater the value
for the correlation, the greater is the influence of
the previous knowledge on SPL and variability
to the application of a given approach. There-
fore, SMarty was more influenced by its subjects
knowledge level than Ziadi et al.
3.5 Validity Evaluation
• Threats to Conclusion Validity: the major con-
cern is the sample size, which must be increased
in prospective studies.
• Threats to Construct Validity: effectiveness is
calculated based on the ability of the subjects in
modeling variability by taking into consideration
the X and Y approaches and the Banking and Ar-
cade Game Maker SPLs. The independent vari-
able variability modeling approach is guar-
anteed by the pilot project undertaken.
• Threats to Internal Validity: we dealt with the
following issues: Differences among subjects -
as we took into consideration a small sample, vari-
ations in the subject skills were reduced by per-
forming a training session and the tasks in the
same order. The subjects experience had approx-
imately the same level for UML modeling and
variability concepts; Fatigue effects - on aver-
age, the experiment lasted for 20 minutes, thus fa-
tigue was considered not relevant; and Influence
among subjects - it could not be really controlled.
Subjects took the experiment under supervision of
a human observer. We believe that this issue did
not affect the internal validity.
• Threats to External Validity: two threats were
detected: Instrumentation - failing to use real
sequence models, as the Baking and the Arcade
Game Maker SPLs are not commercial. More ex-
perimental studies must be conducted using real
SPLs, developed by industry; and Subjects - mas-
ters and Ph.D. students of Software Engineering
were selected. However, more experiments taking
into account industry practitioners must be con-
ducted, allowing to generalizing the study results.
TowardstheEffectivenessoftheSMartyApproachforVariabilityManagementatSequenceDiagramLevel
255

4 CONCLUSION AND FUTURE
WORK
Industry needs that the scientific community test ex-
isting and new technologies, such as SMarty, identi-
fying their effectiveness in order to provide evidence
of such new technologies effectiveness allowing them
to be adopted by companies. Such evidence is essen-
tial for technology transferring, as well as for return
on investment.
The experimental study presented in this paper
demonstrates the ability to use variability manage-
ment approaches. Their effectiveness was analyzed
in order to provide a means to companies on select-
ing the most appropriate for variability management
of UML-based SPLs. The experimental study allows
analyzing the effectiveness of the SMarty and Ziadi
et al. treatments for modeling variability in sequence
diagram models. Two SPLs were set as independent
variables: a SPL for banking and the SEI AGM SPL.
The Shapiro-Wilk normality test was applied to the
samples, collected by the effectiveness formula. Both
samples were considered normal, thus it was applied
the parametric T-test. This test analyzed the effective-
ness of the Ziadi et al. and the SMarty approaches.
Then, the correlation of the subjects’ level of knowl-
edge in SPL and variability was performed based on
the Pearson technique, which shown that knowledge
had a moderate influence on the application of the
SMarty approach and a weak influence on the appli-
cation of the Ziadi et al. approach.
The obtained results provided evidence of the
SMarty effectiveness for modeling variability in UML
sequence models, taking into account the Banking
and the AGM SPLs.
This paper is limited with regard to: (i) the re-
duced sample size, which is a major issue in ex-
perimental software engineering (Kitchenham et al.,
2013); and (ii) the lack of real SPLs and industry prac-
titioners for participating in the study conduction.
New experimental studies and replications must
be planned and conducted to make it possible to
reduce the threats, increasing the effectiveness of
SMarty and generalizing the results. As new exper-
iments, we are: (i) planning a replication of this study
to corroborating the obtained results; (ii) planning an
experiment for effectiveness analysis of SMarty for
sequence models using real SPLs and practitioners
from industry; (iii) planning an external replication
which will be conducted by a different experiment
team in order to corroborate the obtained results.
REFERENCES
Capilla, R., Bosch, J., and Kang, K.-C. (2013). Systems and
Software Variability Management - Concepts, Tools
and Experiences. Springer, New York, NY, USA.
Chen, L., Ali Babar, M., and Ali, N. (2009). Variability
management in software product lines: a systematic
review. In Proceedings of the 13th International Soft-
ware Product Line Conference, SPLC ’09, pages 81–
90, Pittsburgh, PA, USA. Carnegie Mellon University.
Fiori, D. R., Gimenes, I. M. d. S., Maldonado, J. C., and
OliveiraJr, E. A. (2012). Variability Management in
Software Product Line Activity Diagrams. In: Inter-
national Conference on Distributed Multimedia Sys-
tems. Proceedings of the International Conference on
Distributed Multimedia Systems, Skokie, IL: Knowl-
edge Systems Graduate School., v. 1:89–94.
Gomaa, H. (2004). Designing Software Product Lines with
UML: From Use Cases to Pattern-Based Software Ar-
chitectures. Addison Wesley Longman Publishing
Co., Inc., Redwood City, CA, USA.
Higgins, J. and Ed.D. (2005). The Radical Statistician. The
Management Advantage, Inc.
Kitchenham, B., Sjoberg, D. I. K., Dyba, T., Brereton, O. P.,
Budgen, D., Host, M., and Runeson, P. (2013). Trends
in the Quality of Human-Centric Software Engineer-
ing Experiments - A Quasi-Experiment. IEEE Trans-
actions on Software Engineering, 39:1002–1017.
Marcolino, A., OliveiraJr, E. A., Gimenes, I. M. S., and
Maldonado, J. C. (2013). Towards the Effective-
ness of a Variability Management Approach at Use
Case Level. Proceedings of International Conference
on Software Engineering & Knowledge Engineering,
(aceito para publicac¸
˜
ao).
OliveiraJr, E. A., Gimenes, I. M. S., and Maldonado, J. C.
(2010). Systematic Management of Variability in
UML-based Software Product Lines. Journal of Uni-
versal Computer Science, 16(17):2374–2393.
Pohl, K., Bockle, G., and Linden, F. (2005). Software Prod-
uct Line Engineering Foundations, Principle, and
Techniques. Secaucus, NJ, USA: Springer-Verlag.
SEI (2012). Software engineering institute - A Framework
for Software Product Line Practice - Version 5.0.
Wohlin, C., Runeson, P., H
¨
ost, M., Ohlsson, M. C., Reg-
nell, B., and Wessl
´
en, A. (2000). Experimentation in
Software Engineering: an Introduction. Kluwer Aca-
demic Publishers, Norwell, MA, USA.
Ziadi, T., Helouet, L., and Jezequel, J. M. (2003). To-
wards a UML Profile for Software Product Lines. In
In Software Product-Family Engineering, pages 129–
139. Springer.
Ziadi, T. and Jezequel, J.-M. (2006). Software product line
engineering with the uml: Deriving products. In Kkla,
T. and Duenas, J., editors, Software Product Lines,
pages 557–588. Springer Berlin Heidelberg.
ICEIS2014-16thInternationalConferenceonEnterpriseInformationSystems
256
