
Visualization and Off-line Processing of Blood Pressure Signals
Anik
´
o V
´
agner, B
´
ela V
´
amosi and Istv
´
an Juh
´
asz
Faculty of Informatics, University of Debrecen, Kassai u. 26, Debrecen, Hungary
Keywords:
Blood Pressure Measurement, Visualization, Signal Processing, Validation of Algorithm.
Abstract:
In the public health care it is very common that microcontroller calculates the result of oscillometric blood
pressure measurements. In this case the result can be imprecise; it does not inform the patient and the doctor
accordingly. The recordings collected by the microcontroller can be sent to an application which runs on a
PC. The recording can contain only one measurement or sequence of measurements created during 24 hours.
The advantage of the PC side application is that it can use more memory and processor capacity, so it is faster
and more precise. The task of the application is to calculate and visualize the values of blood pressure. The
application determines the values of the blood pressure based on an oscillometric blood pressure algorithm.
The application visualizes the result of each step of the algorithm. The algorithm decides whether the result is
acceptable and authentic based on the characteristic of the recording. The other part of the application helps in
the validation. It executes the algorithm on mass of the recordings which have result of reference measurement.
The application shows the differences between the results of the algorithm and the values of reference. The
application helps to qualify the algorithm according to the international standards. The application works well
under laboratory circumstances. But application needs further validation so that it can be put to the market.
1 INTRODUCTION
Nowadays the blood pressure measurement is one of
the most common techniques to characterize the con-
dition of the patient. The blood pressure measurement
helps to diagnose the hypertension and the hypoten-
sion. The examination and treatment of the deviation
can discover or prevent diseases like stroke, heart at-
tacks, heart failure, aneurysms of the arteries, periph-
eral arterial disease, chronic kidney disease, hormonal
changes, anemia, endocrine problems, etc. The values
of the blood pressure during an operation reflect the
status of the patient. The blood pressure can be mea-
sured in many ways. There are two main groups of the
methods: the invasive and the non-invasive. The inva-
sive techniques are complicated to use, so the general
public uses the non-invasive techniques. The main
common methods are the auscultatory and the oscil-
lometric. Both of them are suitable to measure blood
pressure easily, painlessly without any risk under do-
mestic circumstances.
In this article we use only an oscillometric
method. In the next sections we describe an appli-
cation of the Cardiospy of Labtech Ltd, Hungary.
The Cardiospy system is built above all for cardiol-
ogists, and medical scientists; it is used by many hos-
pitals in Hungary and other countries. The system is
very simple and user friendly. It has many functions
which help recognize and manage the cardiovascu-
lar illnesses (Labtech, 2013). Blood pressure module
named BP Service visualizes the result of the steps of
an oscillometric method. The next sections describe
the used method, and the visualization of each step.
In the last section we describe an application which
makes the validation easier.
2 OSCILLOMETRIC METHOD
In the case of the oscillomteric method, there is a sen-
sor built in the cuff. The sensor perceives the pressure
of the artery and the cuff. After we remove the pres-
sure values caused by the deflation of the cuff we get
an oscillation waveform, the oscillogram. First the
changes of the pressure on the waveform increase,
then decrease. The oscillometric method calculates
the value of the systole (SP), the diastole (DP) and the
mean arterial pressure (MAP) based on the changes
of the pressure on the oscillogram (Ball-llovera et al.,
2003) (Wang et al., 2002) (Lin, 2007).
Figure 1 shows an example of the cuff pressure
curve and the corresponding oscillometric waveform.
393
Vágner A., Vámosi B. and Juhász I..
Visualization and Off-line Processing of Blood Pressure Signals.
DOI: 10.5220/0004892603930398
In Proceedings of the International Conference on Health Informatics (HEALTHINF-2014), pages 393-398
ISBN: 978-989-758-010-9
Copyright
c
2014 SCITEPRESS (Science and Technology Publications, Lda.)

Figure 1: Cuff pressure signal and oscillation waveform
(Lin et al., 2003), (Lin, 2007).
The values of blood pressure can be determined
based on the cuff press curve at a given point. The
method determines the point of the systole, the dias-
tole and the mean arterial pressure. The point of the
mean arterial pressure is the maximum point of the os-
cillogram. There are two algorithms to determine the
point of the systole and the diastole: the height-based
method and the slope-based. The slope-based method
fits a curve to the changes of cuff pressure. The
method specifies the inflection point of the curve as
the points of systole and diastole (Ball-llovera et al.,
2003) (Sapinski, b) (Lin, 2007). The height-based al-
gorithm has two previously given ratios, one of them
for the systole, the other for the diastole. The two ra-
tios are not necessarily the same. The pressure change
at the point of mean arterial pressure is 100%. The
method finds the point where the pressure change cor-
responds to the given ratio. The point of systole is be-
fore the mean arterial pressure, the diastole is after it
(Ball-llovera et al., 2003) (Lin et al., 2003) (Lee et al.,
2001) (Lin, 2007).
The values of the ratio are not exactly determined.
It depends on the realization of the oscillometric al-
gorithm. Most researchers take these values between
40% and 60% (Ball-llovera et al., 2003) (Lin, 2007)
(Sapinski, a)(Geddes, 1991).
The oscillometric method is realized in many
ways, like prediction and smoothing algorithm, fuzzy
logic, neural network, pattern recognition, mathe-
matical modelling, etc (Lin, 2007). We based our
method on the oscillometric method of Aboy (Aboy,
2011). The main difference between the article and
our method is that we fit one polynomial instead of
two wrapping curves. The polynomial curve is used
by Zheng (Zheng et al., 2011).
3 THE MAIN STEPS OF OUR
OSCILLOMETRIC METHOD
The input data is an oscillometric recording which
is created by a microcontroller during blood pres-
sure measurements. It is an C8051F064 mixed-signal
MCUs of Silicon Laboratories. It is a reliable high-
speed 8051 architecture MCU with two 16-bit ADCs.
It has 64kB Flash memory which is in-system pro-
grammable in 1kB sectors and it has 4kB data RAM.
The recorded data is stored on the micro SD card.
During a measurement the deflation of the cuff
pressure is continuous. One recording can contain
only one measurement or sequence of measurements
created during 24 hours.
1. The algorithm splits the recording into measure-
ments. It processes only one measurement at a
time.
2. It finds the beginning of the deflation. It processes
the part of the measurement after the deflation.
3. The algorithm creates an oscillogram based on the
measurement using a band-pass filter.
4. The algorithm finds the local minimum and max-
imum points and values.
5. It creates a histogram from the local extrema. The
histogram shows the change of the cuff pressure
at a minimum point.
6. The algorithm fits a wrapping curve which is a
polynomial to the histogram.
7. It determines the SP and the DP both height-based
and slope-based.
8. Based on the character of the measurement it
gives information whether the result is acceptable
or not. In the result of the algorithm there is a sign
which shows that the blood pressure values are ac-
ceptable, not acceptable, or they can be accepted
only after manual analyzing.
4 BP SERVICE VISUALIZATION
INTERFACE
The BP Service realizes a unified, structured, and in-
teractive data visualization. The user can turn various
data elements on and off using controls. If a control
is set the surface is drawn again in an interactive way.
The BP Service uses the results and the data of other
modules of the Cardiospy system (e.g.: ECG, auscul-
tation blood pressure). On the surface they appear,
but they are not relevant to the topic of the article. We
use colors on the surface to distinguish the curves, the
HEALTHINF2014-InternationalConferenceonHealthInformatics
394
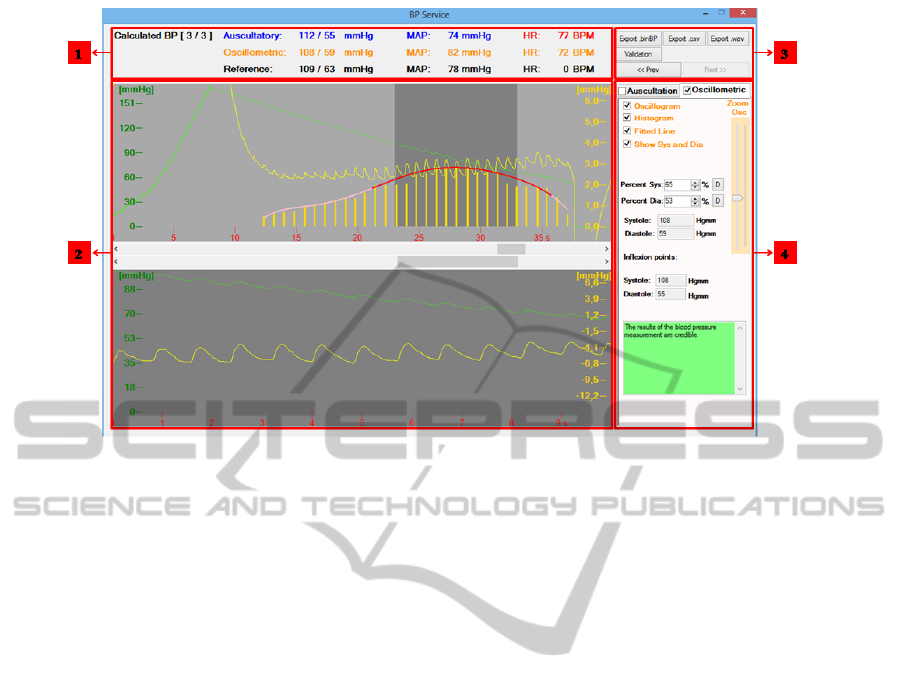
Figure 2: The parts of the visualization interface.
lines, and other information. E.g. the curve of the cuff
press is green, the oscillogram is yellow. The visual-
ization surface can be divided into 4 main parts based
on functions. (Figure 2) These are: 1. the panel for
displaying the results, 2. the canvas, 3. the buttons, 4.
the oscillometric control page.
4.1 The Panel for Displaying the Results
The panel displays the results of the blood pressure
measurement. After the label of Calculated BP there
is the serial number of the actual measurement of
the recording and the number of the measurements
in the recording. There are three rows which show
the blood pressure values. The first blue row shows
the results of the auscultatory results, the second yel-
low one shows the oscillometric results, and the third
black one shows the manual reference values. All the
three rows contain the SP, the DP, the MAP and the
heart rate. If the item of recording has no reference
values the third black row contains 0 values.
4.2 The Canvas
This unit visualizes the data. There are two panels.
The upper panel displays the data of the whole mea-
surement from the beginning of the inflation of the
cuff to the end of the deflation. The lower panel gives
an enlarged picture of gray stripe of the upper panel.
There are two scrollbars between the two panels. If
the upper scrollbar is changed, the picture jumps to
the next or the previous measurement of the record-
ing. If the lower scrollbar is scrolled the gray stripe
moves, so the user can navigate in the measurement
to analyze the parts of the curves.
The canvas visualizes the data of each step of the
blood pressure algorithm. These data are the next:
• Cuff pressure: The waveform of it is drawn by
green color on both panels of the canvas.
• Oscillogram: it is drawn by yellow color on both
panels of the canvas.
• Histogram: It is drawn by orange only on the up-
per panel of the canvas. The point of each item of
the histogram is accurate at the point of the local
minimum of the oscillogram. The height of each
item of the histogram shows the size of the press
change.
• Wrapping curve: It is drawn by pink on the upper
panel of the canvas. The wrapping curve is a poly-
nomial, which fits to the points of the histogram.
• SP and DP: The systole and the diastole are visu-
alized by red. The systole is represented by the
beginning point of the red part on the wrapping
curve. The diastole is represented by the end of
the red part. The algorithm calculates the SP and
DP in both ways: height-based and slope-based.
Our algorithm works better with the height-based
method. So the application visualizes the height-
based results.
On the two panels of the canvas there are scales.
On the right side of the upper panel there is a yellow
scale which belongs to the histogram. It has six grades
with equal distances. On the right side of the lower
panel there is an orange scale which belongs to the
VisualizationandOff-lineProcessingofBloodPressureSignals
395
oscillogram with eight grades. On the left side of both
panels there is a green scale, which belongs to the cuff
press with six grades. The scales help the user to read
the values of the cuff press, the oscillogram and the
histogram. The units of the scales is mmHg. The
scales are static, because the grades are fixed. The
scales are dynamic, because the values of them are
counted based on the values of each object.
The surface is interactive. This means, if the user
changes something on the surface, the results are in-
termediately shown. If the user changes the zoom of
the canvas with the Track Bar on the Control Page,
the curve of the cuff press, the oscillogram, the his-
togram are dynamically redrawn and the values of the
grads on the scales are also recounted. If the ratio of
the height-based method changes, the SP and DP are
recounted and the red part of the wrapping curve also
changes.
In the point of the mouse there is a rectangle on
the canvas. In the rectangle there is information about
that point. This information is the cuff pressure, the
time passed from the beginning of the inflation and
the height of the oscillogram. If the mouse moves the
values are recalculated.
On the canvas there is a red vertical line. It shows
the exact place of the mouse horizontally. If the
user moves the mouse the red line goes together with
it. The line helps the user to find the points of the
cuff press, the oscillogram and the histogram are con-
nected together. The user can examine the connection
of the three objects.
4.3 The Buttons
The user can navigate to the previous and the next
measurement in the recording with the ”Prev” and the
”Next” labeled buttons. The ”Validation” button exe-
cutes the validation application.
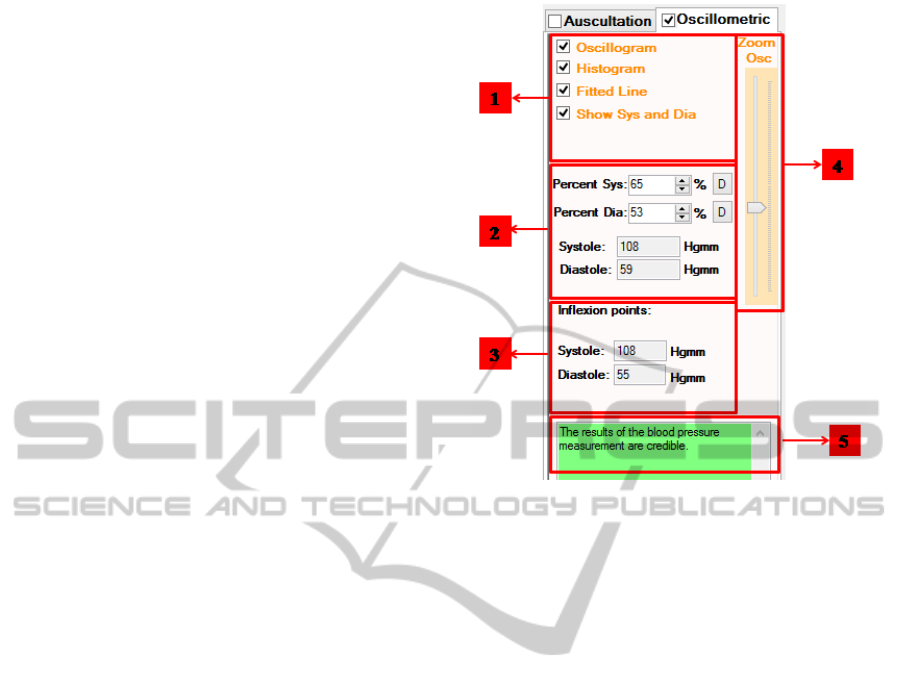
4.4 The Oscillometric Control Page
On this page the user can control the visualization of
data of the oscillometric algorithm. The Oscillometric
named Control Page is divided into five main parts as
Figure 3 shows.
1. With four Check Boxes the user can turn the
curves on the canvas off or on. Each Check
Box represents the oscillogram, the histogram, the
wrapping curve and the red part of the wrapping
curve representing the systole and the diastole.
2. The part of the Control Page shown by number 2
connects to the height-based method. There are
two Spinners, which show ratios of the height-
based method. If the user changes these values
Figure 3: Oscillometric Control Page.
the SP and the DP are refreshed. The range of the
Spinners is 0..100. There are two Buttons next to
the Spinners which restore the default ratios. In
the two Text Boxes there are the SP and the DP
calculated by the height-based method.
3. This part shows blood pressure result of the slope-
based method.
4. If the user changes the Track Bar the curves on the
canvas are vertically enlarged or diminished.
5. The green panel gives information to the user
about the results of the process of acceptability
and the authenticity.
4.5 Acceptability and Authenticity of
the Results
The algorithm gives information about the recording.
If the recording is very noisy the algorithm recognizes
it. In this case the algorithm may give results, but it
can be useless and not authentic information. If the
algorithm decides that the recording is very noisy the
application shows a white, empty text on the Control
Page, the SP and the DP are 0, and there is a big red
sign in the right upper corner on the surface which
warns the user that the recording is ”INVALID”.
The measurement of the recording can be incom-
plete because the microcontroller has finished the
recording earlier. In this case the algorithm tries to
give results. If there is not enough data in the mea-
surement a big red flash sign appears in the right upper
HEALTHINF2014-InternationalConferenceonHealthInformatics
396

corner on the surface which shows that the measure-
ment is a ”BAD RECORDING”.
If the algorithm gives results, it may be unbeliev-
able. Lackovic (Lackovic, 2003) says the systole has
to be in the range 50 and 280 mmHg, the diastole in
the range 40 and 140 mmHg. The difference between
them has to be at least 10 mmHg. If the result sat-
isfies the previous condition on the Control Page the
green panel gives information about it. If the result is
near the limitation of the conditions or the wrapping
curve is very different from the ideal on the Control
Page the yellow panel informs the user that the result
is questionable. If the result does not satisfy the con-
ditions the red panel appears and informs the user that
the result is not acceptable.
5 VALIDATION
In order that the BP Service application can be put to
the market, the algorithm of it has to satisfy the in-
ternational standards. The standards specify on what
kind of and how many recordings the algorithm has
to be executed. The results of the algorithm have to
be compared to the reference values. The validation
has to be performed on the mass of recordings. The
results have to be analyzed on statistically. The stan-
dard specifies the acceptable statistical indexes.
If the user clicks on the ”Validation” button in the
BP Service the validation application are executed.
The validation application is built to support the sta-
tistical analysis based on the standards of the British
Hypertension Society (BHS) (O’Brien et al., 1993)
(Kobalava et al., ) and the European Society of Hy-
pertension (ESH) (O’Brien et al., 2010).
The application can work not only with one mea-
surement, but mass of the measurements of record-
ings, too. The application executes the blood pressure
measurement application on each measurement. The
results can be analyzed by statistical tools. The vali-
dation application is ready to analyze the algorithm of
the microcontroller.
The application builds tables to examine whether
the algorithm satisfies the requirements of the stan-
dards. On Figure 4 there is the statistics window of
the validation application.
There are the Bland-Altman plots on the other tab
of the validation application. These plots are built to
analyze the difference between the results of an al-
gorithm and the reference values. (Bland and Alt-
man, 1986) (Bland and Altman, 1999) Many arti-
cles use the Bland-Altman plot (Myers, 2010) (Aboy,
2011)(Lin, 2007). The application creates Bland -
Altman plots for both the systole and the diastole. On
the surface there is a drop-down menu, where the user
can choose which values he wants to analyze, the sys-
tole or the diastole.
In the validation application the user can change
the parameters of the height-based algorithm. The
validation application executes the blood pressure al-
gorithm with default values (now this is 65% for the
systole and 53% for the diastole) when the recordings
are imported. If the user changes the default values,
the blood pressure algorithm is executed again on all
the imported recordings and the values are refreshed
on the validation surface.
6 CONCLUSIONS
In the article we introduce the new application of the
Cardiospy system of Labtech Ltd. The application
realizes the PC-side processing of the oscillometric
blood pressure measurement recorded by microcon-
troller. The microcontroller has only limited mem-
ory and processor capacity. Therefore the microcon-
troller can produce inaccurate results or even no re-
sults. But the PC-side application can process the
measurements in a more accurate way. The cardiol-
ogist or the researcher can analyze the steps of the
processing of blood pressure measurement using the
application. The application visualizes the results of
each steps of the processing in an interactive way.
Namely, if the user changes the parameters, the scale
or the position of the mouse, the objects on the sur-
face change immediately. The interactive visualiza-
tion surface helps the user understand the information
of blood pressure measurement better. The applica-
tion is built above all for processing of long record-
ings including more measurements. Most recordings
are recorded during 24 hours. The application navi-
gates easily among the measurements of one record-
ing. We have built a validation application to support
the validation of the blood pressure measurement al-
gorithm. The validation application can process mass
of the measurements with reference and visualizes the
statistical data and the Bland-Altman diagram about
the difference between the results of the algorithm and
the reference data. The colors make the surface of the
application more vividly described and easily evalu-
ated.
The oscillometric blood pressure algorithm works
well under laboratory circumstances. Our goal is that
the algorithm meets the requirements of standard pro-
tocols of BHS and EHS. To reach this goal the algo-
rithm needs to be tested. As a result of the testing
some parameters of the algorithm can be specified.
VisualizationandOff-lineProcessingofBloodPressureSignals
397
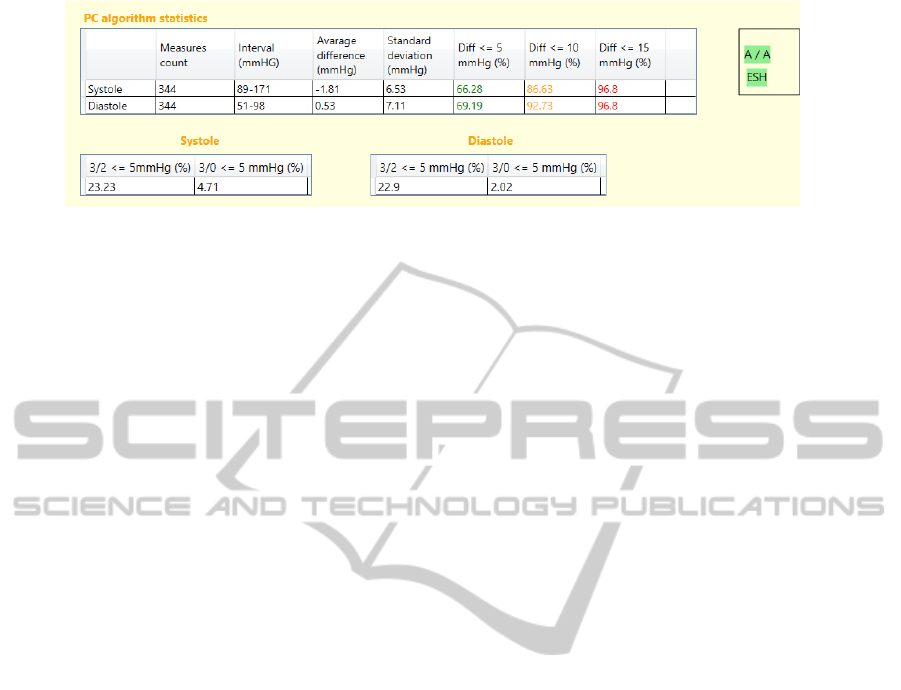
Figure 4: Validation tables.
ACKNOWLEDGEMENTS
The publication was partially supported by the
T
´
AMOP-4.2.2.C-11/1/KONV-2012-0001 project.
The project has been supported by the European
Union, co-financed by the European Social Fund.
The authors thank Peter Toth and Bela Kincs of
Labtech Ltd for their valuable contributions.
REFERENCES
Aboy, R. (2011). Method for blood pressure measure-
ment from noninvasive oscillometric pressure signals.
Technical report, Tiba Medical, Inc.
Ball-llovera, A., Del Rey, R., Ruso, R., Ramos, J., Batista,
O., and Niubo, I. (2003). An experience in imple-
menting the oscillometric algorithm for the noninva-
sive determination of human blood pressure. In En-
gineering in Medicine and Biology Society, Proceed-
ings of the 25th Annual International Conference of
the IEEE, volume 4, pages 3173 – 3175.
Bland, J. and Altman, D. (1986). Statistical methods for
assessing agreement between two methods of clinical
measurement. Lancet, pages 307 – 310.
Bland, J. and Altman, D. (1999). Statistical methods for
assessing agreement between two methods of clini-
cal measurement. Statistical Methods in Medical Re-
search, 8:135 – 160.
Geddes, L. A. (1991). Handbook of Blood Pressure Mea-
surement. Humana Press, 1st edition.
Kobalava, Z. D., Kotovskaia, I. V., Rusakova, O. S., and
Babaeva, L. A. Validation of ua-767 plus device for
self-measurement of blood pressure. Clinical Phar-
macology and Therapy, 12:70–72.
Labtech (2013). Labtech ltd. http://www.labtech.hu.
Lackovic, I. (2003). Engineering aspects of noninvasive
blood pressure measurement with the emphasis on im-
provement of accuracy. Medical and Hospital Engi-
neering, 41:73–85.
Lee, J., Kim, J., and Yoon, G. (2001). Digital envelope
detector for blood pressure measurement using an os-
cillometric method. In Journal Medical Engineering
and Technology, Proceedings of the 23rd Annual In-
ternational Conference of the IEEE, volume 1, pages
126–128.
Lin, C.-T., Liu, S.-H., Wang, J.-J., and Wen, Z.-C. (2003).
Reduction of interference in oscillometric arterial
blood pressure measurement using fuzzy logic. IEEE
Transactions on Biomedical Engineering, 50(4):432–
441.
Lin, H.-C. (2007). Specialised non-invasive blood pressure
measurement algorithm. Master’s thesis, Auckland
University of Technology.
Myers, M. G. (2010). A proposed algorithm for diagnos-
ing hypertension using automated office blood pres-
sure measurement. Journal of Hypertension, 28:703–
708.
O’Brien, E., Atkins, N., Stergiou, G., Karpettas, N., Parati,
G., Asmar, R., Imai, Y., Wang, J., Mengden, T., and
Shennan, A. (2010). European society of hypertension
international protocol revision 2010 for the validation
of blood pressure measuring devices in adults. Blood
Pressure Monitoring, 15:23–38.
O’Brien, E., Petrie, J., Littler, W., de Swiet, M., Padfield,
P. L., Altman, D. G., Bland, M., Coats, A., and Atkins,
N. (1993). The british hypertension society proto-
col for the evaluation of blood pressure measuring de-
vices. Journal of Hypertension, 11:43–62.
Sapinski, A. Standard algorithm of blood-pressure mea-
surement by the oscillometric method. Medical and
Biological Engineering and Computing, 30:671.
Sapinski, A. Theoretical basis for proposed standard algo-
rithm of blood pressure measurement by the sphyg-
mooscillographic method. Journal Of Clinical Engi-
neering, 22:171–174.
Wang, J.-J., Lin, C.-T., Liu, S.-H., and Wen, Z.-C. (2002).
Model-based synthetic fuzzy logic controller for indi-
rect blood pressure measurement. IEEE Transactions
on Systems, Man, and Cybernetics, Part B: Cybernet-
ics archive, 32(3):306–315.
Zheng, D., Giovannini, R., and Murray, A. (2011). Effect
of talking on mean arterial blood pressure: Agreement
between manual auscultatory and automatic oscillo-
metric techniques. In Computing in Cardiology, vol-
ume 38, pages 841–844.
HEALTHINF2014-InternationalConferenceonHealthInformatics
398
