
Infrared Spectral Microimaging
A New Tool to Characterise the Tissue Features in Skin Cancers
of Melanoma Type
David Sebiskveradze
1
, Cyril Gobinet
1
, Nathalie Cardot-Leccia
2
, Michel Manfait
1
,
Pierre Jeannesson
1
, Vincent Vuiblet
3
and Olivier Piot
1
1
CNRS FRE 3481 MEDyC, Faculté de Pharmacie, Université de Reims, 51 rue Cognacq-Jay, Reims, France
2
Laboratoire Central d'Anatomo Pathologie, Hopital Pasteur, Centre Hospitalier Universitaire de Nice, Nice, France
3
Laboratoire Pol Bouin, Hopital Maison Blanche, Centre Hospitalier Universitaire de Reims, Reims, France
Keywords: Melanoma, Skin Cancer, Infrared Spectroscopy, Spectral Imaging, Interconnection of Tissue Structures.
Abstract: Infrared (IR) spectral microimaging is a label-free optical technique that permits to probe the intrinsic
chemical composition of biological samples. This technique appears more informative than conventional
histology and could be developed as a non-destructive and objective diagnostic tool for in routine use in
pathology departments. The discrimination between tumoral and neighbouring tissues relies on highlighting
subtle spectral differences by means of advanced statistical multivariate data processing. In this way, we
applied an innovative algorithm based on fuzzy clustering to take into account the notion of nuance into the
clustering of IR image pixels. IR spectral imaging of human cutaneous melanomas was performed on
paraffin-embedded tissue sections, without previous chemical dewaxing. Reconstructed colour-coded
images allow recovering automatically different histological structures, by distinguishing tumour from the
connective tissue. This approach gives also access to information about the tissue structures. Indeed, it
permits to highlight the interconnection between neighbouring structures. In this work in progress study, the
analysis was focussed on the interconnection between the tumoral and peritumoral structures and between
the tumoral areas in case of a heterogeneous lesion. These first encouraging results pave the way to access
new diagnostic and prognostic criteria associated to the tumour aggressiveness in cutaneous melanomas.
1 INTRODUCTION
Melanoma skin cancer is one of the most aggressive
human cancers (Chin, 2006; Miller, 2006) and
reveals itself as a quiet, but rapid invasive life
threatening tumour (Simionescu, 2006). Melanoma
incidence rates have been increasing for at least 30
years. Between 2005 and 2009, incidence rates
among light skin people increased by 2.8 % per year.
In the United States, for example, melanoma is
expected to be diagnosed in about 76,690 persons in
2013, accounting for less than 5 % of all skin cancer
cases but the vast majority of skin cancer deaths
(Cancer Facts & Figures, 2013).
Accurate clinical diagnosis of malignant
melanoma is thus of great importance for early
detection and further treatment. Generally, the
diagnosis is based on the histological evaluation of
the lesion (Marghoob, 2009). However,
morphological interpretation might be considered as
subjective and could result in disagreements in the
diagnosis (Urso, 2005; Glusac, 2003). Many
attempts in the development of objective automatic
image analysis software were realised but due to the
complexity of histological structures, results have
not yet been conclusive (Gerger, 2003).
Fourier transform mid-infrared (FT–IR)
microspectroscopy is an efficient label-free optical
method based on the interaction between an infrared
(IR) radiation and matter. This vibrational
spectroscopy permits to probe the biochemical
composition of a sample in a very sensitive, non-
destructive, non-invasive and objective manner.
Coupled with an imaging system, FT–IR
microspectroscopy of human tissues has
demonstrated potential to provide clinically relevant
diagnostic information in oncology (Krishna, 2007;
Wolthuis, 2008; Kong, 2010), and particularly in
59
Sebiskveradze D., Gobinet C., Cardot-Leccia N., Manfait M., Jeannesson P., Vuiblet V. and Piot O..
Infrared Spectral Microimaging - A New Tool to Characterise the Tissue Features in Skin Cancers of Melanoma Type.
DOI: 10.5220/0004893000590065
In Proceedings of the International Conference on Bioimaging (BIOIMAGING-2014), pages 59-65
ISBN: 978-989-758-014-7
Copyright
c
2014 SCITEPRESS (Science and Technology Publications, Lda.)

detection and characterisation of skin cancers (Ly,
2009). Notably, the possibility to diagnose
melanoma from normal epidermis (Mordechai,
2004; Hammody, 2008) or to discriminate between
melanoma and benign nevus (Tfayli, 2005) based on
the IR markers specific to each tissue type was
shown. Associating with multivariate statistical
analysis methods, FT-IR imaging has also
demonstrated its potential for characterising various
melanoma types and highlighting intratumoral
heterogeneities within the primary melanoma skin
cancers independently of conventional histology
(Ly, 2010).
However, the latest developments in IR spectral
data processing and pattern recognition methods
have permitted highlighting, in skin carcinoma
lesions, the subtle biochemical changes between
cancerous and surrounding tissue areas
(Sebiskveradze, 2011). In this proof of concept
study, our objective was to develop an automated
digital staining of tissue sections in order to
investigate the interconnection between the tumoral
and the neighbouring peritumoral areas in primary
melanoma. The processing method was based on
fuzzy clustering of IR data and on the measure of the
cluster intercorrelation.
To this end, two representative samples of good
and bad prognosis melanoma were analysed. The IR
spectral images were directly collected on paraffin-
embedded thin sections and then automatically
clustered using an fuzzy clustering algorithm.
Moreover, in order to highlight interfaces between
the different clusters, a cluster interconnection
measure was introduced.
2 MATERIALS AND METHODS
2.1 Patients and Sample Preparation
Two samples of primary cutaneous superficial
spreading melanomas (SSM) were analysed in this
study. The first one, of good prognosis, developed
on the arm of a 65 years old woman, without
ulceration, with Clark level of 3 and 0.76 mm
Breslow thickness. While, the second one, of bad
prognosis, developed on the back of a 55 years old
man, presented an invasive nodular component and
ulceration, with Clark level of 4 and 2 mm Breslow
thickness.
The tissue samples were selected by the
pathologists from the tumour bank of the Pathology
Department. The specimens were fixed in formalin
and paraffin-embedded. From the samples, 10-
micron thick slices were cut and mounted on a
calcium fluoride (CaF
2
) (Crystran Ltd, Dorset, UK)
window for FT–IR imaging without any particular
preparation, especially no chemical dewaxing. First
adjacent slices (5 µm thick) to those used for FT–IR
analysis were stained with hematoxylin and eosin
(HE) for conventional histology.
2.2 FT-IR Data Acquisition
FT–IR spectral images were recorded in
transmission mode with a Spectrum Spotlight 300
FT–IR imaging system coupled to a Spectrum One
FT–IR spectrometer (both from PerkinElmer Life
Sciences, Waltham, MA, U.S.A.). The spatial
resolution of about ten micron and a spectral
resolution of 2 cm
-1
permitted the recording of
detailed tissular structures. Before each acquisition,
a reference spectrum of the atmospheric
environment and the CaF
2
window was recorded.
This reference spectrum was subsequently
automatically subtracted from the data by a built-in
function from the Perkin Elmer Spotlight software.
Each spectral image of about 1 mm
2
area, covering a
substantial part of the biopsy, consisted of around
30,000 spectra. Each image pixel represents an IR
spectrum, which is the absorbance of one
measurement point (6.25 6.25 µm
2
) over 902
wavenumbers uniformly distributed between 900
and 1800 cm
-1
. This spectral range, characterised as
the fingerprint region, actually corresponds to the
most informative region for biological samples (Ly,
2008; Ly, 2009).
2.3 Data Pre-processing
Data processing was carried out directly on spectral
images using built in-house programs written in
Matlab 2008a (The Mathworks, Natick, MA,
U.S.A.).
As the samples were analysed without previous
chemical dewaxing, the recorded FT–IR spectral
images had to be digitally corrected for paraffin
spectral contribution. To achieve this goal, an
automated pre-processing method based on extended
multiplicative signal correction (EMSC) was applied
on each recorded data set. This method has already
shown its digital dewaxing potential on skin and
colon cancer samples (Ly, 2008; Wolthuis, 2008).
Briefly, the mean spectrum was computed by
averaging all recorded spectra of each image. Light
scattering effects were modelled with a fourth-order
polynomial function. In order to take into account
the spectral variability of paraffin, the interference
BIOIMAGING2014-InternationalConferenceonBioimaging
60

matrix of the model was composed of the average
spectrum of paraffin and the first nine principal
components extracted from a FT–IR spectral image
recorded on a pure paraffin block. After the
application of the EMSC-based pre-processing,
paraffin contribution was neutralized, thus
permitting to retain in the data sets only the spectral
variability of the tissue.
In addition, this pre-processing step permitted to
discard from the analysis outliers and poor tissue
signal to noise ratio spectra. On the pseudo-colour
clustering images, the corresponding pixels are
white coloured for better visualisation.
2.4 Fuzzy Clustering
The spectral differences between different skin
structures (such as dermis, epidermis and tumour)
are weak after the EMSC-based pre-processing step.
To highlight the different biological structures of the
analysed sample, clustering methods can be used.
The main objective of clustering is to group together
similar spectra in order to reveal areas of interest
within tissue sections. In IR spectral imaging of
cancerous tissues, clustering methods allow to create
highly contrasted pseudo-colour images permitting
to localize tumoral nests within a complex tissue
(Ly, 2009; Sebiskveradze, 2011).
For each spectral image, a clustering method
based on fuzzy C-means (FCM) was used. One of
the particularities of FCM clustering is that it
permits to assign each pixel (spectrum) to every
cluster with an associated membership value varying
between 0 and 1; the sum of all the cluster
membership values for one pixel being equal to 1
(Bezdek, 1981). The amount of fuzziness introduced
in the clustering is managed by the fuzzy parameter.
Increasing the value of this parameter induces more
fuzziness in the clustering. Classical FCM algorithm
is considered as unsupervised except for the number
of clusters and the fuzziness parameter, determined
by the operator. Here, we used an algorithm named
RBA (Redundancy-Based Algorithm) to
automatically determine both FCM parameters
(Sebiskveradze, 2011).
In this study, we applied the FCM function from
the Matlab Statistics Toolbox with the Euclidean
distance. For each cluster, the cluster-membership
information was plotted in a separate image as a
pseudo-colour map. For cluster assignment, each
pseudo-colour map was then provided to the
pathologists for a comparison with the
corresponding HE-stained sections.
2.5 Measure of Interconnection
between Spectral Clusters
Interconnection corresponds to the sample areas (or
image pixels) shared between two clusters. To
calculate this interconnection the following
mathematical equation was implemented:
2
2
1
2log
log
2log
log
)(
jnin
jnin
jn
jnin
jn
jnin
in
jnin
in
ij
uu
uu
u
uu
u
uu
u
uu
u
nM
where
)(nM
ij
represents the interconnection
measurement calculated between i and j clusters for
the given pixel n; while,
in
u
and
jn
u
are respectively
i and j cluster membership values for this pixel. This
interconnection value varies between 0 (no
overlapping between the two clusters) and 1
(uniform distribution of pixel membership value
between the two clusters).
3 RESULTS AND DISCUSSION
The IR spectral images recorded on each tissue
section contained approximately 30,000 spectra.
These spectra were pre-processed in order to remove
paraffin contribution and clustered using the FCM-
based algorithm to regroup, within the same image,
spectra that show similar bio-molecular properties.
Note that for each case the number of clusters was
determined automatically by the algorithm. On the
analysed samples, it was possible to establish a one-
to-one correlation from those highly contrasted FCM
images to the adjacent HE section.
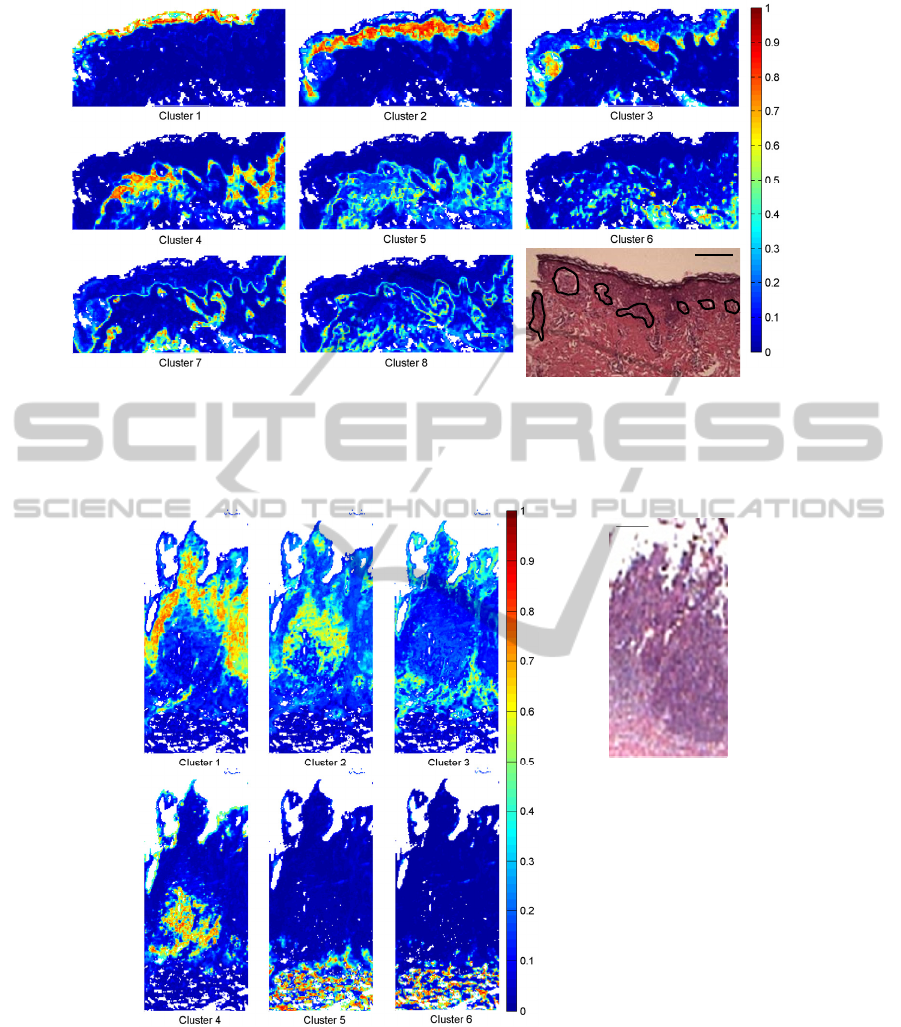
Figure 1 corresponds to the FCM-based
algorithm images obtained from the non-ulcerated
SSM (patient 1). Instead of superimposing the
images, each cluster was presented into a separate
pseudo-colour image. Here, we considered that the
pixels belonging significantly to a cluster image
presented a membership value superior to 0.4. Thus,
the clusters were assigned as follow: keratin (cluster
1), epidermis (cluster 2), tumour (cluster 3),
peritumoral collagen (clusters 4 and 5), lymphocytes
(cluster 6) and deep dermis (clusters 7 and 8).
Figure 2 depicts the images obtained from an
ulcerated SSM with an invasive nodular component
(patient 2). In this example, six clusters obtained by
FCM-based algorithm were assigned to the
following tissular structures: two distinctive types of
InfraredSpectralMicroimaging-ANewTooltoCharacterisetheTissueFeaturesinSkinCancersofMelanomaType
61
Membershipvalue
Figure 1: Spectral histology obtained from a non-ulcerated superficial spreading melanoma (patient 1) using FCM-based
algorithm. Pseudo-colour map built with 8 clusters represented by individual images with corresponding hematoxylin and
eosin-stained image (scale bar, 200 µm, tumour is outlined). Assignment of the clusters: keratin (1), epidermis (2), tumour
(3), peritumoral collagen (4 and 5), lymphocytes (6) and deep dermis (7 and 8).
Membershipvalue
Figure 2: Spectral histology obtained from an ulcerated superficial spreading melanoma with an invasive nodular
component (patient 2) using FCM-based algorithm. Pseudo-colour map built with 6 clusters represented by individual
images with corresponding hematoxylin and eosin-stained image (scale bar, 200 µm). Assignment of the clusters: tumour (1
and 2), intratumoral collagen (3), lymphocytes (4), deep collagen (5 and 6).
tumour cells (clusters 1 and 2) were located in the
invasive component. The intratumoral collagen
(cluster 3) also appeared. Other structures
represented by the clusters 5 and 6 were assigned to
deep collagen. Furthermore, very detailed
histological structures such as lymphocytes can be
recovered (cluster 4) indicating the presence of an
inflammatory component.
BIOIMAGING2014-InternationalConferenceonBioimaging
62
As visible from the presented samples, in both cases,
tumours were very well delineated and demarcated
from the epidermis. Moreover, the first one
corresponding to a good prognosis melanoma
contained only one tumour cluster while for the
second one of bad prognosis (i.e. presenting a
metastatic risk), a tumoral heterogeneity was
revealed by the identification of 2 clusters (Okcu,
1996).
After this first processing of spectral data
permitting to recover the histological organisation of
the tissue, we applied the new spectral
interconnection measure between the identified
clusters. Indeed, for each pixel, an interconnection
value was calculated for a couple of clusters of
interest. As a result, the generated new images,
presenting the same spatial size, were displayed
according to a colorbar scale from 0 (no
interconnection between the clusters, dark-colour
pixels) and 1 (maximum of interconnection, light-
coloured pixels). For the analysed samples, different
circumstances can be observed.
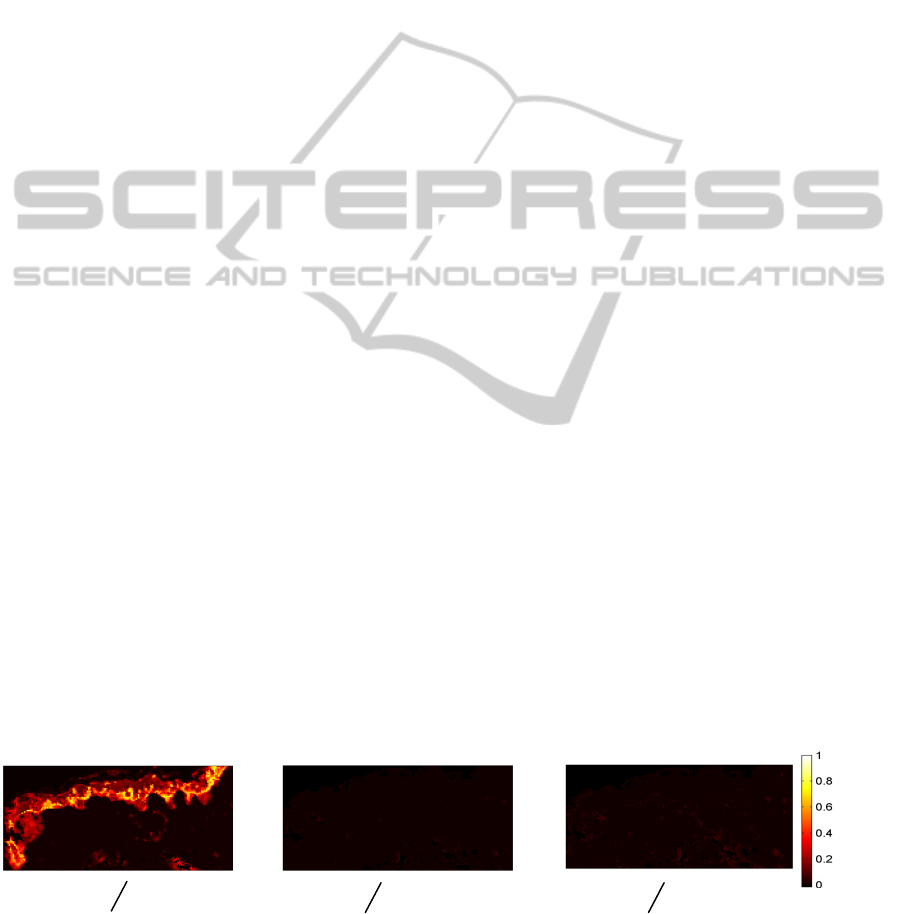
Figure 3 shows the interconnection between the
tumour cluster and its surrounding structures for the
non-ulcerated SSM (patient 1) whose FCM clusters
are indicated in Figure 1. Indeed, through the Figure
3A we can assume the high interconnection between
the tumour cluster (cluster 3) and the neighbouring
epidermis (cluster 2). In addition, Figures 3B and 3C
show a low interconnection between the tumour and
the peritumoral collagen (clusters 4 and 5). Similar
calculations were performed for the ulcerated SSM
which presents an invasive nodular component
(patient 2) (Figure 4). Indeed, Figure 4A revealed a
maximal interconnection between the two different
types of tumour clusters (clusters 1 and 2 of Figure
2). Further, on the Figures 4B and 4C, a high
interconnection was highlighted between these
tumour clusters and their microenvironment
corresponding to intratumoral collagen (cluster 3).
Highlighting such interconnection between the
invasive tumour and its surrounding tissue confirms
the hypothesis that strong interactions exist between
the tumour cells and their matrix environment.
Moreover, a marked interconnection between
one type of tumour cells (cluster 2), located in the
invasive region of the malignant lesion, and the
inflammatory component (cluster 4) was identified
(Figure 4D). This cluster assigned to the
inflammation does not present any interconnection
with the other tumour cluster (cluster 1) (data not
shown). An absence of interconnection was also
noticed between the tumour and the deep collagen,
(clusters 5 and 6 of Figure 2) (data not shown).
The obtained results demonstrate the feasibility
of FT-IR spectral imaging associated with advanced
multivariate statistical analyses as a powerful
automatic tool for histopathological characterisation
of primary cutaneous melanoma. The efficiency of
this biophotonic imaging technique relies on its
capability to probe the subtle differences of
molecular composition that exist between the tissue
structures.
Moreover, the highlighting of novel spectral
marker of tumour invasiveness reinforces the idea of
integration of this approach in the conventional
morphological analyses in order to help in the
guidance of therapeutic diagnoses.
4 CONCLUSIONS
The combination of IR imaging and pattern
recognition techniques might be an innovative,
label-free, high-throughput and automatic
technology to aid screening high-risk metastatic
melanoma lesions at their earliest stages. Moreover,
from the histopathological point of view,
highlighting an invasive component in melanoma
skin cancer is of great interest, since it permits to
determine the precise area where the invasive cells
can infiltrate the surrounding tissue. This kind of
invasive front is of crucial importance to assess the
Interconnectionvalue
Epidermis
(cluster2)
Tumour
(cluster3)
Tumour
(cluster3)
Peritumoral
collagen(cluster4)
Tumour
(cluster3)
Peritumoral
collagen(cluster5)
C
BA
Figure 3: Illustration of interconnection measurements for a non-ulcerated superficial spreading melanoma (patient 1). 3
circumstances: A) between the tumour and epidermis clusters, B) and C) between the tumour and peritumoral collagen
clusters.
InfraredSpectralMicroimaging-ANewTooltoCharacterisetheTissueFeaturesinSkinCancersofMelanomaType
63
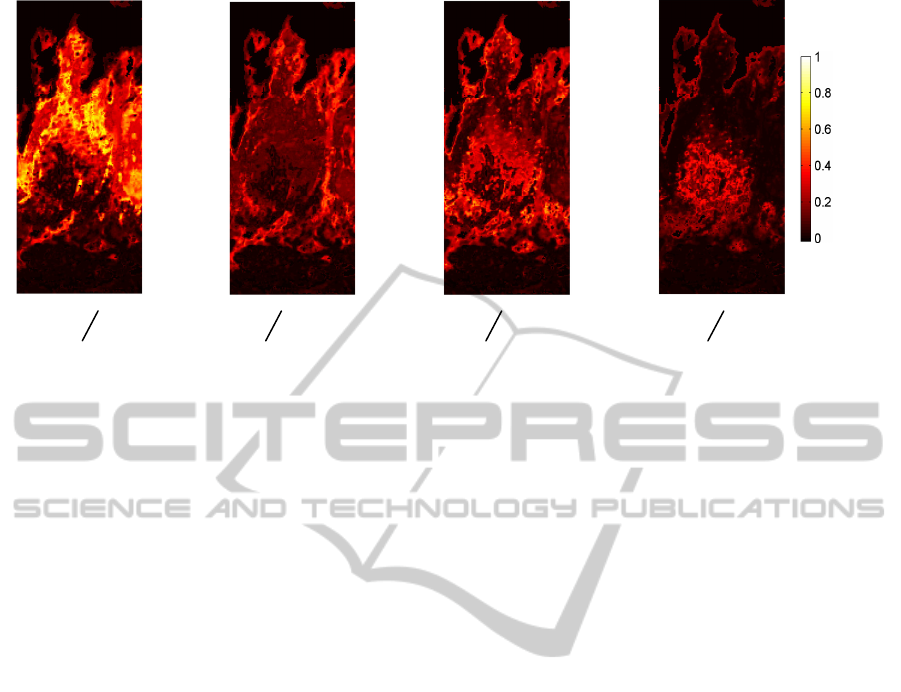
Interconnectionvalue
A B C D
Tumour
(cluster1)
Tumour
(cluster2)
Tumour
(cluster1)
Intratumoral
collagen
(cluster3)
Tumour
(cluster2)
Lymphocytes
(cluster4)
Tumour
(cluster2)
Intratumoral
collagen
(cluster3)
Figure 4: Illustration of interconnection measurements for an ulcerated superficial spreading melanoma with an invasive
nodular component (patient 2). 4 circumstances: A) between the tumour clusters, B) and C) between tumours and
intratumoral collagen clusters, D) between tumour and lymphocytes clusters.
tumour agressiveness, by revealing a risk of
malignant cell escape and consequently metastasis
formation. These first results need to be validated by
further analysis on a large number of samples,
before envisaging a potential application in clinics.
REFERENCES
Bezdek, J. C., 1981. Pattern recognition with fuzzy
objective function algorithms, Plenum Press. New
York.
Cancer Facts and Figures, 2013. American Cancer Society,
Atlanta.
Chin, L., Garraway, L. A., and Fisher, D. E., 2006.
Malignant melanoma: genetics and therapeutics in the
genomic era. Genes and development, vol. 20, pp.
2149-2182.
Gerger, A., Smolle, J., 2003. Diagnostic imaging of
melanocytic skin tumors. Journal of cutaneous
pathology, vol. 30, pp. 247-252.
Glusac, E. J., 2003. Under the microscope: doctors,
lawyers, and melanocytic neoplasms. Journal of
cutaneous pathology, vol. 30, pp. 287-293.
Hammody, Z., Argov, S., Sahu, R. K., Cagnano, E.,
Moreh, R., and Mordechai, S., 2008. Distinction of
malignant melanoma and epidermis using IR micro-
spectroscopy and statistical methods. Analyst, vol.
133, pp. 372-378.
Kong, R., Reddy, R. K., and Bhargava, R., 2010.
Characterization of tumor progression in engineered
tissue using infrared spectroscopic imaging. Analyst,
vol. 135, pp. 1569-1578.
Krishna, C. M., Sockalingum, G. D., Bhat, R. A., Venteo,
L., Kushtagi, P., Pluot, M., and Manfait, M., 2007.
FTIR and Raman microspectroscopy of normal,
benign, and malignant formalin-fixed ovarian tissues.
Analytical and Bioanalytical Chemistry, vol. 387, pp.
1649–1656.
Ly, E., Piot, O., Wolthuis, R., Durlach, A., Bernard, P.,
and Manfait, M., 2008. Combination of FTIR spectral
imaging and chemometrics for tumour detection from
paraffin-embedded biopsies. Analyst, vol. 133, pp.
197-205.
Ly, E., Piot, O., Durlach, A., Bernard, P., and Manfait, M.,
2009. Differential diagnosis of cutaneous carcinomas
by infrared spectral micro-imaging combined with
pattern recognition. Analyst, vol. 134, pp. 1208-1214.
Ly, E., Cardot-Leccia, N., Ortonne, J. P., Benchetrit, M.,
Michiels, J. F., Manfait, M., and Piot, O., 2010.
Histopathological characterization of primary
cutaneous melanoma using infrared microimaging: a
proof-of-concept study. British Journal of
Dermatology, vol. 162, pp. 1316-1323.
Marghoob, A. A., Scope, A., 2009. The complexity of
diagnosing melanoma. Journal of Investigative
Dermatology, vol. 129, pp. 11-13.
Miller, A. J., Mihm Jr, M. C., 2006. Melanoma. New
England Journal of Medicine, vol. 355, pp. 51-65.
Mordechai, S., Sahu, R. K., Hammody, Z., Mark, S.,
Kantarovich, K., Guterman, H., PODSHYVALOV,
A., GOLDSTEIN, J., and Argov, S., 2004. Possible
common biomarkers from FTIR microspectroscopy of
cervical cancer and melanoma. Journal of microscopy,
vol. 215, pp. 86-91.
Okcu, A., Hofmann-Wellenhof, R., Woltsche, I., Smolle,
J., and Kerl, H., 1996. Pathological findings
suggestive of interclonal stabilization in a case of
cutaneous melanoma. Clinical and experimental
metastasis, vol. 14, pp. 215-218.
Sebiskveradze, D., Vrabie, V., Gobinet, C., Durlach, A.,
Bernard, P., Ly, E., Manfait, M., Jeannesson, P., and
Piot, O., 2011. Automation of an algorithm based on
fuzzy clustering for analyzing tumoral heterogeneity in
BIOIMAGING2014-InternationalConferenceonBioimaging
64

human skin carcinoma tissue sections. Laboratory
Investigation, vol. 91, pp. 799-811.
Simionescu, O., Costache, M., and Testori, A., 2006.
Cutaneous melanoma: digital dermoscopy-essential
tool for positive diagnosis. Journal of cellular and
molecular medicine, vol. 10, pp. 991-994.
Tfayli, A., Piot, O., Durlach, A., Bernard, P., and Manfait,
M., 2005. Discriminating nevus and melanoma on
paraffin-embedded skin biopsies using FTIR
microspectroscopy. Biochimica et Biophysica Acta
(BBA)-General Subjects, vol. 1724, pp. 262-269.
Urso, C., Rongioletti, F., Innocenzi, D., Saieva, C., Batolo,
D., Chimenti, S., Filotico, R., Gianotti, R., Lentini, M.,
Tomasini, C., Rebora, A., and Pippione, M., 2005.
Interobserver reproducibility of histological features in
cutaneous malignant melanoma. Journal of clinical
pathology, vol. 58, pp. 1194-1198.
Wolthuis, R., Travo, A., Nicolet, C., Neuville, A., Gaub,
M. P., Guenot, D., Ly, E., Manfait, M., Jeannesson, P.,
and Piot, O., 2008. IR spectral imaging for
histopathological characterization of xenografted
human colon carcinomas. Analytical chemistry, vol.
80, pp. 8461-8469.
InfraredSpectralMicroimaging-ANewTooltoCharacterisetheTissueFeaturesinSkinCancersofMelanomaType
65
