
Quality Indices in Medical Alert Systems
Juan-Pablo Suarez-Coloma
1,2
, Christine Verdier
1
and Claudia Roncancio
1
1
Univ. Grenoble – Alpes, LIG, Grenoble, France
2
Calystene S.A., Eybens, France
Keywords: Alert System, Quality Metrics, Applicability Index, Confidence Index, Alert Desensitization, Fuzzy Logic.
Abstract: Numerous alert systems exist in healthcare domains but most of them produce too many false alerts leading
to bad usage or disinterest. The need of better alert systems motivates the development of context-aware
alert systems. The alert system Tempas is a help-decision tool based on personalized alerts. It is adaptable to
business environment, target population, expert user needs, and customized in real-time for immediate
needs by end users. The adaptability is defined during the alert creation process. The customization is
defined during the alert management process. It is based on the population targeted, activation conditions,
and the alert behavior. It is supported by two quality indices: the applicability index expresses how much a
patient is concerned by the alert and the confidence index expresses how much the user can trust the alert.
Both indices are used during the alert creation process (minimal thresholds for the population) and during
the management process (minimal personalized threshold). The paper presents a summarized view of
Tempas and focuses on the quality indices.
1 INTRODUCTION
Alert systems are warning systems useful to detect
dangerous or unusual situations and avoid problems.
Different domains are concerned with alerts systems
e.g. home, healthcare, buildings. An alert system
allows creating, defining and managing alerts from
data or services. The question of alert quality is of
high interest because two main problems stand out
concerning alert systems usage: the confidence in
the system and the pertinence of the alert detection.
The confidence is studied through the alert
desensitization. Users lost trust and the interest in
alerts systems because of high false positive rates,
useless alerts, bad routing, among others. The
reduction of alert detection errors is essential to
enhance the use of alert systems.
The pertinence of alert detection concerns the
capacity of the system to be adaptable to the user
needs and to be configured by the end user himself
according to his immediate need (disease evolution,
emergency for example). High customization in alert
management is a key issue to reduce errors.
In this paper we propose Tempas, a context-
aware alert system intended to be used as a help
decision tool. This paper focuses mainly on two
quality indices proposed to reduce the errors in the
alert detection. In Tempas, expert users introduce
knowledge using linguistic values, and create alerts
based on this knowledge. They define the activation
conditions of alerts, the target population (patients),
and the users to notify (to route the alerts to the
correct caregiver). Expert users also define the alert
behavior. Alerts are produced from several variables
issued from heterogeneous data sources. Among the
main features of Tempas we found the possibility of
real time customization of context-aware alerts and
the notification of relevant alerts which are the
results of the instantiation of defined alerts at a
specific moment. Alerts are produced with two
quality indices: the applicability index, and the
confidence index. These two indices reflect the
relevance of alerts. Hence, they are used for filtering
alerts: a global filtering at the design step, and a
filtering during the customization step. Both filtering
avoid sending alerts which are inappropriate for a
particular user even if they are “true” alerts when
considered in a general case.
This paper is organized as follows. Related
works are presented in Section 2. Section 3
introduces Tempas and the main customization
facilities. We present the applicability and
confidence indices in Sections 4 and 5, respectively.
The alert behaviour is explained in Section 6. The
81
Suarez-Coloma J., Verdier C. and Roncancio C..
Quality Indices in Medical Alert Systems.
DOI: 10.5220/0004893900810089
In Proceedings of the 16th International Conference on Enterprise Information Systems (ICEIS-2014), pages 81-89
ISBN: 978-989-758-027-7
Copyright
c
2014 SCITEPRESS (Science and Technology Publications, Lda.)

implementation is presented in Section 7. Section 8
is devoted to the conclusions and perspectives.
2 RELATED WORKS
The related works are presented as follows. First we
discuss the alarm desensitization and alarm
notification in health information systems. Later, we
talk about metrics and its use in fuzzy logic
inference. We finish this section with medical
monitored data and how data is analyzed.
Alarm desensitization in healthcare structures is
a fact (Cvach, 2012), backed up with drug
prescription (Phansalkar, et al., 2010). Cvach
proposes a review of research and industrial
literature concerning alert fatigue. She analyses
seventy two papers from three popular medical
databases between 1/1/2000 and 10/1/2011. Cvach
emphasizes that alert desensitization is mainly
caused by high false alarm rate (Iskio, et al., 2006)
and poor positive predictive values. Between 80%
and 99% of alarms are categorized as being false
positive or useless (Atzema, et al., 2006). These high
rates are often due to preconfigured thresholds. It is
important to let alert systems be operated by end
users because every clinical environment is unique.
Hence, the ease and flexibility of the alert system in
post-installation is essential (Gee & Moorman,
2011).
Many notified alarms are not well understood.
Users are not able to handle correctly more than six
alarm signals. Even, experienced caregivers use to
identify only half among all the sounds in an
intensive care unit (Clark, 2006). In hospitals, nurses
handle many devices. Some of them detect the same
alerts disturbing the user. A study over 1327 users
concludes that more than 90% of them agree with
the need to prioritize and easily differentiate audible
and visual alarms (Korniewicz, et al., 2008). 49% of
respondents find helpful to have a dedicated alert
staff (34% responded neutral). The same study
shows that 49% of respondents do not agree that to
set alert parameters is a complex task (23%
responded as neutral). 72% of respondents agreed
that alarms are adequate to alert staff.
The work presented in (Leung, et al., 2006)
proposes a collaborative recommender system using
the support and confidence (Agrawal, et al., 1993) of
the associations, which are expressed using fuzzy
logic. The fuzzy logic allows obtaining more human
understandable results (Zadeh, 1965). So therefore,
fuzzy logic is used in many applications (Bai &
Wang, 2006). In (Alsubhi, et al., 2012), the authors
propose an engine for intrusion detection systems.
Their work prioritizes alerts based on its score. The
score is calculated using fuzzy logic inference and
six metrics related to the applicability of the alert.
They focus their experiences to find the best-fit
configuration for all the metrics proposed and the
fuzzy logic engine. They concluded that it is not
possible to find a unique best configuration because
the optimal configuration is different for each
specific dataset.
A multi-parameter monitoring device is
presented in (Anliker, et al., 2004). Their device is
connected to a telemedicine center in charge of
making online analysis based on preconfigured rules
generating alerts when abnormal events are detected.
The work is a patient-aware alert system since alert
parameters are set using the patient everyday
activities. (Hudson & Cohen, 2010)’s work proposes
a patient-aware system based on Personal Health
Records (PHR). Their algorithm compares current to
previous data. Positive changes lead to notifications
whereas negative changes lead to alerts. Trend
templates expressing temporal patterns in multiple
variables are presented in (Haimowitz & Kohane,
1996). Trend templates express the expected
behaviors of specific disorders. Behaviors as normal
or abnormal are used for diagnosis.
To address the mentioned scientific issues
literature focuses on customization to keep the user
interest (Zwieg, et al., 1998). As a consequence,
users operate the system and understand what they
do (Krall & Sittig, 2002). Hence, untoward events
may be avoided (Wyckoff, 2009). Another issue is
to work with processed data (as linguistic values) to
reduce the number of detected alerts (Borowski, et
al., 2011). Values expressing variable values at
specific instants and variables behaviors (trend) help
to define best alert situations (King, et al., 2012).
The context-aware Tempas system allows its
customization by the users. It introduces the use of
linguistic values to improve alert definition. It
supports the monitoring of variables and trends to
get refined alert scenarios. Tempas advises
appropriate handling of repeated alerts to avoid
over-notification. It proposes two quality indices to
adapt the system via alert filtering.
3 TEMPAS CUSTOMIZATION
The alert customization process involves the target
population, the activation conditions, and the alert
ICEIS2014-16thInternationalConferenceonEnterpriseInformationSystems
82
behavior.
The target population represents who is
concerned by the alert. The system gets data like
vital and non-vital signs, environmental data, and
any other data related to an activation condition.
New data sources can be added to Tempas at
runtime. Subsequently new alerts can be configured.
All these elements help to define context-aware
alerts. The activation conditions represent user
knowledge and are expressed with linguistic values
based on fuzzy logic. Two kinds of data can be
expressed with linguistic values.
Linguistic values representing a variable value at a
specific instant.
Linguistic values representing the temporal
evolution of variable values. This evolution is a
trend.
For example, an alert in Tempas to warm a toxic
shock syndrome can be: “alert the nurses in the
emergency room if the body temperature is high and
the blood pressure is decreasing”. This alert will be
refined and explained throughout the paper. Tempas
uses weights to prioritize the activation conditions.
In the example they are considered equally
important.
The alert behavior defines how to handle
repeated alerts and when to attract the user attention.
The alert behavior is explained in Section 6.
The next two sections present the applicability
and the confidence indices used to adapt the system
(to the user preferences) regarding relevant alerts.
Users utilize the applicability index to resolve if the
patient is properly concerned by the alert. The
confidence index defines alert trust.
4 APPLICABILITY INDEX
The applicability index expresses how much the
alert concerns a patient – inside the target
population. Implicitly, it expresses if the user can
consider the alert as such.
Section 4.1 explains how to handle linguistic
values. Sections 4.2 and 4.3 present how to calculate
the applicability index for variable values (at
specific instant), and for trend values, respectively.
4.1 Linguistic Values
Let us suppose that the system needs to know how to
handle a temperature value of 35°C. Most of
caregivers will agree that it should be considered as
a “low temperature”. Linguistic values are based on
fuzzy logic that leads to obtain more understandable
human results. The applicability index is calculated
in the fuzzification process. The fuzzification
process transforms a variable crisp value into a
linguistic value, and computes the membership
degree (MD) according to the fuzzy set. The
algorithm uses fuzzy sets to handle the ambiguous
data similarly as a human probably will do. There
are as many fuzzy sets as linguistic values. Tempas
uses trapezoidal fuzzy sets and the corresponding
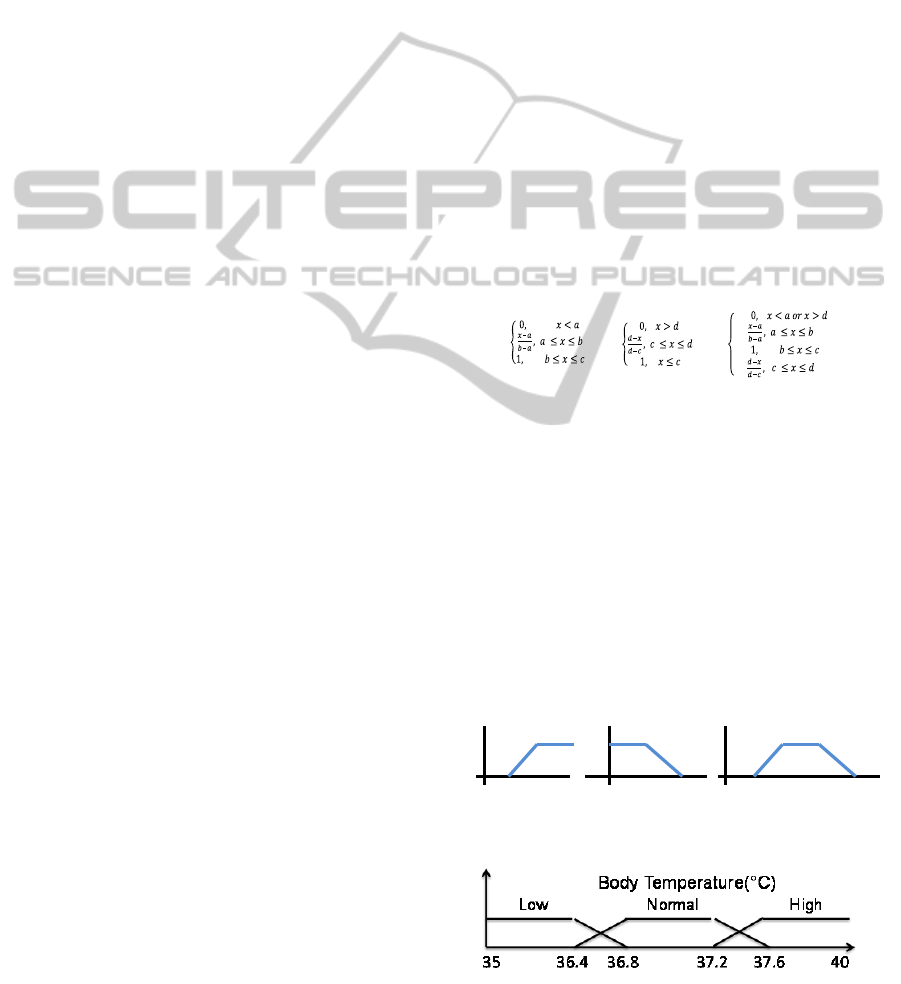
trapezoidal membership function. Figure 1 shows
the general trapezoidal fuzzy set for any variable.
Equation (1) let to compute the membership degree
according to the trapezoidal fuzzy set. The
membership degree is used to calculate the
applicability index.
Figure 2 shows three generated fuzzy sets for the
body temperature variable. Fuzzy sets are related to
the variable ranges. Besides, two consecutive fuzzy
sets share a range of values representing an
incertitude zone. The fuzzification process computes
two linguistic values and two membership degrees
for values belonging to the incertitude zone
according to equation (1).
(1)
Using the fuzzy sets in Figure 2, a crisp value of
36.7 °C will produce a linguistic value “low” with a
membership degree of 0.25. The same crisp value
will produce a linguistic value “normal” with a
membership degree of 0.75. When the membership
degree is higher, the ambiguity is lower.
In Tempas, expert users define the variable
ranges. This option brings the domain knowledge for
alert configuration e.g. the body temperature range
differs from patient, patient gender, or even in the
recorder mode (orally, axilla, rectum, etc.). As well,
this option plays an important role in the
applicability index calculation. The next two
sections clarify the application index computation.
Figure 1: Trapezoidal fuzzy sets.
Figure 2: Body temperature fuzzy sets.
MD(x)=
MD(x)=
MD(x)=
111
cd
da
bcab
QualityIndicesinMedicalAlertSystems
83

4.2 Applicability Index for Variable
Value
The algorithm classifies a variable value into one or
two fuzzy sets. Each fuzzy set corresponds to a
linguistic value. The classification returns a
membership degree. In the simplest case - when only
one variable is used for the alert activation condition
- the membership degree corresponds to the
applicability index. In a complex case - when several
variables are involved in the alert activation
conditions - the alert applicability index is computed
using all the membership degrees. Let us consider
our previous alert: “alert the nurses in the emergency
room if the body temperature is high and the blood
pressure is decreasing”. A temperature of 37.5 °C
returns a linguistic value “high” with a membership
degree of 0.75 using the equation (1). Accurate
alerts are dependent on quality variable ranges.
4.3 Applicability Index for Trend
Values
The second activation condition of the alert example
concerns trends (blood pressure decreasing). Trends
are detected over time series. A time series is a
sequence of data points. Here, a data point
represents a variable value at a specific time. A
variable value with a timestamp is a variable
observation. The Tempas trend detection algorithm
gets a time series and returns the best k segments
representing the whole time series. Each one of the k
best obtained segments is classified in a similar way
that a variable value is. The algorithm classifies time
series segments into one or two fuzzy sets using the
segment angle. The fuzzy sets for trend
classification are defined between minus ninety and
ninety degrees. The applicability index for trend
values is computed using the membership degree for
the defined (in angles) fuzzy sets. Let us suppose
that the algorithm detects two consecutive segments
with angles of -10 and -40 degrees. The last segment
may be considered as a decreasing trend with a
membership degree of 0.95. Hence, the whole
applicability index of the alert example will be 0.85.
The trend detection algorithm is explained more
deeply in the next section.
5 CONFIDENCE INDEX
The confidence index expresses the quality of the
alert based on the temporality of the data used to
detect the alert. Intuitively, it reflects how much the
user can trust the alert: alerts based on completely
up-to-date measures have a high confidence index,
whereas alerts using older measures will be notified
with a lower confidence index.
Section 5.1 explains valid time and the expiration
time for variable values. Sections 5.2 and 5.3
introduce the confidence index for variable values
and for trend values, respectively.
5.1 Valid Time and Expiration Time
The confidence index relies on temporal information
of the variable values: 1) the timestamp - when the
value has been observed; 2) the valid time - how
long a variable value is true and 3) the expiration
time, the moment when the variable value cannot be
considered as a current value anymore.
Figure 3 shows the variable valid and expiration
time for a variable observation. The confidence
index of a single variable value is 1 if the value is
used during its valid time. After the valid time the
index decreases to become 0 at expiration time.
5.2 Variable Value
The confidence index of an alert depends on the
confidence index of the variable values it uses. An
alert using a single variable inherits the confidence
index of the variable value. A weight is used when
several activations conditions are involved in the
alert.
The confidence index is higher when the alert
evaluation uses variable values during their valid
time. In the opposite, the confidence index is zero
when the alert evaluation time is after the expiration
time of the variable values.
Let consider the previous example. Figure 4
shows the confidence index for the temperature at
two different times. The circle represents the body
temperature. The dotted line represents the
temperature valid time. The dashed line represents
the temperature expiration time. Vertical lines
represent two events (Ev-1 and Ev-2) i.e. the alert
evaluation at specific time. Rectangles contain the
confidence index at the event time. At Ev-1, the
confidence index is 1 given that it is during the
Figure 3: Variable valid and expiration time.
Valid Time
0
1
ExpirationTime
ICEIS2014-16thInternationalConferenceonEnterpriseInformationSystems
84

temperature valid time. Instead, at Ev-2, the
confidence index will be lower given that the
temperature observation is between the valid and the
expiration time.
Alerts are defined using variables from several
data sources, for example meteorological
organizations. The reliability of these external data
cannot be assured. Thus, an external service failure
or an unexpected behavior will produce missing
data. In this case, the alert information system
continues to evaluate the alerts using the last known
external observation. Eventually some alerts will be
detected, probably with a smaller confidence index.
The confidence index strengthens such a backup
solution.
5.3 Trend Values
Trends are calculated from two or more variable
observations. The confidence index lets Tempas to
handle irregular time series i.e. irregular monitoring.
Most of works suppose regular time series based on
the reliability of monitoring devices.
Segmentation, fusion, and the segment
discovering algorithm are presented in the next
subsections. Trends are detected in a two-step
algorithm. The first step is the time series
segmentation. Segmentation transforms a variable
time series with n observations into a set of m
segments. The second step is the fusion. Fusion is an
iterative process that merges consecutive segments
until finding the k most important segments in all the
time series (Suarez-Coloma, et al., 2013). The trend
detection algorithm is indifferent from the
confidence index. Nevertheless, the confidence
index is computed during the trend detection process
introduced in the following subsections.
Figure 4: Temperature confidence index at two different
times.
5.3.1 Segmentation
Tempas changes n variable observations into n-1
segments. A local confidence index is attributed to
each segment (two dimensions) based on the
temporal interval (one dimension) length and the
respective variable valid and expiration time. Figure
5 shows a segmented time series and the respective
confidence indices.
5.3.2 Segment Fusion
The iterative process merges consecutive segments
with a bottom-up approach. The confidence index of
a new segment is the product of the two confidence
indices of the consecutive segments that it replaces.
Figure 6 shows how Tempas merges two connected
segments and goes from four until two segments.
We use the product of local confidence indices
instead of the addition or the minimum/maximum.
The product propagates the confidence from the
past. In Figure 5 we found four connected segments
with the following confidence indices: 1, 0.67, 1,
and 1. The algorithm merges the third and the fourth
segments using its own merging criteria. The
algorithm stops after finding two segments with
confidence indices of 0.67 and 1, respectively.
The confidence index is indifferent to the
merging criteria. In most of the cases, the algorithm
merges the two consecutive segments with the
highest confidence indices, but this is not a general
rule.
Let consider our previous example. Let suppose
the time series in Figure 6 represents the blood
pressure observations. The last segment is a
decreasing trend with a confidence index equal to
one. The alert confidence index is then equal to one
at Ev-1 (Figure 4.) and equal to 0.8 at Ev-2.
5.3.3 Segment Finding Algorithm
In this section we present the pseudocode for finding
the k most important segments in a time series. The
time series represents a specific set of variable’s
observations. We focus in the confidence index
computation. The segment classification is avoided
in the pseudocode. As explained in Section 4,
segments are classified using its slope (angle) and
the defined fuzzy sets.
Figure 5: confidence index calculation in the segmentation
step.
Figure 6: confidence index calculation in the fusion step.
37.5°c
Ev‐1
Ev‐2
1
0.6
QualityIndicesinMedicalAlertSystems
85

/*
TS: a time series (p
1
, p
2
,…, p
n
).
TS(i): the point i in TS = p
i
.
TS[i:j]: a sub time series formed by
all the points between p
i
and p
j
.
P.t: the timestamp of the point p.
p.v: the variable value represented
by the point p.
Segs: a piecewise linear
approximation of a time series.
Segs(i): the i segment in Segs.
Seg.CI: the confidence index of a
segment.
Seg.ps: the start point of a
segment.
Seg.pe: the end point of a segment.
vt: defined valid time.
et: defined expiration time.
*/
// returns the confidence index
// calculation from two points
// t
1
<= t
2
Algo double = calculCI(t
1
,t
2
)
if(t
2
-t
1
< vt) return 1;
else if(vt < t
2
-t
1
< et)
return (et-(t
2
-t
1
))/(et–vt);
else return 0;
// returns a linear segment
// between two points
Algo Seg = createSeg(p_s,p_e)
Seg.ps = p_s;
Seg.pe = p_e;
Seg.CI = calculCI(p_s.t,p_e.t);
// returns a segmented time series
Algo Segs = segmentation(TS)
for i = 1:1:TS.length
Segs=Segs.Add(createSeg(TS(i),
TS(i+1));
// returns a new segment merging
// two connected segments
Algo Seg = mergeSeg(s1,s2)
s3.ps = s1.ps;
s3.pe = s2.pe;
s3.CI = s1.CI * s2.CI;
// returns the best k segments
// representing the time series
Algo Segs = findBestSegs(TS,k)
Segs = segmentation(TS);
while (Segs.length > k )
//find the best two connected
//segments to be merged using
//the bottom up constraints
(s1,s2) = findBestPair(Segs);
s3 = mergeSeg(s1,s2);
delete(Segs,s1);
delete(Segs,s2);
add(Segs,s3);
6 ALERT BEHAVIOR
Each alert defines its own behavior; that is, how to
handle repeated alerts, and when an alert must be
notified (a trustworthy alert). It defines, indeed, the
interaction between detected alerts and end users.
Section 6.1 presents the difference between alerts
and detected alerts. Section 6.2 presents the alert life
cycle. Alert filtering is explained in Section 6.3.
Finally, Section 6.4 describes how alerts are
presented to the medical staff.
6.1 Detected Alerts
Alerts are defined basically as the expression of the
activation conditions e.g. “alert fever if the body
temperature is high”. A detected alert is the
instantiation of a defined alert at a specific instant
e.g. “alert fever over the patient Smith at
23/05/2013. The body temperature is high”. In
Tempas, two detected alerts are repeated if they are
instanced from the same alert and target the same
patient. In the rest of the document, a repeated alert
is a repeated detected alert.
6.2 Alert Life Cycle
Users define the alert life cycle and particularly what
to do with repeated detected alerts, especially to
choose if they should, or not, attract the users’
attention. An alert may be evaluated all the X time
units. Particular events may also activate an alert
evaluation. In both cases, it is possible to find
repeated alerts.
Let us consider two detected alerts using the
previous example. Both detected alerts uses the
same time series, but different temperature
observations. The first detected alert uses a
temperature value of 37.5, instead, the second one
uses a value of 37.6. They are repeated alerts, but
what to do with these alerts? Repeated alerts are
positive alerts but they can be uninteresting and
produce noise. Next sections explain how Tempas
approaches this problem.
Section 6.2.1 presents the alert valid time and the
alert states. Section 6.2.2 explains how Tempas
handles repeated alerts. We end with Section 6.2.3
presenting when Tempas attracts the user attention.
6.2.1 Alert Valid Time and Alert States
The alert valid time expresses how long the alert is
true. It can also express how much time the users
have to react to the alert. Alert states are related with
ICEIS2014-16thInternationalConferenceonEnterpriseInformationSystems
86

alert valid time. Four alert states have been defined.
“New”, the detected alert has not exceeded the alert
valid time. “Seen”, the alert system will reduce the
way how it attracts the user attention. “Handled”,
anyone took care of the alert. “Expired”, nobody
took care about the detected alert and the alert valid
time has expired. Only authorized persons can
change the alert state manually.
6.2.2 Handling Repeated Alerts
Four scenarios let end users to define if the system
has to attract, or not, the user attention. All these
scenarios apply only over two consecutive repeated
alerts
a “new” detected alert arrives during the valid time
of an old detected alert with state “handled”
a “new” detected alert arrives after the valid time
of an old detected alert with state “handled”
a “new” detected alert arrives during the valid
time of an old detected alert with state “new”
a “new” detected alert arrives after the valid time
of an old detected alert with state “expired”
6.2.3 Attracting the User Attention
A detected alert can be notified without attracting
the user attention. The four scenarios cited in the last
section can be refined by the user to attract its
attention. Four criteria are used to this purpose. First,
if the applicability index increases (by default) i.e.
the detected alert concerns more the patient. Second,
if the applicability index decreases i.e. the detected
alert concerns less the patient. Third, if the
confidence index increases (by default) i.e. users can
trust more the detected alert. Finally, if the
confidence index decreases i.e. users can trust less
the detected alert.
Hence, the detected alert using a temperature of
37.6 has a higher applicability index than using a
temperature of 37.5 (Figure 2). By default, the
system should attract the user attention.
To give the control to handle when to attract the
user attention may help to raise the trust on the alert
system.
6.3 Alert Filtering
Alert filtering, defined in the alert behavior, gives
the minimal alert quality required before
notification. The quality is represented by the
applicability and the confidence indices. A
personalized alert filtering let users to filter already
notified alerts. We see deeply these both filtering in
the next subsections.
6.3.1 Alert Behavior Filtering
The alert behavior filtering defines the minimal
required thresholds to notify an instantiated alert. All
detected alerts are stored whatever the applicability
or confidence indices. Only detected alerts with
indices superior or equal to the specified thresholds
will be notified to the specified users. To increase
the thresholds decreases the number of alerts to
notify. This decision may help to reduce the false-
positives. Therefore, to decrease the thresholds
increases the number of alerts to notify. This
decision may help to reduce the false-negatives.
These thresholds are configurable at any time to
obtain the best relation between false-positives and
false-negatives alerts.
6.3.2 User Personalized Filtering
The personalized filtering is optional and is
processed over already filtered alerts. Users may
receive many detected alerts that have not been
configured by them. Thereafter, they may disagree
with the alert configuration (defined thresholds,
activation conditions, used knowledge, etc.). The
personalized filtering is a customization and let users
to raise the alert thresholds to do not be notified of
uninteresting alerts. All the alerts can be filtered
locally except those defined as “priority alerts”.
6.4 Alert Listing
Users have access to the detected alerts that have
been notified to them. A "click over" shows the
patient information firing the alert e.g. "temperature:
37.5 °C, Blood pressure: decreasing". This
information is related to the alert activation
conditions. A "left click" shows graphically the
patient information. Graphical data representation
makes easy the trend understanding and the temporal
relations (expressed implicitly) between variables.
The graphical representation is a key to detect false
positive and true positive alerts.
By default, detected alerts in Tempas are
expressed visually. It is also possible to notify using
some kind of noise. Anyway, there are not studies
comparing the effectiveness of audible vs visual
alerts (Cvach, 2012)
The alert list is ordered by the "remaining alert
valid time" i.e. how long a medical staff can act over
the patient concerned by the alert before the alert get
an "expired" state. Tempas alerts keep the staff
informed about patients. They are not a list the task
to do.
QualityIndicesinMedicalAlertSystems
87

7 IMPLEMENTATION AND
APPLICATION
Tempas is integrated into Futura, a modular Medical
Information System (http://futura-smart-
design.catalyzis-group.com/). A Module in Futura
provides a specific functionality to users as drug
prescription, patient admission, patient vital signs
monitoring, etc. Modules are accessed using web
services. Third-party web services are used to
present functionalities different from those provided
by Futura. Tempas is a pluggable alert system. It
provides several web services for the alert
configuration and alert notification.
Futura follows a Service Oriented Architecture
(SOA) developed in .Net technologies. Business
logic is reached using RIA and WCF Services and
Silverlight is in charge of the Graphical User
Interface (GUI). Finally, data is stored in relational
databases and accessed using object-relational
mapping provided by Entity Framework. Tempas
configuration and displaying services has been
implemented following the Futura architecture.
Health structures using Futura have access to
Tempas functionalities.
Alerts evaluation is launched temporally (all the
X time units) and driven by events. Events used for
alert evaluation are defined at development and
runtime. The Inversion of Control (IoC) let Tempas
to make service proxification i.e. to intercept the
web services of interest. Intercepted services transfer
data interesting for Tempas. The Intercepted data
(from the web services) is then used to get the alerts
to evaluate. Alerts are evaluated using Prolog.
Prolog applies the rules defined as the alert
activation conditions and returns the detected alerts.
Finally detected alerts are recovered by Tempas web
services, and notified to the destination users
according to the notification and alert behaviors.
Alerts are listed into the alert-list module. Users with
the adequate rights are able to change the alert state.
Although Tempas is generic and can be adapted
to different scientific domains (building
surveillance), the medical domain is probably the
largest and widest scope; from the intensive care
units to the home care and telemedicine. At home,
the medical follow-up is always difficult because the
place is not medicalized enough. Tempas can be a
real alternative to improve the follow-up and doing
it, bring a good solution for telemedicine. The
general practitioner can customize the alert system
to every patient, adapt it to the home context and use
the patient’s expertise to customize it on demand. A
part of the further works will be devoted to that
research.
8 CONCLUSIONS AND
PERSPECTIVES
We presented Tempas: a context-aware filtered, alert
detection system, entirely customizable. Detected
alerts contain two quality indices: the applicability
index and the confidence index. The filtering
process reduces the alert desensitization. These
features make the difference among other medical
alert systems.
Tempas has been implemented and integrated in
Futura. The first feedback is good and promising.
Users (a physician and other healthcare staff) have
been able to create their own alerts, and to add new
variables to monitor.
Two experimentations are planned in the near
future. The first is to use a database with patient data
and medical staff notations to test Tempas. The
resulting alerts will be compared with the medical
staff notations. The second concerns the validation
of the whole process by users, through the
introduction of knowledge to display alerts. The
tests and users’ feedback will be essential to identify
how to improve the alert system.
A further perspective is to apply the alert system
in a ubiquitous environment.
ACKNOWLEDGEMENTS
We thank Mr. Babouchkine and Mr. Dufour
(Calystène) for sharing their experiences in the
health care application domain allowing us to obtain
a system adapted to the medical staff.
We thank the ANR Innoserv project in which the
alert system will be tested.
REFERENCES
Agrawal, R., Imieliński, T. & Swami, A., 1993. Mining
association rules between sets of items in large
databases. International conference on Management of
data - SIGMOD, 22(2), pp. 207-216.
Alsubhi, K., Aib, I. & Boutaba, R., 2012. FuzMet: a
fuzzy-logic based alert prioritization engine for
intrusion detection systems. International Journal of
Network Management, 22(4), pp. 263-284.
Anliker, U. et al., 2004. AMON: a wearable
multiparameter medical monitoring and alert system.
ICEIS2014-16thInternationalConferenceonEnterpriseInformationSystems
88

IEEE transactions on information technology in
biomedicine : a publication of the IEEE Engineering
in Medicine and Biology Society, 8(4), pp. 415-427.
Atzema, C. et al., 2006. ALARMED: adverse events in
low-risk patients with chest pain receiving continuous
electrocardiographic monitoring in the emergency
department. A pilot study. The American Journal of
Emergency Medicine, 24(1), pp. 62-67.
Bai, Y. & Wang, D., 2006. Fundamentals of Fuzzy Logic
Control — Fuzzy Sets, Fuzzy Rules and
Defuzzifications. In: Y. Bai, H. Zhuang & D. Wang,
eds. Advanced Fuzzy Logic Technologies in Industrial
Applications. London: Springer , pp. 17-36.
Borowski, M., Siebig, S., Wrede, C. & Imhoff, M., 2011.
Reducing False Alarms of Intensive Care Online-
Monitoring Systems: An Evaluation of Two Signal
Extraction Algorithms. Computational and
Mathematical Methods in Medicine.
Clark, T., 2006. American College of Clinical
Engineering. Impact of clinical alarms on patient
safety. (Online) Available at: www.acce-
htf.org/White%20Paper.pdf (Accessed 20 10 2013).
Cvach, M., 2012. Monitor Alarm Fatigue: An Integrative
Review. Biomedical instrumentation & technology /
Association for the Advancement of Medical
Instrumentation, 46(4), pp. 268-277.
Gee, T. & Moorman, B. A., 2011. Reducing Alarm
Hazards: Selection and Implementation of Alarm
Notification Systems. Patient Safety & Quality
Healthcare, 8(2), pp. 14-17.
Haimowitz, I. J. & Kohane, I. S., 1996. Managing
temporal worlds for medical trend diagnosis. Artificial
Intelligence in Medicine, 8(3), pp. 199-321.
Hudson, D. & Cohen, M., 2010. Diagnostic Models Based
on Personalized Analysis of Trends (PAT).
Information Technology in Biomedicine, IEEE
Transactions on, 14(4), pp. 941-948.
Iskio, J. et al., 2006. Improving Acceptance of
Computerized Prescribing Alerts in Ambulatory Care.
Journal of the American Medical Informatics
Association:JAMIA, 13(1), pp. 5-11.
King, A. et al., 2012. Evaluation of a smart alarm for
intensive care using clinical data. Engineering in
Medicine and Biology Society (EMBC), 2012 Annual
International Conference of the IEEE, pp. 166-169.
Korniewicz, D. M., Clark, T. & David, Y., 2008. A
national online survey on the effectiveness of clinical
alarms.. American journal of critical care : an official
publication, American Association of Critical-Care
Nurses, 17(1), pp. 36-41.
Krall, M. A. & Sittig, D. F., 2002. Clinician's assessments
of outpatient electronic medical record alert and
reminder usability and usefulness requirements..
American Medical Informatics Association (AMIA)
Annual Symposium, pp. 400-404.
Leung, C. W.-k., Chan, S. C.-f. & Chung, F.-l., 2006. A
Collaborative Filtering Framework Based on Fuzzy
Association Rules and Multiple-Level Similarity.
Knowledge and Information Systems, 10(3), pp. 357-381.
Manzi de Arantes Junior, W. & Verdier, C., 2010.
Defining quality-measurable medical alerts from
incomplete data through fuzzy linguistic variables and
modifiers. IEEE Transactions on Information
Technology in Biomedicine, 14(4), pp. 916-922.
Phansalkar, S. et al., 2010. A review of human factors
principles for the design and implementation of
medication safety alerts in clinical information
systems. Journal of the American Medical Informatics
Association:JAMIA, 17(5), pp. 493-501.
Suarez-Coloma, J.-P., Verdier, C. & Roncancio, C., 2013.
Personalized temporal medical alert system. 2nd
International Conference on Advances in Biomedical
Engineering (ICABME), pp. 69-72.
Wyckoff, M., 2009. Improving how we use and respond to
clinical alarms. American Nurse Today, 4(9), pp. 37-
39.
Zadeh, L., 1965. Fuzzy sets. Information and Control,
8(3), pp. 338-353.
Zwieg, F. H. et al., 1998. Arrhythmia detection and
response in a monitoring technician and pocket paging
system.. Progress in cardiovascular nursing, 13(1),
pp. 16-22, 33.
QualityIndicesinMedicalAlertSystems
89
