
The SITSMining Framework
A Data Mining Approach for Satellite Image Time Series
Bruno F. Amaral
1
, Daniel Y. T. Chino
1
, Luciana A. S. Romani
2
, Renata R. V. Gonc¸alves
3
,
Agma J. M. Traina
1
and Elaine P. M. Sousa
1
1
Institute of Mathematics and Computer Science, University of S
˜
ao Paulo, S
˜
ao Carlos, Brazil
2
Laboratory of New Technologies, Embrapa Agricultural Informatics, Campinas, Brazil
3
Center of Meteorological and Climate Researches Applied to Agriculture, University of Campinas, Campinas, Brazil
Keywords:
Data Mining, Multivariate Time Series, Remote Sensing, Satellite Image Time Series.
Abstract:
The amount of data generated and stored in many domains has increased in the last years. In remote sensing,
this scenario of bursting data is not different. As the volume of satellite images stored in databases grows,
the demand for computational algorithms that can handle and analyze this volume of data and extract useful
patterns has increased. In this context, the computational support for satellite images data analysis becomes
essential. In this work, we present the SITSMining framework, which applies a methodology based on data
mining techniques to extract patterns and information from time series obtained from satellite images. In
Brazil, as the agricultural production provides great part of the national resources, the analysis of satellite
images is a valuable way to help crops monitoring over seasons, which is an important task to the economy
of the country. Thus, we apply the framework to analyze multitemporal satellite images, aiming to help crop
monitoring and forecasting of Brazilian agriculture.
1 INTRODUCTION
Advances in technologies have led to a rapid increase
in the amount of data generated and stored in several
application domains. In remote sensing, large vol-
umes of complex data, such as satellite images, are ac-
quired from different kinds of orbital sensors in whole
world. In the last decade, the amount of complex data
stored in remote sensing databases has exceeded the
human capacity of manually analyze and extract use-
ful information from these databases. At the same
time, the possibility of exploiting these data in order
to obtain useful information has increased the interest
of the experts. Therefore, new methods available in
computational tools are needed to allow the analysis
of big volumes of complex data, in order to discover
valuable information and knowledge.
Satellite images have been widely used to study
land surface, such as identification of forest, water, ur-
ban areas, as well as for meteorological applications.
However, if manually performed, these studies can be
very time consuming for the experts, and therefore al-
most impracticable. To overcome this problem, many
computational techniques can be applied to perform
this analysis in feasible time.
A common approach to satellite image analysis is
to extract the pixel values from a single image and
apply data mining techniques, such as clustering or
classification, to group similar pixels or to label every
pixel of the image in order to identify areas of interest.
This approach is very used in agriculture, in which
the task consists in labeling each pixel (or a group
of pixels) of one satellite image based on its value,
aiming to identify one or more types of crop areas,
such as sugar cane or coffee.
We focus on a different approach, based on the
analysis of time series extracted from satellite image
time series (SITS), which is a sequence of satellite
images taken from the same scene. Therefore, a time
series is obtained for each pixel, such that each data
point corresponds to the pixel value in one image of
the SITS. We can thus grasp the information related
to the behavior of each area in the images along time,
and analyze it using data mining techniques, such as
clustering (Kyrgyzov et al., 2007) and classification
(Vaduva et al., 2011). The analysis of SITS using data
mining is useful in agriculture, for example, for crops
monitoring along seasons (Julea et al., 2011).
We propose a framework to allow the analysis of
time series obtained from multitemporal satellite im-
225
F. Amaral B., Y. T. Chino D., A. S. Romani L., R. V. Gonçalves R., J. M. Traina A. and P. M. Sousa E..
The SITSMining Framework - A Data Mining Approach for Satellite Image Time Series.
DOI: 10.5220/0004894002250232
In Proceedings of the 16th International Conference on Enterprise Information Systems (ICEIS-2014), pages 225-232
ISBN: 978-989-758-027-7
Copyright
c
2014 SCITEPRESS (Science and Technology Publications, Lda.)

ages through data mining methods. Initially, a dataset
is extracted from satellite imagery time series, con-
sidering a region of interest provided by the user. As
the framework uses the time series approach, for each
area of the region of interest, one or more time series
can be extracted from the satellite images. Therefore,
a real area can be analyzed based on different aspects,
such as surface temperature and vegetation index, for
example. Then, data mining tasks, such as classifi-
cation and clustering, can be applied to classify or
cluster the region of interest. Finally, the framework
provides an appropriately formatted output for the ex-
perts, that allows a proper visualization of the results,
such as spatial geographic visualization.
We also show experimental studies of applying the
framework to classify and cluster the Sao Paulo state,
Brazil, for agricultural purposes. These tests produce
useful results for the expert analysis, as they provide a
geographic visualization of the data mining output, al-
lowing the experts to identify areas such as sugarcane
crops, forest, rivers and urban areas. Also, represen-
tative time series of each pattern (class or cluster) are
returned, which are essential to understand the behav-
ior of the areas associated to the patterns, over time.
The paper is organized as follows. Section 2 gives
background concepts. In Section 3 we detail the pro-
posed framework. Experimental studies performed on
the framework basis are described in Section 4 and
Section 5 concludes the paper.
2 BACKGROUND
Temporal Data Mining. A time series can be de-
fined as ordered numeric measurements at regular
time intervals (Mitsa, 2010). A time series T =
{t
1
,...,t
i
,...,t
n
} can be univariate or multivariate. A
data point t
i
of a univariate time series is an one-
dimensional real value, i.e., t
i
∈ R. If T is a multi-
variate or multidimensional time series, each point t
i
is a D-dimensional vector, i.e., t
i
∈ R
D
, with D > 1.
Time series datasets are presented in many appli-
cation domains, and because of its ubiquity and ex-
ponentially growing size of databases in recent years,
there has been an explosion of interest in knowledge
discovery and data mining techniques for time series
analysis (Maimon and Rokach, 2005).
Nowadays, time series are used in domains such as
medicine (electrocardiograms and electroencephalog-
raphy), finances (sequences of stock values over a
period of time in stock market) and agrometeorol-
ogy (historical series of rainfall or series of crop pro-
duction). The main tasks in temporal data mining
are (Maimon and Rokach, 2005): classification, clus-
tering, prediction, indexing, summarization, anomaly
detection and segmentation. In this work, we focus
on time series classification and clustering.
Clustering is the process of grouping sets of ob-
jects based on their similarity, so that one object is
more similar to another object of the same cluster, and
less similar to an object of a different cluster, accord-
ing to a given distance function (Han and Kamber,
2000). Clustering is an unsupervised learning task,
i.e., only the dataset is necessary and no additional in-
formation about the data is needed. To perform time
series clustering, the use of a distance function com-
patible with time series is required.
Classification is a supervised or semi-supervised
learning task, which means some kind of knowledge
about the data must be provided, in most cases, by
the domain experts (Mitsa, 2010). This supervised
information corresponds to the training set, a set of
examples previously labeled. The classification pro-
cess occurs in two steps (Han and Kamber, 2000): 1)
construction of a model (or classifier) that describes a
predetermined set of classes or concepts, based on the
training set examples; 2) the model is used to classify
unlabeled objects in the dataset. In most classification
methods, a distance function is needed to calculate
distance values between objects. In most cases, if the
distance function is compatible with time series, the
method can be applied for time series classification.
Distance function is generally used to measure
the dissimilarity between two time series. One of
the most widely used is the Euclidean distance (L
2
).
Given two time series A = {a
1
,...,a
i
,...,a
n
} and B =
{b
1
,...,b
i
,...,b
n
}, L
2
is defined by:
L
2
(A,B) =
s
n
∑
i=1
(a
i
− b
i
)
2
(1)
It is important to note that the Euclidean distance
is also suitable for multivariate time series. If A and B
are multivariate time series, the Equation 1 is calcu-
lated considering data points a
i
and b
i
as multidimen-
sional vectors, instead of one-dimensional vectors.
However, Euclidean distance cannot be used to
calculate the dissimilarity between two time series
with different lengths. To overcome this problem, the
well-known Dynamic Time Warping (DTW) (Berndt
and Clifford, 1994) function seeks to calculate the
similarity between two time series by performing the
alignment among different pairs of data points. Thus,
if two time series have similar shapes but are not
aligned in the time axis, DTW can still recognize their
similarity. Since DTW calculates the distance be-
tween pairs of data points using Euclidean distance,
it can also be applied to multivariate time series.
ICEIS2014-16thInternationalConferenceonEnterpriseInformationSystems
226
Another distance function suitable for time series
of different lengths is the Longest Common Subse-
quence (LCSS) (Vlachos et al., 2003). The LCSS ob-
jective is to return the size of the longest common sub-
sequence between two time series, so that the larger
this size is, the more similar are the two time series.
Since time series are real valued, a threshold value e
is needed, and a pair (a
i
,b
i
) is considered common if
the Euclidean distance L
2
(a
i
,b
i
) < e. The LCSS can
also deal with multivariate time series.
Satellite Images. The potential of multitempo-
ral satellite images to support research of meteorol-
ogy, agricultural monitoring, environment and urban-
ism has increased according to improvements in tech-
nological development, especially in analysis of large
volume of data available for knowledge discovery.
Several satellites can be used to help the monitor-
ing and estimation of agricultural production, such
as crop area and yield estimation; climate applica-
tions as well as forecasting and weather monitoring;
and land surface study. These application have used
specially satellites which have low spatial resolution
and high temporal resolution images, for example, the
National Oceanic and Atmospheric Administration
(NOAA), with its Advanced Very High Resolution
Radiometer (AVHRR) sensor; the satellite TERRA -
Earth Observing System (EOS) with Moderate Res-
olution Imaging Spectroradiometer (MODIS) sensor;
and SPOT Vegetation (Satellite Pour l’Observation de
la Terre Vegetation).
Due to availability of daily images since 1970,
specialists have historical series and use images from
different satellites. These sensors are applied to stud-
ies of ecosystems and long time series of data have
been used to support researches in a regional scale for
a longer period of time. Additional advantages are
global coverage and free access to data. Moreover,
by combining different satellite channels it is possible
to generate synthesis images such as the Normalized
Difference Vegetation Index (NDVI) (Rouse et al.,
1973), which is strongly correlated with biomass.
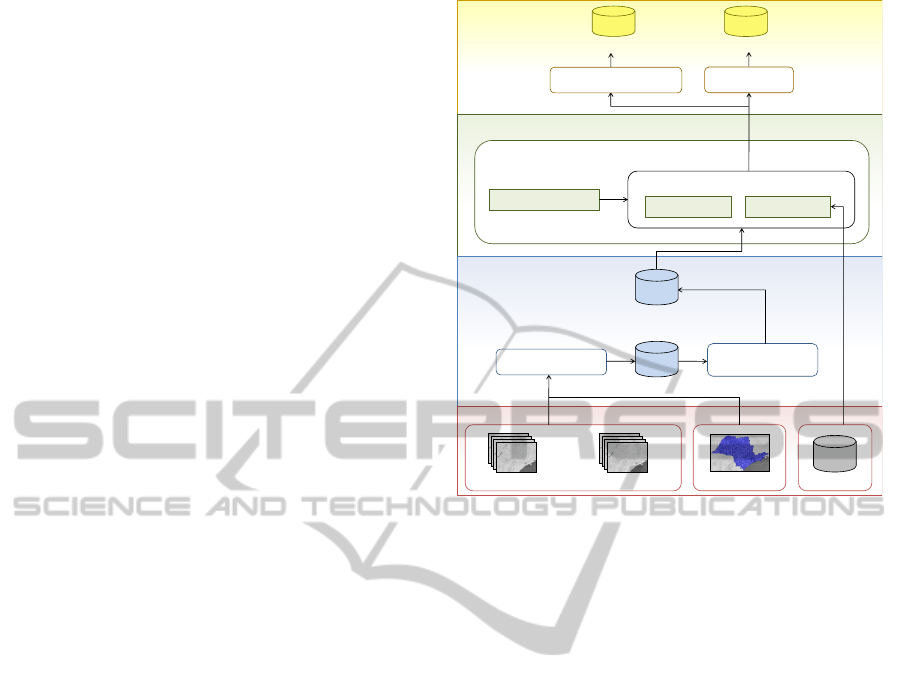
3 OUR FRAMEWORK
We propose a framework to analyze SITS using
data mining techniques. The SITSMining framework
(Satellite Image Time Series Mining) is organized
into three layers: Extraction and Preprocessing, Data
Mining and Output, as shown in Figure 1. Each layer
is composed by one or more modules, detailed in the
following sections. The framework input includes
SITS, regions of interest and training set, as follows:
• Satellite Image Time Series (SITS): a set of D
Image Time Series 1
...
Training Set
Region of Interest
Input
Image Time Series D
Extraction and
Preprocessing Layer
Data Mining Layer
Output Layer
Extraction Module
Data set
Preprocessing
Module
Preprocessed
Data set
Data Mining Module
ClassificationClustering
Distance Functions
Data Mining Methods
Spatialization Module
Profile Module
Geographic Spatial Output Profile Output
Figure 1: Framework components and data flow.
series of n satellite images. Each image must have
been already preprocessed and georeferenced to
allow further data extraction. Also, each series
should have images of the same type, ordered in
time scale and acquired in regular time intervals.
• Region of Interest: a list of p pairs of latitude
and longitude coordinates indicating the region of
interest. Each pair of coordinates references one
single pixel of image, from which the data will be
extracted. Note that the region of interest is the
same for all images of the time series.
• Training Set (for Classification Task): a set of
m elements composed by two attributes: 1) a mul-
tivariate time series and 2) a label value. Also, the
training set can hold the information of latitude
and longitude for every element, if they have been
extracted from pixels of satellite images.
Initially, the region of interest, which contains the
coordinates of the real areas we want to analyze, are
combined with the satellite image time series, so we
can identify the pixels related to those areas in each
image of the series, and extract data from them. In
the Extraction and Preprocessing Layer, the data is
extracted from the satellite images, and the dataset is
preprocessed in order to remove noises and normalize
the time series. The preprocessed dataset is then sent
to the Data Mining Layer, where the data mining anal-
ysis is performed. It is important to note that the train-
ing set, given as input will only be used in the Data
Mining Layer. Finally, the Output Layer receives the
TheSITSMiningFramework-ADataMiningApproachforSatelliteImageTimeSeries
227

t
1
2
n
Extraction and Preprocessing Layer
1 -22.300881 -52.660943 ...
2 -21.065848 -48.476518 ...
p -22.878558 -44.470575 ...
...
...
...
...
...
...
ID
...
Multivariate
Time Series
...
...
...
...
...
...
Extraction Module
Index Values Extraction
Dataset Creation
Preprocessing Module
Noise Treatment
Time Series Normalization
Dataset
t
t
t
3
Latitude Longitude
T1 T2
...
TD
Figure 2: Extraction and Preprocessing Layer modules and the dataset structure.
data mining results and yields formatted outputs that
allow useful visualization of the discovered patterns,
such as spatial visualization of clusters.
3.1 Extraction and Preprocessing Layer
The Extraction and Preprocessing Layer consists of
two main modules, as illustrated in Figure 2: 1) ex-
traction module and 2) preprocessing module.
The extraction module is responsible for extract-
ing the real valued time series from the input SITS
and building the dataset that will be used along the en-
tire framework. Each dataset element is created based
on one pair of coordinates of the region of interest,
by extracting data from the pixel referenced by these
coordinates, in all images of the series. For all el-
ements, one real value is obtained from each image
given as input, and these values are organized as time
series. The time series data points extracted from the
image series are calculated using indices, such as veg-
etation indices. This extraction can be performed us-
ing softwares such as ENVI
1
or libraries that work
with geospatial data, such as GDAL
2
.
The index to be used depends on the type of satel-
lite image analyzed, and should be provided by ex-
perts in the domain of application.
The attributes of each element are (Figure 2):
• Id: an integer value used to identify the element
in the dataset.
• Latitude: the latitude coordinate of the area rep-
resented by the selected pixel.
• Longitude: the longitude coordinate of the area
represented by the selected pixel.
• Multivariate Time Series: a multivariate
time series is extracted from the SITS:
1
http://www.exelisvis.com
2
http://www.gdal.org/
T = {t
1
,...,t
i
,...,t
n
}, with i ∈ [1,n], in which
t
i
correspond to a D-dimensional vector, whose
data points t
i j
, j ∈ [1,D], indicates the value of
the selected pixel in the image i of the SITS j.
After building the dataset, the data is forwarded
to the preprocessing module. In satellite images, the
occurrence of noise caused by failures in the measure-
ment process, or presence of clouds over the area of
interest is very common and even expected by the ex-
perts. In the resulting time series t
i
, noise can be read
as a very high or low unusual real value, or a spe-
cific value returned by the sensor, that indicates the
reading error. Here, we are interested in replacing the
noise with valid values instead of removing it, so we
can keep the corresponding time series complete. In
this case, one possible approach is to use a technique
to fill in the noisy value with an estimate (Keogh and
Pazzani, 1998).
Another issue treated in the preprocessing mod-
ule is the time series normalization. Since each image
time series may have been defined by a different type
of image, the extraction of the corresponding indices
may result in time series with distinct ranges of val-
ues. Thus, all time series values are normalized, mak-
ing them comparable when using a distance function
appropriate to multivariate time series.
In some studies (Freitas et al., 2011), outliers de-
tection and smoothing techniques are applied to re-
place outliers by new values that fit under a smoother
time series or function. In our framework, we main-
tain these outliers, because in some domains of appli-
cation, the uncommon behavior of the original time
series extracted from the satellite images can be use-
ful to the data mining analysis, such as clustering or
classification.
ICEIS2014-16thInternationalConferenceonEnterpriseInformationSystems
228

Data Mining Layer
Data Mining Module
Clustering Methods
Classification Methods
Supervised Classification
Semi-supervised Classification
Distance Functions
Figure 3: Data Mining Layer and its components.
3.2 Data Mining Layer
Initially, in the Data Mining Layer, two data mining
tasks are implemented: clustering and classification.
Each task has a specific submodule and allows the ad-
dition of new data mining algorithms at anytime. Fig-
ure 3 illustrates the data mining module.
The classification submodule includes supervised
and semi-supervised classification methods. Despite
the differences between these two classification ap-
proaches, both receive the dataset and the training set
as input, and assign a label value to each dataset ele-
ment, corresponding to its class value. In the cluster-
ing analysis, only the dataset is needed as input, and
the output yielded indicates the cluster each dataset
element is assigned to.
Most classification and clustering methods require
a distance function to calculate the dissimilarity be-
tween pairs of objects. In our framework, the dis-
tance functions need to be compatible with multi-
variate time series, such as the Euclidean distance,
DTW and LCSS. Other multivariate time series dis-
tance functions can be added in the distance function
submodule at anytime.
3.3 Output Layer
The data mining results are sent to the Output Layer,
where they are transformed into two different types of
formatted output: spatial visualization (spatialization
module) and profile visualization (profile module), as
shown in Figure 4.
The spatialization module produce an output that
allows a geographic spatial visualization of the re-
sults, in which each pixel of the region of interest
is plotted based on its latitude and longitude values,
and colored according to the label assigned to it in
the data mining process (the label could be a cluster
or class value). Therefore, the output of the spatial-
ization module is a set of p elements, with three at-
tributes: 1) latitude; 2) longitude; and 3) label. This
visualization is useful to the experts analysis, because
they are able to view the geographic spatial display of
the patterns found in the data mining process.
In the profile module, for each cluster or class
present in the data mining results, the objective is to
Output Layer
Spatialization Module
Profile Module
Class 1 ...
...
...
...
...
...
Label
...
...
...
...
...
-22.300881 -52.660943 Class 2
-21.065848 -48.476518 Class 1
-22.878558 -44.470575 Class 3
...
...
...
Latitude
Representative multivariate time
series for pattern ‘Class C’
Class 2 ...
Class C ...
t
1
2
n
Multivariate Time
Series
t
t
t
3
T1
T2
...
TD
Longitude
Label
Figure 4: Output Layer modules and the output structure.
plot a representative time series profile. In the clus-
tering analysis, a representative profile to the cluster
could be its centroid or medoid, or an average valued
time series for each class, in the classification case.
To provide this type of visualization, the output must
hold, for each pattern, the label related to it, and the
multivariate representative time series calculated for
this pattern. Figure 4 shows the structured outputs
yielded by the two modules of the Output Layer.
A SITSMining framework prototype is being de-
veloped as an extension of the SatImagExplorer sys-
tem, a tool to extract time series from a SITS, analyze
these temporal data and visualize the results geospa-
tially (Chino et al., 2011). The SatImagExplorer sys-
tem was developed using C++ and the Qt framework
3
,
and is organized in a modular architecture. Once the
tool provides the extraction and visualization func-
tions, we intend to implement the SITSMining frame-
work into the SatImagExplorer system, so the entire
process, as well as the input and output of the frame-
work can be handled under the same platform.
As the current version of the SatImagExplorer al-
lows the user to open only one sequence of satel-
lite images to the extraction of time series, it yields
one univariate time series per coordinate of the im-
ages. Thus, the tool is currently limited to the one-
dimensional time series case. We aim to extend the
tool features, in order to allow the extraction of mul-
tidimensional time series from many satellite image
time series. In the next section, we show experiments
based on the SITSMining framework and its current
prototype implemented in SatImagExplorer.
4 EXPERIMENTAL RESULTS
We performed experimental studies in order to show
the utility of the proposed framework analysis and its
applicability to real domains such as agriculture. For
3
http://qt.digia.com
TheSITSMiningFramework-ADataMiningApproachforSatelliteImageTimeSeries
229
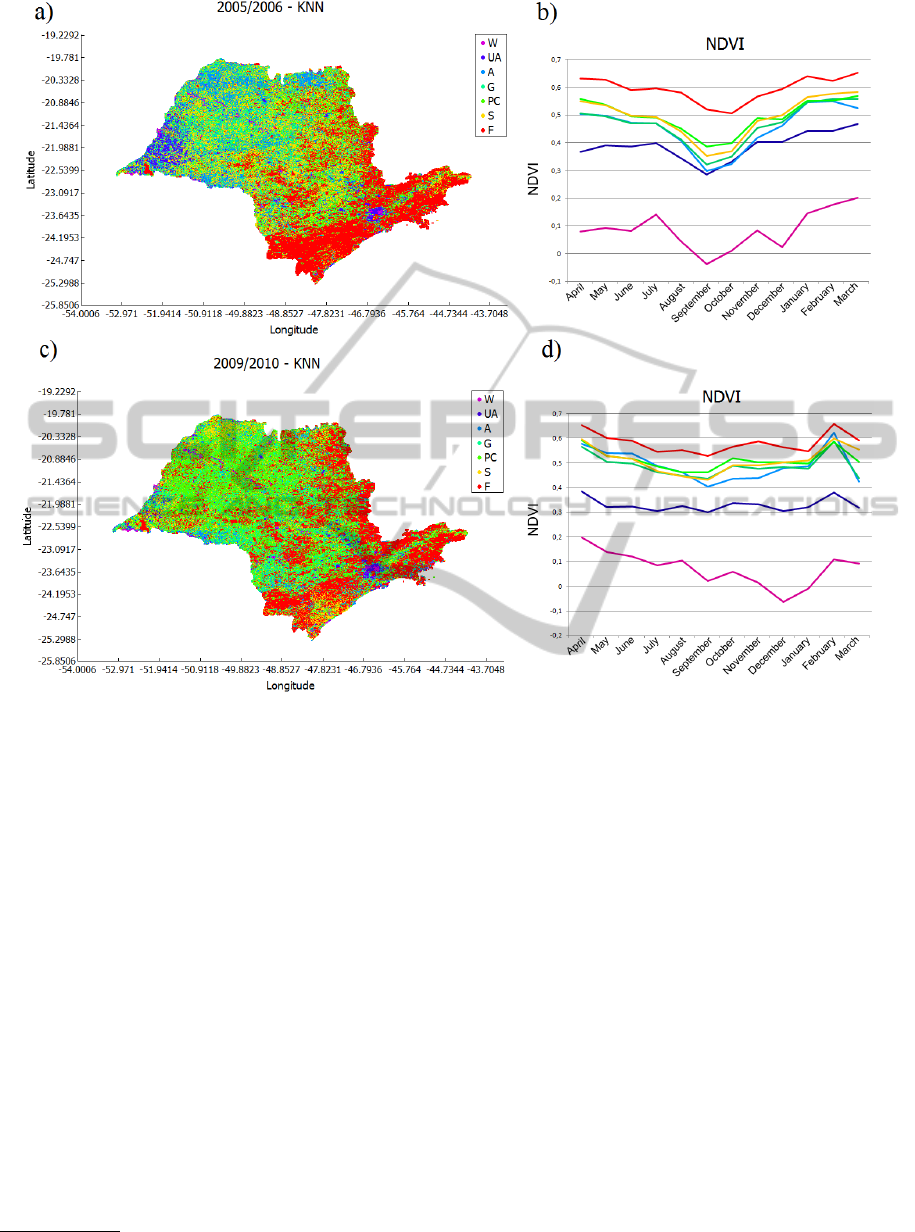
Figure 5: Geographic spatial and profile visualization of classification results.
the data mining analysis, two traditional algorithms,
K-Means and KNN (K-Nearest-Neighbors) (Han and
Kamber, 2000), were used. It is important to note that
the objective of the experiments was not to perform a
comparison between the algorithms, but to show the
potential of the data mining analysis combined with
the SITSMining framework.
The satellite images we studied were generated
by AVHRR sensors, aboard of NOAA satellites, and
have low spatial resolution, each pixel corresponding
to a 1km
2
real area. The region of interest is com-
posed by 220,238 pairs of coordinates and refers to
the Sao Paulo state, Brazil.
Three types of AVHRR/NOAA images were con-
sidered
4
: NDVI, Albedo and Surface Temperature.
The NDVI is a vegetation index widely used in agri-
culture, because it indicates biomass values of a given
area. In forest areas, for example, NDVI values are
usually very high, in contrast to urban or soil areas,
that present low NDVI. Albedo measures the level of
4
Satellite images provided by CEPAGRI-UNICAMP.
light reflectivity of a given area (Csiszar and Gutman,
1999). Considering these three satellite image time
series, two experiments were performed:
• Experiment 1: classification of one-dimensional
(univariate) time series datasets, extracted from
NDVI SITS, using algorithm KNN with DTW.
• Experiment 2: clustering of two-dimensional
(multivariate) time series datasets, extracted from
Albedo and Surface Temperature SITS, using al-
gorithm K-Means with DTW.
For each experiment, two datasets were used,
considering two different sugarcane crop seasons:
2005/2006 and 2009/2010. For each season, twelve
monthly satellite images were considered, corre-
sponding to a one-year period, totalizing 12 data
points for each time series, from April to March.
In the first experiment, as required for the classifi-
cation task, we used a training set provided by experts
in agrometeorology, containing 65 examples of 7 dif-
ferent types of areas:
• Water (W): 6 examples.
ICEIS2014-16thInternationalConferenceonEnterpriseInformationSystems
230
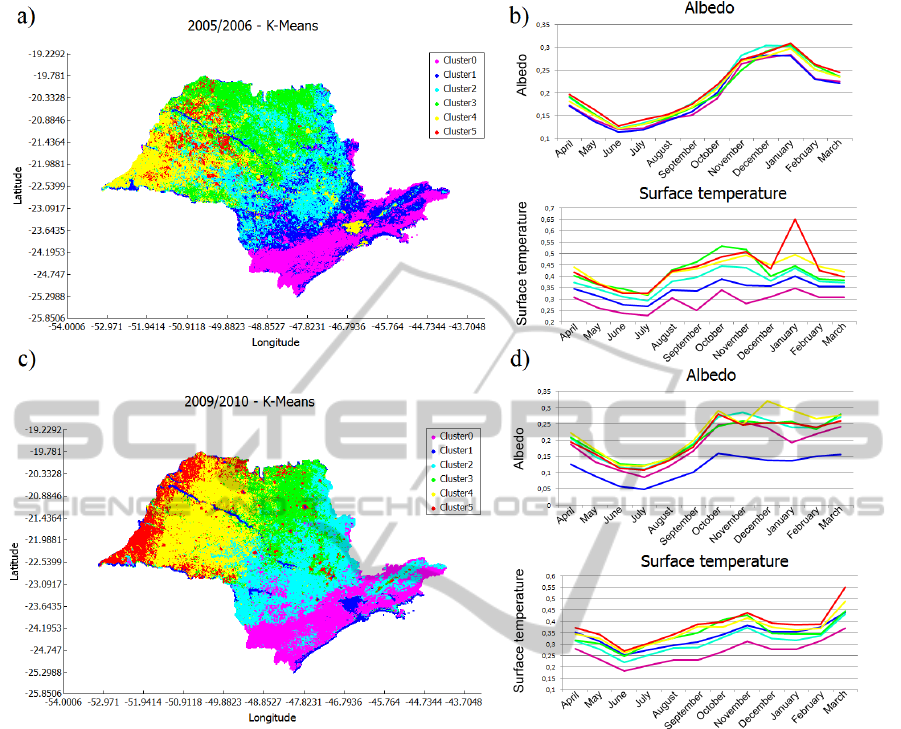
Figure 6: Geographic spatial and profile visualization of clustering results.
• Urban area (UA): 10 examples.
• Agriculture (A): 9 examples.
• Grassland (G): 14 examples.
• Perennial Crop (PC): 9 examples.
• Sugarcane (S): 8 examples.
• Forest (F): 9 examples.
Besides the class (or label) value, the training
set examples have the same attributes as the dataset
NDVI elements, which contains a pair of coordinates
(latitude and longitude) and a one-dimensional NDVI
time series of length 12. Figure 5 illustrates the clas-
sification results of the first experiment. The spatial
geographic visualization of the labeled areas in Sao
Paulo state is shown in Figure 5a) and c) and the pro-
file visualization is shown in Figure 5b) and d) for the
2005/2006 and 2009/2010 season, respectively. The
average time series of each class were chosen as rep-
resentative for the profile visualization.
In the classification analysis, Forest (F), Urban
area (UA) and Water (W) areas were correctly la-
beled, according to the experts. Most of the Atlantic
Forest, located near to the Sao Paulo state coast (at
southeast) was assigned to the Forest class, repre-
sented by the red colored pixels of the spatial geo-
graphic visualization. As forests have high concen-
tration of vegetation and biomass, these areas present
elevated NDVI values the whole season, as shown by
the red colored representative time series, in the pro-
file visualization. On the other hand, urban and wa-
ter areas, represented by the purple and pink profiles,
present low NDVI values along the entire year due to
their lack of vegetation concentration.
The classification results for the tillable areas
(Agriculture, Perennial crop and Sugarcane) and
Grassland were less accurate, probably because dif-
ferent crops present similar NDVI values at some
phase in the vegetative crop cycle. According to the
experts, even with some labeling mistakes, the clas-
TheSITSMiningFramework-ADataMiningApproachforSatelliteImageTimeSeries
231

sification analysis is useful because it was possible
to separate agricultural areas from non-agricultural,
such as water, forest and urban areas.
In the second experiment, we performed the clus-
tering analysis of the same datasets. The spatial geo-
graphic visualization of the clustering results is shown
in Figure 6a) and c) and the profile visualization is
shown in Figure 6b) and d). The representative time
series chosen were the centroid of each cluster.
According to the experts, the Albedo variable was
useful to separate water areas from the other targets,
but was not sufficient to distinguish areas with differ-
ent vegetation cover. The clustering of the other areas
was defined mainly by the Surface Temperature vari-
able, being higher for targets with lower canopy, for
example, urban areas and exposed soil, and lower for
forest regions, such as the Atlantic Forest areas. The
cluster configuration varied from year to year because
the weather also varied over the last decade, influenc-
ing the values of Surface Temperature.
5 CONCLUSION
This paper presented the SITSMining framework, an
automated solution to data mining based analysis of
satellite image time series. As the need for knowledge
discovery in large remote sensing databases grows,
the framework is shown as a powerful computational
tool for the experts, as it provides resources such as
data extraction from multitemporal satellite images,
analysis of large datasets through data mining tech-
niques and output formatting in an integrated environ-
ment. Because of its modular architecture, the frame-
work allows the addition of new methods for noise
replacement, classification and clustering based anal-
ysis, output formatting, as well as the incorporation
of new data mining task modules.
The experimental analysis performed shows that
the framework is useful to support researches in agri-
culture domain of application, even considering low
spatial resolution satellite images. In future work, we
aim to fully integrate the SITSMining framework to
the SatImagExplorer tool, to provide for the experts
in agrometeorology, the possibility to perform extrac-
tion of time series from multitemporal satellite im-
ages, data mining analysis and output visualization in
an integrated system under the same platform.
ACKNOWLEDGEMENTS
We thank to CNPq, FAPESP, CAPES, Embrapa-
Campinas for financial support.
REFERENCES
Berndt, D. and Clifford, J. (1994). Using dynamic time
warping to find patterns in time series. In AAAI Work-
shop on Knowledge Discovery in Databases, pages
359–370, Seattle - Washington.
Chino, D. Y. T., Amaral, B. F., Romani, L. A. S., Sousa, E.
P. M., and Traina, A. J. M. (2011). Satimagexplorer:
tornando a minerac¸
˜
ao de dados de sensores orbitais
mais flex
´
ıvel. In VIII SBBD, pages 25–30, Brasil.
Csiszar, I. and Gutman, G. (1999). Mapping global land
surface albedo from noaa avhrr. Journal of Geophysi-
cal Research, 104(d6):6215–6228.
Freitas, R. M., Arai, E., Adami, M., Souza, A. F., Sato, F. Y.,
Shimabukuro, Y. E., Rosa, R. R., Anderson, L. O., and
Rudorff, B. F. T. (2011). Virtual laboratory of remote
sensing time series: visualization of modis evi2 data
set over south america. Journal of Computational In-
terdisciplinary Sciences, 2(1):57–68.
Han, J. and Kamber, M. (2000). Data Mining: Concepts
and Techniques. Morgan Kaufmann, San Francisco.
Julea, A., M
´
eger, N., Bolon, P., Rigotti, C., Doin, M.-P.,
Lasserre, C., Trouv
´
e, E., and Lazarescu, V. N. (2011).
Unsupervised spatiotemporal mining of satellite im-
age time series using grouped frequent sequential pat-
terns. Geoscience and Remote Sensing, IEEE Trans-
actions on, 49(4):1417–1430.
Keogh, E. J. and Pazzani, M. J. (1998). An enhanced repre-
sentation of time series which allows fast and accurate
classification, clustering and relevance feedback. In
KDD 1998, volume 98, pages 239–243.
Kyrgyzov, I. O., Maitre, H., and Campedel, M. (2007). A
method of clustering combination applied to satellite
image analysis. In Image Analysis and Processing,
2007. 14th International Conference on, pages 81–86.
Maimon, O. and Rokach, L. (2005). The Data Mining and
Knowledge Discovery Handbook. Springer.
Mitsa, T. (2010). Temporal Data Mining. Chapman &
Hall/CRC, 1st edition.
Rouse, J. W., Haas, R. H., Schell, J. A., and Deering, D. W.
(1973). Monitoring vegetation systems in the Great
Plains with ERTS, volume 1, pages 309–317. NASA.
Vaduva, C., Costachioiu, T., Patrascu, C., Gavat, I.,
Lazarescu, V., and Datcu, M. (2011). Classification of
dynamic evolutions from satellitar image time series
based on similarity measures. In Analysis of Multi-
temporal Remote Sensing Images (Multi-Temp), 2011
6th International Workshop on the, pages 141–144.
Vlachos, M., Hadjieleftheriou, M., Gunopulos, D., and
Keogh, E. (2003). Indexing multi-dimensional time-
series with support for multiple distance measures. In
KDD 2003, pages 216–225, New York.
ICEIS2014-16thInternationalConferenceonEnterpriseInformationSystems
232
