
New Approaches for Geographic Location Propagation in Digital
Photograph Collections
Davi Oliveira Serrano de Andrade
1
, Hugo Feitosa de Figueirêdo
1,2
, Cláudio de Souza Baptista
1
and Anselmo Cardoso de Paiva
3
1
Department of Systems and Computation, University of Campina Grande, Campina Grande, Paraíba, Brazil
2
Federal Institute of Education, Science and Technology of Paraíba, Campus Monteiro, Monteiro, Paraíba, Brazil
3
Department of Informatics, Federal University of Maranhão, São Luís, Maranhão, Brazil
Keywords:
Geotag, Photograph Metadata, Geotag Propagation, Digital Photograph Collection.
Abstract:
The integration of GPS in smartphones, tablets and digital cameras becomes more present, resulting in a large
amount of multimedia files. As GPS receivers may not work well indoors, this problem may generate incorrect
locations, very distant from the real location where the picture was taken, or even generate no location at all.
So, to deal with these inconsistencies, this work proposes two novel location propagation techniques. These
techniques were validated through a comparative analysis with two other techniques. Some metrics were used
to validate the techniques: precision, recall and accuracy in the photographs location propagation. The results
prove that the correct choice for location propagation technique depends on the importance of each metric and
on the system user profile. Besides the choice of the correct technique, we also show that the order of the
photographs that will receive the location propagation must be random.
1 INTRODUCTION
The technological advances in the last years have al-
lowed a widespread of electronic devices, such as:
digital cameras, smartphones and tablets. As a result,
people produce a large amount of multimedia files,
hindering the task of annotation and cataloging such
files. For example, manually organizing a collection
with thousands of photographs taken during a vaca-
tion trip is a very costly task.
Many approaches (Figueirêdo et al., 2012a; Naa-
man et al., 2004; Cooper, 2011; Tsay et al., 2009)
have been suggested for automatic organization of
photographs in order to reduce users’ effort. Such
systems use information contained in the metadata of
the photographs to help their automatic organization.
The metadata information used include date, time, ge-
ographic location and tags.
Some studies point that the place where the pho-
tograph was taken is one of the first things that peo-
ple remember when they want to retrieve that photo-
graph (Naaman et al., 2004). This implies that the
geographic location of the camera at the moment that
the picture was taken is very important for the pho-
tographs organization process.
As time passes, the integration of GPS to smart-
phones, tablets and digital cameras becomes more and
more present, allowing the automatic storage of the
geographic location of the photographs in their meta-
data. Nevertheless, GPS receivers do not work well
indoors, with the possibility of generating no informa-
tion at all. Moreover, it takes a few moments for the
receiver to obtain the signal indicating the geographic
location of the photograph. If the signal is not cap-
tured, the camera will not georeference the picture, or
will use the location of the last one, which will prob-
ably be incorrect. Some smartphones use the A-GPS
(Djuknic and Richton, 2001) technology in order to
minimize these problems, but the locations indicated
may be very distant from the actual position where the
photograph was taken.
In order to optimize the task of organizing user’s
photographs, geographic information is needed. The
use of GPS allows the easy obtainment of the loca-
tion of the photographs, but the failures of the receiver
give the user an extra work. Manually correcting fail-
ures caused by the GPS receiver is a hard task, and for
this reason some location predicting techniques and
geotag propagation techniques were developed (Hays
and Efros, 2008; Ivanov et al., 2012; Gong et al.,
92
Oliveira Serrano de Andrade D., Feitosa de Figueirêdo H., de Souza Baptista C. and Cardoso de Paiva A..
New Approaches for Geographic Location Propagation in Digital Photograph Collections.
DOI: 10.5220/0004895000920099
In Proceedings of the 16th International Conference on Enterprise Information Systems (ICEIS-2014), pages 92-99
ISBN: 978-989-758-029-1
Copyright
c
2014 SCITEPRESS (Science and Technology Publications, Lda.)

2011; Gao et al., 2012; Lacerda et al., 2013).
Aiming at the need for reducing the efforts in-
volved in the geographic annotation task, the main
contributions of this work are:
• The Trajectory technique: uses the photograph
owner’s trajectory;
• The Shared Events technique: uses shared events
captured by distinct cameras;
• A comparative analysis between the proposed
techniques and two existing propagation tech-
niques: Temporal Clustering and Social Correla-
tion, where the first one is the reproduction of the
work by Lacerda et al. and the second one re-
produces the work by Gong et al. (Lacerda et al.,
2013; Gong et al., 2011).
The comparison is performed through an experiment,
concerning the following metrics: precision, recall
and accuracy. To the best of our knowledge, there has
not been done an analysis comparing the geotag prop-
agation techniques in the literature yet. The experi-
ments show that the four studied techniques present
good results for different scenarios. So, the most suit-
able propagation technique will depend on the nature
of data and on users’ profile.
The rest of this paper is organized as follows. In
Section 2 we discuss some related works. In Section 3
we focus on two new technique for photograph loca-
tion propagation and present two existing techniques
used to validate the proposed ones. Section 4 de-
scribes the database, the metrics used, and the way
the techniques were compared. Section 5 presents
and discusses the results. Finally, Section 6 presents
the conclusions and discuss further work to be under-
taken.
2 RELATED WORK
In this section we present some works related to the
problem of annotating geographic location into pho-
tographs. The related works are organized as follows:
concerned with the prediction of the users’ location;
concerned with the use of textual tags; works that deal
with image processing; and finally works that deal
with the propagation of geotags.
Gong et al. work to predicting the location of peo-
ple in order to improve mobile phone services (Gong
et al., 2011). The proposed idea used a social corre-
lation model to predict the location of people based
on the location of their personal contacts. Due to the
simplicity of this model, it is possible to adapt it for
use in the context of digital photograph collections.
Gao et al. address the problem of predicting the
location as a whole in order to overcome problems
such as traffic planning and directed advertising (Gao
et al., 2012). The authors proposed a model to predict
user location based on a visitation record taking the
spatiotemporal context into account. Despite the sim-
plicity of the model, the idea is not simple considering
geotags described as latitude and longitude.
Hays and Efros proposed an algorithm called
“im2gps”, that estimates the geographic location of a
photograph based on the geographic location of other
images with high visual similarity (Hays and Efros,
2008). Ivanov et al. proposed the propagation of
geotags based on the combination of detection of re-
peated objects and user’s trust modeling (Ivanov et al.,
2012). The idea is the propagation of geotags using
other photographs with geotags.
These approaches (Hays and Efros, 2008; Ivanov
et al., 2012) can become complicated when applied to
personal photograph collections, since many times the
people present in the image occupy the larger area of
the picture. Considering the people do not represent
a location, the ideas of visual similarity and detection
of repeated objects are threatened.
Hollenstein and Purves suggest that the geo-
graphic location must be defined by the manner in
which the users describe the place instead of lati-
tude and longitude (Hollenstein and Purves, 2013).
Tags like “Cristo Redentor”(“Christ the Redeemer”)
should be added to the location. The use of tags re-
lated to the geographic location is unreliable when the
tags are defined by the user, and are also hard to pro-
pose when not defined by the user.
Lacerda et al. focus on inconsistencies in the loca-
tions of photographs as well as in the propagation of
locations. The proposed idea uses a temporal cluster-
ing to find the location based on the temporally closer
photograph (Lacerda et al., 2013).
CrEve (Zigkolis et al., 2012) is a collaborative
event annotation framework that used the content of
photographs found in social media sites. One of
the themes approached is the inconsistency of pho-
tographs metadata, but the user must create an event
using social media, and this framework does not focus
on personal photographs.
The present work proposes two propagation tech-
niques and performs a comparison between the pro-
posed techniques and two existing ones.
3 PROPAGATION TECHNIQUES
For all the techniques that will be explained, consider:
• U: the set of users;
NewApproachesforGeographicLocationPropagationinDigitalPhotographCollections
93

• u: a person in U;
• F
P
: the set of all photographs of a person P;
• FC
P
: the set of all photographs that are not in F
P
and where the person P appears;
• F
P
i
: a photograph in F
P
represented by a tuple in
the form <geo, h, d, dh>, where "geo" is the longi-
tude and latitude of the photograph, "h" the hour
of the day, "d" is the day of the week in which the
photograph was taken and "dh" is the exact date
and time in which the photograph was taken;
• FC
P
i
: is a photograph in FC
P
with the same struc-
ture of F
P
i
;
• dif(d1,d2): the function that computes the differ-
ence, in hours, between two dates;
• LT: time threshold with value of 24 hours;
• LS: similarity threshold between events with
value 60%.
3.1 Existing Techniques Analysed
In this subsection we explain the two techniques used
to validate the two proposed ones: Temporal Cluster-
ing and Social Correlation. Temporal Clustering, as
the name suggests, creates temporal clusters of pho-
tographs to find the location where the photograph
was taken. Social Correlation finds the location based
on the location of the most correlated contact of the
user. Next we present the formalization of both tech-
niques.
3.1.1 Temporal Clustering
The Temporal Clustering technique (Lacerda et al.,
2013) makes a temporal segmentation in F
u
using a
time t
max
, in minutes, passed as parameter. Consider-
ing t
max
, the technique will separate F
u
in k clusters
of photographs. So, a cluster g
j
is a single subset of
F
u
such that:
k
[
j=1
g
j
!
= F
u
(1)
The clusters have photographs with temporal dis-
tances smaller than or equal to t
max
minutes, consid-
ering consecutive photographs, and can be defined in
the following way:
f
1
∈ g
1
; (2)
f
i+1
∈ g
s
i f (t
i+1
−t
i
) ≤ t
max
; (3)
f
i+1
∈ g
s+1
i f (t
i+1
−t
i
) > t
max
. (4)
For each cluster g
j
, the iteration will search for
photographs that have no location. For each photo-
graph with no location, it is sought a photograph F
u
j
with location that is temporally closer in the same
cluster of F
u
i
and then the location of F
u
j
is propagated
to F
u
i
.
3.1.2 Social Correlation
The Social Correlation technique (Gong et al., 2011)
uses the geographic locations of possible neighbors
to find the location of the user in the exact moment
where the photograph was taken.
Before finding the location of a photograph, we
need to find the person who has the highest social cor-
relation with the user who took the photograph F
u
i
.
Let Q
u
j
u
i
be the number of photographs in which the
user u
i
and the user u
j
appear. The correlation be-
tween the user i and the user j is R
u
j
u
i
, defined as fol-
lows:
R
u
j
u
i
=
Q
u
i
u
j
Q
u
j
u
i
(5)
This way, R
u
j
u
i
, indicates the percentage of pho-
tographs in which the user u
j
participates with respect
to the photographs of the user u
i
. Let C
u
be the set of
neighbor contacts of a user u. Considering that we
will suggest the location of a photograph F
u
i
, we must
find the contact u with the highest social correlation
and who has at least one photograph inside LT, con-
sidering F
u
i
. We have:
∀ j ∈ C
u
→ R
j
u
≤ R
u
u
; (6)
∃F
u
x
∈ F
u
| di f (dh(F
u
x
), dh(F
u
i
)) ≤ LT. (7)
Let before(v,F
u
i
) be the function that finds the last
photograph taken before F
u
i
in which the neighbor v
appears and let after(v,F
u
i
) be the function that finds
the first photograph taken after F
u
i
where the neighbor
v appears. These two functions look for a photograph
in LT with respect to the photograph passed as param-
eter, and in the case the photograph does not exist,
returns empty. So, the social correlation is defined as:
CS
u
i
= Centroid(be f ore(u, F
u
i
), a f ter(u, F
u
i
),
be f ore(u, F
u
i
), a f ter(u, F
u
i
)); (8)
3.2 Proposed Techniques
In this subsection we explain the Trajectory and the
Shared Events techniques. The first one follows the
ICEIS2014-16thInternationalConferenceonEnterpriseInformationSystems
94
idea that a user keeps a straight trajectory between a
previous photograph and the next one. The second
technique uses the idea that the photographs belong-
ing to a same event are in the same geographic area.
The photographs used in the experiment contain the
following information for using the techniques: date
and time, geographic location and annotated people.
3.2.1 Trajectory
Lacerda et al. proposes the use of the speed of the
user to find inconsistencies in the locations of the
photographs (Lacerda et al., 2013). Inspired in the
idea of the users’ speed, the Trajectory technique as-
sumes that the trajectory between known locations is
a straight line to propagate the location by means of
this trajectory. If the technique is trying to find a lo-
cation for a photograph present in the collection of a
user u, named F
u
i
, it uses the trajectory of user u and
the trajectory of all contacts present in a photograph
F
u
i
. Let F be the set of all photographs in the image
database, and F
i
∈ F is a photograph that we want to
compute the location.
Consider for each person P present in F
i
:
FA
P
= F
P
∪ FC
P
(9)
We may decompose FA
P
into two subsets:
• FA
P
geo
: the set of all photographs in FA
P
that have
a geographic location;
• FA
P
noGeo
: the set of all photographs in FA
P
that do
not have a geographic location;
To propagate a geographic location for the photo-
graph F
i
∈ FA
P
noGeo
we must find the photographs f
∗
1
and f
∗
2
where:
f
1
, f
2
∈ FA
P
geo
; (10)
dh( f
1
) < dh(F
i
); (11)
dh( f
2
) > dh(F
i
); (12)
di f (dh( f
1
), dh(F
i
)) ≤ LT ; (13)
di f (dh( f
2
), dh(F
i
)) ≤ LT ; (14)
f
∗
1
= MIN(dh(F
i
) − dh( f
1
)); (15)
f
∗
1
= MIN(dh( f
2
) − dh(F
i
)); (16)
To compute the possible location geo
P
for F
i
con-
sidering the trajectory of P, we use a linear interpola-
tion based on:
z =
dh(F
i
) − dh( f
∗
1
)
dh( f
∗
2
) − dh( f
∗
1
)
; (17)
geo
P
= f
∗
1
.(1 − z) + f
∗
2
.z; (18)
The linear interpolation does not consider earth’s
curvature, but it is used for small distances, so the
error will be not relevant.
We repeat this process for each person P in F
i
and
compute the location of F
i
as the centroid of the set
composed by all geo
P
finded.
3.2.2 Shared Events
The work by Figueirêdo et al. proposes a technique
for detection of event in digital photographs captured
by distinct cameras (Figueirêdo et al., 2012b). The
detection of events separates all the possible events in
the collection of photographs and computes a similar-
ity index between these events. We define:
• E : the set of all events;
• E
u
i
∈ E: the event, owned by the user u, that con-
tains the photograph F
u
i
;
• SM
u
i,k
, which represents the similarity between the
events E
k
and E
u
i
;
• EC ⊂ E: the set of all events that have SM
u
i,k
≥ LS;
• FE: the set of all photographs with geographic
location in all events of EC;
It is proposed the use of these events found by
the work of Figueirêdo et al. to find the location
of the photograph F
u
i
, assuming that the photographs
present in a same event are in a short distance. To
propagate a geographic location for the photograph
F
U
i
we need to find the photograph p
∗
where:
p ∈ FE; (19)
p
∗
= MIN(di f (dh(p), dh(F
u
i
))); (20)
The geographic location of p
∗
is propagated to F
u
i
.
3.3 Examples
In this subsection we expose an example for each of
the proposed techniques. First we present an exam-
ple for the Trajectory technique and then we show an
example for the Shared Events technique.
3.3.1 Trajectory
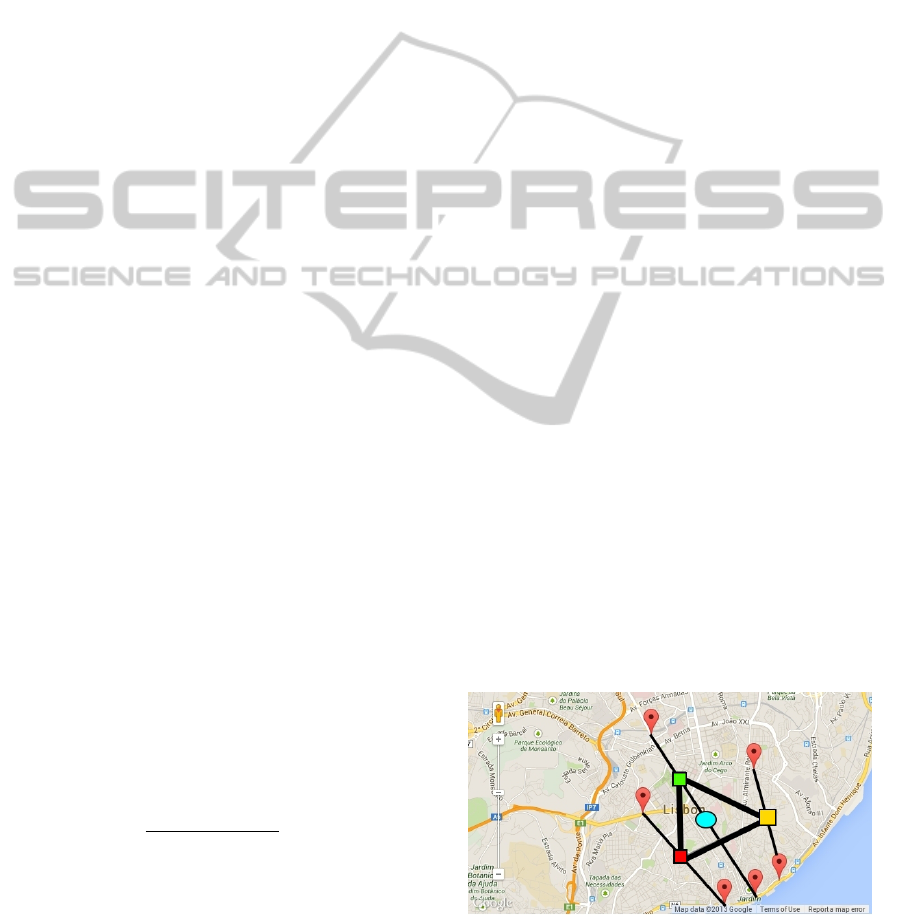
Figure 1: Trajectory Example.
Considering that some friends took photographs in
Lisbon and that only one of the photographs is miss-
ing the location. People p1, p2, p3 and p4 appear in
NewApproachesforGeographicLocationPropagationinDigitalPhotographCollections
95

F
u
i
, the missing location photograph, but only p1, p2
and p3 have a related trajectory in T
u
i
. Figure 1 shows
the trajectories of p1, p2 and p3 as a straight black
line between the markers. The triangle’s vertices are
the possible locations related to the trajectories. The
point inside the triangle would be the centroid of all
the possible locations, and that point is the location
propagated.
3.3.2 Shared Events
Two friends, f1 and f2, went to a 5 hours party. The
first likes to take several photographs and the sec-
ond just likes to picture the highlight moments of the
party. Supose the photographs taken by f2 have f1
and lack location. At the end of the party f1 took pho-
tographs every 20 minutes and f2 took every 1 hour.
The detection of similar events technique (Figueirêdo
et al., 2012b) will find two events (for each user f1
and f2) with high similarity. The propagation will
occur for each photograph p1 of f2 with the nearest
photograph p2 of f1 related to p1. In this case the
photographs set of f2 will have five photograph rep-
resenting each hour (p1,p2,p3,p4,p5). The location of
the photograph taken at the hour 1 by f1 will be prop-
agated to the photograph p1, the location of the pho-
tograph taken at the hour 2 by f1 will be propagated
to the photograph p2, and so on.
4 VALIDATION
In this section we expose the method used to collect
data, the features of the photograph database used
to test the techniques; then we explain the metrics
adopted to compare the observed techniques, and fi-
nally we show how the metrics were validated to gen-
erate the results.
4.1 Database
We used a database containing approximately 7900
photographs of 41 users. Each photograph has the
following metadata: date and time of capture, geo-
graphic location and people present. Only 13% of the
pictures came from cameras with integrated GPS, so
87% of the locations were indicated by the owners of
the photographs.
4.2 Metrics
The metrics adopted were precision, recall and accu-
racy, and each of them is measured with basis on three
numbers:
• Sc = Number of correct propagations;
• Se = Number of erroneous propagations;
• Sn = Number of photographs that did not receive
propagations;
The metrics are computed in the following man-
ner:
Recall :
Sc
(Sc + Se + Sn)
; (21)
Precision :
Sc
(Sc + Se)
; (22)
Accuracy :
(Sc + Sn)
(Sc + Se + Sn)
; (23)
4.3 Training Set
The choice of the photographs that make part of the
training set occurred in three ways: by photograph,
by user and by event.
By Photograph:
Considering the set F containing all the stored
photographs, the training set TS is formed by ran-
domly chosen photographs in F.
By User:
Considering the set U containing all the users and
the set RU containing the randomly chosen users, the
training set TS is formed by the union of all pho-
tographs of the users in RU.
∀u ∈ RU → F
u
⊂ T S; (24)
By Event:
Considering the set E containing all the events
and the set RE containing all of the randomly cho-
sen events, the training set TS is formed by the union
the all photographs related to the events of RE. Let
FE
e
be the set of photographs related to some event:
∀e ∈ RE → FE
e
⊂ T S; (25)
4.4 Experiment
A validation of the results is needed to guarantee a
good representativity and also a good statistical sig-
nificance. The training set used was of 50% of the
photographs present in the database, so, the other half
was used to compare the propagated location with the
original one. Each training set scenario (by user, by
photo and by event) has 30 replications, as the training
set is built randomly, each replication has a different
training set.
A suggestion is considered correct when its dis-
tance to the original location is smaller than or equal
ICEIS2014-16thInternationalConferenceonEnterpriseInformationSystems
96
to the error threshold adopted, in the case of this work,
100 meters. Before each technique is tested, the loca-
tions of all the photographs (that are not in the train-
ing set) are temporarily removed and right after that a
propagation attempt is made. With all the suggestions
of all replications stored, we can analyze the proposed
metrics.
Next we present the pseudo code that represents
how the experiment occurred:
for (r = 0; r < 30; r++) {
toRemoveTemp = getPhotosToRemove();
for(Tech t in techniques){
removeTemporarily(toRemoveTemp);
for(p in toRemoveTemp){
suggestedLoc = tec.suggestLocation(p);
salveSuggestion(suggestedLoc);
}
restoreOriginalLocation(toRemoveTemp);
}
}
As the pseudo code shows, for each replication the
function getPhotosToRemove() will return the pho-
tographs not in the training set after building it. With
the training set built, the variable toRemoveTemp
stores the photographs that will have their location re-
moved temporarily. Three steps must be done to test
each technique considering the training set built for
the current replication:
1. Remove temporarily the geographic location of all
photographs in toRemoveTemp.
2. Compute and save the suggested location of each
photograph in toRemoveTemp.
3. Restore the geographic location of all pho-
tographs in toRemoveTemp.
At the end of the collecting we observed the
trust intervals of each technique with respect to the
four analyzed techniques. Considering a significance
level α = 6%, we performed the statistical tests of
Wilcoxon and also the T-Test (Boslaugh, 2012), ac-
cording to the applicability of each one. The tests
were used to validate the results found and presented
in Section 5.
5 DISCUSSION AND RESULTS
In this section, we present the results achieved with
each technique with respect to all the observed met-
rics, and then we discuss these results. The techniques
are represented by acronyms, namely:
• SC: Social Correlation;
• SE: Shared Events;
• TT: Trajectory;
• TC: Temporal Clustering.
There are two moments at with the photographs
are randomly chosen:
1. Which photographs will be in the training set?
2. What is the next photograph without location that
will be analyzed by the technique?
The first moment is intended to guarantee that the
training set has not a bias. The second one is intended
to improve the performance of the techniques. When
the photographs without location were ordered ac-
cording to the probability of receiving a correct prop-
agation (that has more photographs near in time with
a location), the performance of the techniques got
worse. For all the observed metrics, there were differ-
ences between 10% and 20% in favor of the random
propagation.
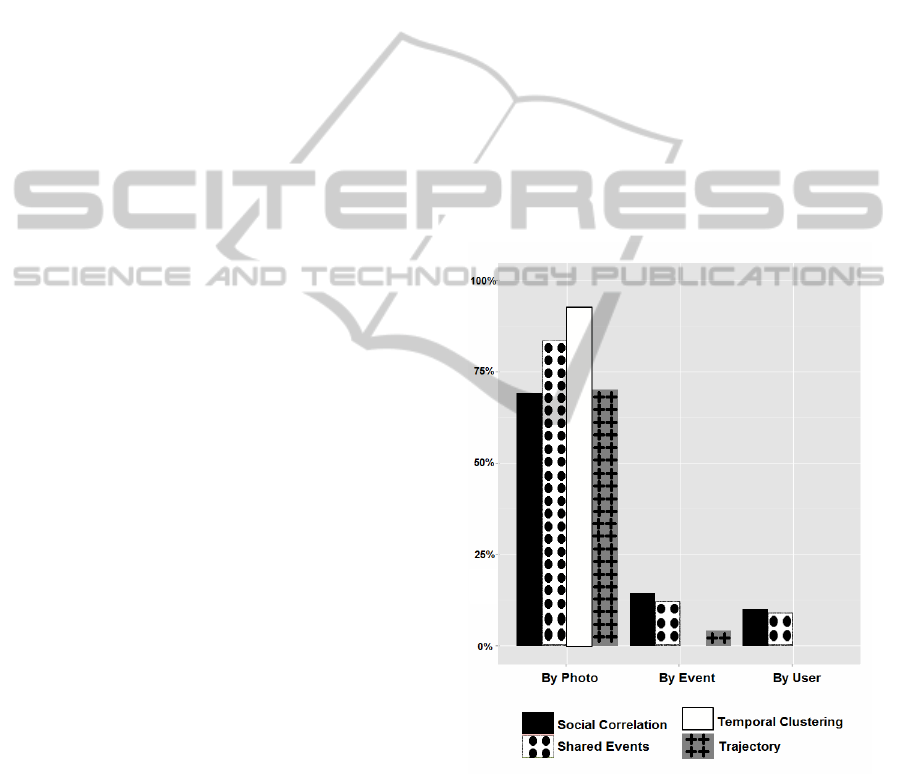
Figure 2: Results Recall.
Several systems adopt different error thresholds.
We know that the lower the error threshold with good
results, the higher the number of systems that would
adopt a certain propagation technique. The use of the
error threshold of 100 meters is favorable to the re-
sults achieved, since it considers the reality of several
systems that need geotag propagation.
This way, we present the result of each metric con-
sidering a random propagation sequence. Figures 2,
NewApproachesforGeographicLocationPropagationinDigitalPhotographCollections
97
3, 4 and 5 show the results, summarized by the me-
dian, of each observed metric.
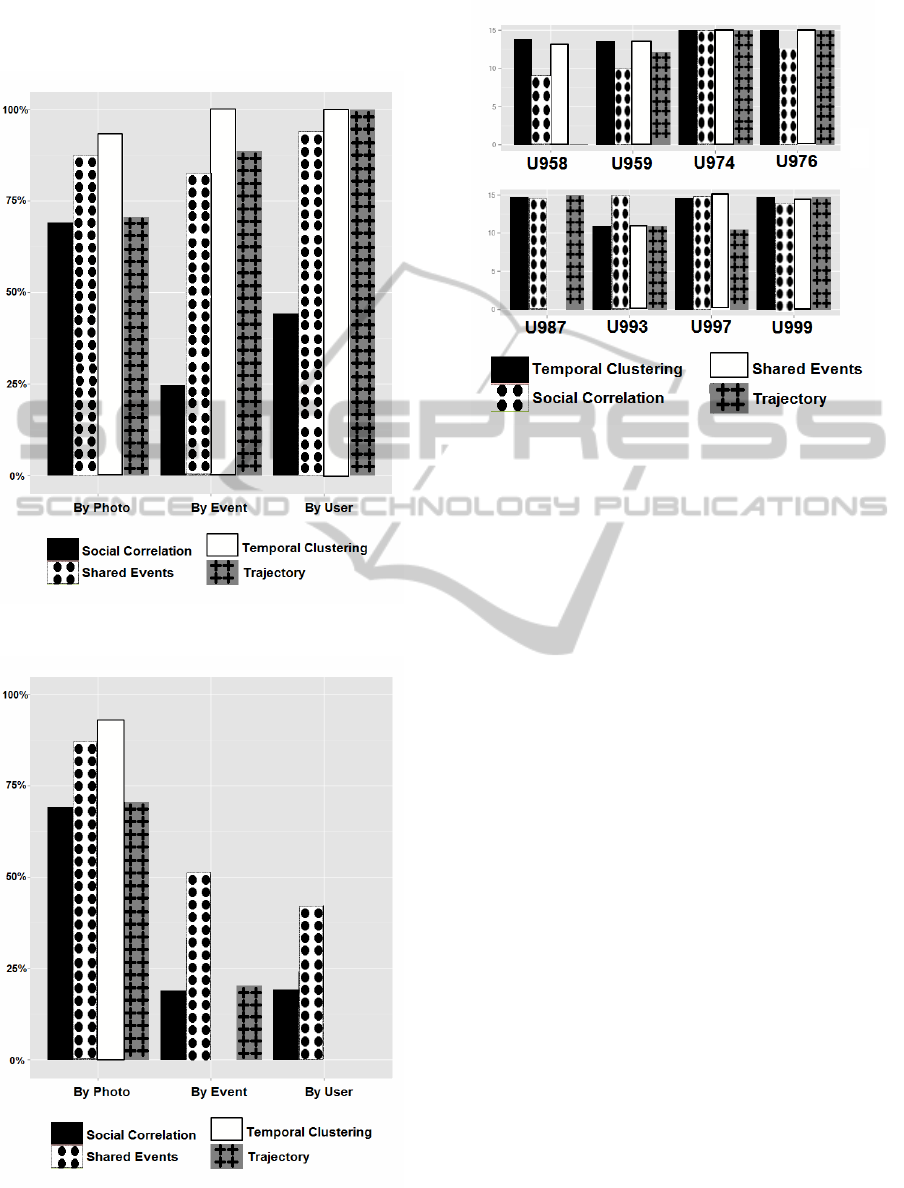
Figure 3: Results Accuracy.
Figure 4: Results Precision.
Figure 5: Behavior by user.
Approach by Photograph:
The approach removing the location of the pho-
tographs randomly, without considering the users or
events, shows the same ranking of techniques for all
metrics. The ranking of the techniques is the follow-
ing: SC < TT < SE < TC.
Approach by User:
The removal of location considering the user
shows different rankings for the metrics. We have the
following rankings:
• Precision: TC < TT = SC < SE;
• Recall: TC < TT < SC = SE;
• Accuracy: SC < SE < TT < TC;
The Accuracy metric presented a reverse order,
because the techniques with the worst recall cause
the number of photographs without propagation to be
high, making the accuracy high.
Approach by Event:
The removal of the location considering the events
led to similar results to the approach by users. So, the
rankings are the same for all metrics.
Number of Photographs with Geotag:
At the end of the experiment, we analyzed the
percentage of photographs that had correct location,
comparing with the initial percentage (before the ap-
plication of the techniques). This analysis showed
that the removal approaches considering the users or
ICEIS2014-16thInternationalConferenceonEnterpriseInformationSystems
98

the events had the same rakings: TC = TT < SE = SC.
Differently from the other approaches, the one using
removal without considering the users or the events
present the same ranking found in the analysis of the
metrics: SC < TT < SE < TC.
Analysis of the Techniques per User:
Finally, we made an analysis on the behavior of
each technique for each user separately. The results
showed that the behavior of each technique varies for
each user. Figure 4 shows eight users for whom the
techniques presented differences among each other
for the Precision metric, considering the random re-
moval that does not use the users or the events. Each
group of four columns represents a user and each col-
umn represents a technique.
6 CONCLUSIONS
In this work, two geotag propagation techniques were
proposed and we also made a comparative analysis
between the two proposed techniques and two exist-
ing ones based on the metrics: precision, recall and
accuracy. With the initial tests, it became evident that
the order of the photographs that must receive prop-
agation must be kept random in order to achieve the
best results. Through the tests carried out throughout
the analysis, we can state that the choice of the cor-
rect propagation technique will depend on the system
type and on the importance of each metric. Consid-
ering a system in which the geographic annotation is
made randomly, making all the users to have at least
50% of the photographs, the technique of choice is
the Temporal Clustering. On the other hand, in a sys-
tem in which the geographic annotation depends on
the user’s profile or on the events that take place, the
Shared Events and the Social Correlation techniques
are the most promising.
We may highlight as future work the proposal of
some way of combining the techniques (with an in-
dividual weighting for each user) in order to improve
the results per user. Besides the possibility of com-
bining the techniques, it can be also considered a lo-
cation made with basis on the way the users describe
the place, instead of latitude and longitude.
REFERENCES
Boslaugh, S. (2012). Statistics in a nutshell. O’Reilly Me-
dia, Inc.
Cooper, M. L. (2011). Clustering geo-tagged photo collec-
tions using dynamic programming. In Proceedings of
the 19th ACM international conference on Multime-
dia, pages 1025–1028. ACM.
Djuknic, G. M. and Richton, R. E. (2001). Geolocation and
assisted gps. Computer, 34(2):123–125.
Figueirêdo, H. F. d., Lacerda, Y. A., Paiva, A. C. d.,
Casanova, M. A., and Baptista, C. d. S. (2012a). Pho-
togeo: a photo digital library with spatial-temporal
support and self-annotation. Multimedia Tools and
Applications, 59(1):279–305.
Figueirêdo, H. F. d., Silva, J. P. R. d., Leite, D. F. B., and
Baptista, C. d. S. (2012b). Detection of photos from
the same event captured by distinct cameras. In Pro-
ceedings of the 18th Brazilian symposium on Multi-
media and the web, pages 51–58. ACM.
Gao, H., Tang, J., and Liu, H. (2012). Mobile location pre-
diction in spatio-temporal context. In Nokia Mobile
Data Challenge 2012 Workshop. p. Dedicated task.
Gong, Y., Li, Y., Jin, D., Su, L., and Zeng, L. (2011). A lo-
cation prediction scheme based on social correlation.
In Vehicular Technology Conference (VTC Spring),
2011 IEEE 73rd, pages 1–5. IEEE.
Hays, J. and Efros, A. A. (2008). Im2gps: estimating geo-
graphic information from a single image. In Computer
Vision and Pattern Recognition, 2008. CVPR 2008.
IEEE Conference on, pages 1–8. IEEE.
Hollenstein, L. and Purves, R. (2013). Exploring place
through user-generated content: Using flickr tags to
describe city cores. Journal of Spatial Information
Science, pages 21–48.
Ivanov, I., Vajda, P., Lee, J.-S., Goldmann, L., and
Ebrahimi, T. (2012). Geotag propagation in social net-
works based on user trust model. Multimedia Tools
and Applications, 56(1):155–177.
Lacerda, Y. A., Figueirêdo, H. F. d., Silva, J. P. R. d., Leite,
D. F. B., Paiva, A. C. d., and Baptista, C. d. S. (2013).
On improving geotag quality in photo collections. In
GEOProcessing 2013, The Fifth International Confer-
ence on Advanced Geographic Information Systems,
Applications, and Services, pages 139–144.
Naaman, M., Song, Y. J., Paepcke, A., and Garcia-
Molina, H. (2004). Automatic organization for dig-
ital photographs with geographic coordinates. In Dig-
ital Libraries, 2004. Proceedings of the 2004 Joint
ACM/IEEE Conference on, pages 53–62. IEEE.
Tsay, K.-E., Wu, Y.-L., Hor, M.-K., and Tang, C.-Y. (2009).
Personal photo organizer based on automated annota-
tion framework. In Intelligent Information Hiding and
Multimedia Signal Processing, 2009. IIH-MSP’09.
Fifth International Conference on, pages 507–510.
IEEE.
Zigkolis, C., Papadopoulos, S., Filippou, G., Kompatsiaris,
Y., and Vakali, A. (2012). Collaborative event anno-
tation in tagged photo collections. Multimedia Tools
and Applications, pages 1–30.
NewApproachesforGeographicLocationPropagationinDigitalPhotographCollections
99
