
Ontologies and Information Visualization for Strategic Alliances
Monitoring and Benchmarking
Barbara Livieri
1
, Mario A. Bochicchio
2
and Antonella Longo
2
1
Department of Economic Sciences, University of Salento, Via per Monteroni, Lecce, Italy
2
Department of Innovation Engineering, University of Salento, Via per Monteroni, Lecce, Italy
Keywords: Enterprise Modelling, Strategic Alliances, KPIs, Performance Measurement, Ontologies, Information
Visualization.
Abstract: Cooperation among firms is universally seen as a catalyst of competitive advantages. However, 50% of
alliances fails. This is often due to the lack of tools and methods to quantitatively track the effects of
Strategic Alliances (SAs) on firms, to the inherent complexity of a comprehensive analysis of SAa and to
the difficulty to link strategic alliances goals with Key Performance Indicators (KPIs). Nonetheless,
performance management and performance measurement have a key role in the assessment of the
achievement of alliances’ goals and of the impact of SAs on firms. In this context, the aim of this paper is to
discuss how advanced information processing techniques (e.g. ontologies, taxonomies and information
visualization) can be used for SAs monitoring and benchmarking. In particular, we propose an ontology for
KPIs, rendered through data visualization tools, and a taxonomy for SAs. This allowed us to develop an
interpretative framework able to support both SAs and firm managers to understand how to monitor their
alliance and which KPIs to use. Finally, we discuss the pertinence and the coherency of the approach
referring to the literature.
1 INTRODUCTION
Cooperation is gaining ever more importance due to
globalization, which has forced businesses to
rearrange their organizational structures and to focus
more on flexible forms of aggregation, such as
Strategic Alliances (SAs). Indeed, under certain
circumstances, SAs contribute to an increase in
performance and to the creation of intangible assets
(Das & Teng 2000; Caputo et al. 2013). Through
cooperation, the accumulation of knowledge, and the
sharing of variously configured resources, SAs can
lead to an increase in the economic capital of firms.
However, it is known that globally 50% of
strategic alliances fails, often due to the lack of a
comprehensive analysis that combine strategic goals
and KPIs (Kaplan et al., 2010). In general, strategic
failure is mostly the avoidable result of inadequate
governance resulting in inadequate strategy
development and implementation (Hoogervorst
2009). Indeed, in order to engage in SAs firms need
to closely monitor each other (Ouchi 1979; Essa et
al., 2014).
In this context, firms could benefit from tools
and methodologies that allow them to better perform
the monitoring in an inter-organizational
environment. In other words, firms could find useful
to access to more structured and rich information on
partners and to compare performances (Parmenter,
2011) in different strategic alliances and firms, in
order to understand the drivers of alliances’ success
and, thus, to enhance their performance.
This analysis is relevant in all the phases of the
collaborative firm lifecycle, that is composed by a)
the pre-alliance phase, in which firms decide
whether to create a partnership (strategy definition)
and with whom (partner selection), b) the alliance
phase, after the alliance is built and c) the
changing/ending phase, in which firms decide to
change the structure of the alliance or to stop the
collaboration at all.
However, SMEs cannot afford for a customized
Performance Measurement Systems, due to a lack of
financial and organizational resources. Moreover,
they are not always able to understand which KPIs
are relevant for them and which to include in their
dashboards. When firms use their Information
Systems (IS) or analyze their financial statements,
402
Livieri B., A. Bochicchio M. and Longo A..
Ontologies and Information Visualization for Strategic Alliances Monitoring and Benchmarking.
DOI: 10.5220/0004896504020409
In Proceedings of the 16th International Conference on Enterprise Information Systems (ICEIS-2014), pages 402-409
ISBN: 978-989-758-029-1
Copyright
c
2014 SCITEPRESS (Science and Technology Publications, Lda.)

they have to “manually” choose which KPIs to use,
and it is difficult to compare their result with the
results of their partners, since they could call the
same things with different names and different
things with the same name (e.g. ROI can be
calculated in several ways).
Therefore, there is the need for a reflective
design (Strecker et al., 2011) of the KPIs dashboards
and of an analysis of KPIs rationales and linkages,
as a part of a more comprehensive taxonomy
creation of SAs.
Nonetheless, at the best of our knowledge no tool
or service exists to perform this kind of assessment
through monitoring and benchmarking.
In this paper, with the general aim of providing
an interpretative framework for KPIs and strategic
partnership, on which to build such a tool or service,
we explore the possibility to use Enterprise
Ontologies (EOs) in association with advanced data
visualization techniques (e.g., hypertrees and cloud
of words) in order to render the complex interplay
among the different aspects that affect the success of
SAs.
In more detail, we discuss how KPIs hierarchies
can be enriched through ontologies and visually
rendered through hypertrees. This allows us to give
firms a representation of the relationship existing
among KPIs, which can be seen as a “picture” of the
organizational performance.
Moreover, we propose a taxonomy for alliances
and a cloud of words for SAs’ goals.
The objective of the proposal is to better
understand performance drivers of SAs, facilitating
firms in strategic and organizational choices, such as
whether cooperate with others, how to structure the
alliance (e.g., number of nodes, type of control) and
what to monitor. The pertinence of the proposal and
its coherence with the existing literature are
considered to validate the different aspects.
The work is structured as follows. In section 2
we define the background and the main works
concerning performance in inter-organizational
settings, enterprise modelling and enterprise
ontologies. Section 3 discusses the main problems
related to performance monitoring and
benchmarking for SAs, The proposal is detailed in
section 4. Section 5 is for conclusions and future
works.
2 BACKGROUND AND RELATED
WORKS
At the best of our knowledge there are no tools or
conceptual framework offered as a means of manage
and analyze strategic partnerships.
Therefore, we will shortly examine several
aspects, such as performance measurement and
enterprise modelling.
2.1 Performance Measurement in
Strategic Partnerships
Several authors (Caglio & Ditillo 2008) have
analyzed control mechanism in inter-organizational
environments, such as management accounting. In
alliances the monitoring can operate on three layers:
a) firm; b) effects of the alliance on the firm; c)
alliance. For sub-c) researchers and practitioners
propose several guidelines, performance
management tools (e.g., modified Balanced
Scorecard and scorecards) and enforcement
methods, such as Open Book Accounting (Agndal
and Nilsson, 2008; Caglio and Ditillo 2012b; Caglio
and Ditillo, 2012a; Kajüter and Kulmala, 2005;
Kulmala, 2002; Mouritsen et al., 2001; Romano and
Formentini, 2012). In particular, Open Book
Accounting (OBA) allows firms of a SA to share
accounting information, which enable an
improvement in the decision process (Caglio and
Ditillo, 2012a). However, many firms are reluctant
to disclose these data, because OBA is sometimes
seen as formal control mechanism that damages trust
(Windolph and Moeller, 2012).
Moreover, while there is a consolidate literature
on sub-a), there are still few works on how to
measure the effects of SAs on firms (sub-b)), and
even in those there is no focus on quantitative
aspects. Nonetheless, performance management and
performance measurement have a key role in the
assessment of the achievement of alliance goals and
of how the strategic partnership is affecting firms.
In this context, a tool that allows the analysis of
the effects of SAs on firms without a breakdown of
costs and revenues can be helpful to increase the
probability of the success of an alliance.
2.2 Enterprise Modelling
The research on enterprise engineering and
modelling has three main topics. Some authors focus
on the analysis of business processes (Comuzzi et
al., 2012; Comuzzi et al., 2013; Pan et al., 2004),
others on the information architecture (Kulkarni
2012) of firms and some others on the modellization
of strategic an organizational aspects as well
(Strecker et al., 2011; Frank, 2012).
OntologiesandInformationVisualizationforStrategicAlliancesMonitoringandBenchmarking
403

A definition of enterprise architecture (EA) has
been offered by (Lankhorst, 2013), who states that
EA is “a coherent whole of principles, methods and
models that are used in the design and realization of
an enterprise’s organizational structure, business
process, information systems and infrastructure”.
In this sense, a comprehensive research work in
this field has been performed at University of
Duisburg-Essen (MEMO: multi-perspective
enterprise modelling) (Frank, 2012; Strecker et al.,
2011). For the purpose of our research, MEMO and
MML (Meta Model Language) are relevant because
of their ability to model software engineering, social,
managerial and economic aspects of the firm.
2.3 Enterprise Ontologies
Nowadays enterprise are entities far more complex
than in the past; therefore it is not easy to manage
them. In this frame, there was the need for a “…a
conceptual model [...that is…] coherent,
comprehensive, consistent and concise…” (Dietz
2006).
Indeed, enterprise ontologies are developed and
used for several reasons linked with enterprise
modelling, such as the development of Management
Information Systems and strategic decision support
systems, Business Process Reengineering and the
construction of Virtual Enterprises. However, still
few enterprise ontologies have been developed and
use in productive settings, due to the complexity and
the novelty of the methods (Bertolazzi et al., 2001).
In more detail, there are two enterprise
ontologies, which are: a) the Enterprise Ontology
developed from the Edinburgh Group (Uschold et al.
1996) and b) the Toronto Virtual Enterprise Project
(TOVE) (Fox et al., 1993; Gruninger and Fox, 1994;
Fox et al., 1995).
However, there is still a lack of ontologies for
SAs, which are entities more complex than
individual enterprises, or, more in general, for KPIs
and performance measurement.
3 PROBLEM DEFINITION
Control mechanisms such as monitoring and
benchmarking are key elements for the management
of all kinds of organizations, no matter if the level of
analysis is the individual enterprise or a SA. In
particular, through the analysis of KPIs and their
comparison with a benchmark, it’s possible to
understand if the organization is performing well,
thus if it’s achieving its strategic goals.
Therefore, monitoring and benchmarking are
essential in order to promptly notice a gap between
goals and achieved result and to define which
actions to undertake in order to reduce the gap. In
order to “track” and store KPIs large enterprises
usually benefit from internal control systems
(Enterprise Information Systems), whilst SMEs
perform, whenever that even happens, a manual
analysis of their financial statements and compare
their values with those of similar firms, by means of
public databases of financial statements.
However, in traditional control systems built for
individual enterprises, there is a clear-cut between
external and internal environment. Indeed, whilst for
SAs it is possible to use the same performance
measurement frameworks used for individual firms,
it is still necessary to structurally and operatively
change the measurement system (Bititci et al.,
2004).
In particular, the same KPI can be calculated or
interpreted in several ways, making them not
comparable within a SA or among different SAs
(P.1). This problem concerns both financial and non-
financial KPIs and derives from the need to share a
common understanding of the domain (Bertolazzi et
al., 2001).
Problem 1. In order to monitor SAs and to perform
benchmarking within and between SAs and firms in
SAs, it is necessary to share a common language for
KPIs.
Moreover, benchmarking within a SAs enable
the analysis of benefits, of their distribution among
partners and of the performance drivers for the SA.
Indeed, firms are concerned both with performance
drivers and targets; therefore benchmarking is
relevant not only for KPIs comparison, but also for
the identification of the “collaborative practices”
that contribute to the success of a CE (Simatupang &
Sridharan 2004).
In this frame it is obviously not enough to
compare SAs only for business sector or size, but
other factors, such as the SA type and the goals,
come into play.
Problem 2. SAs goals and SA types are relevant in
order to perform an effective and accurate
benchmarking.
Furthermore, SAs are heterogeneous clusters of
partnerships among enterprises. SAs can be of
different types (e.g., horizontal SAs, vertical SAs)
and have different goals; therefore, they need for
different KPIs (Parung and Bititci, 2006). In other
words, firms and SAs have to understand which
KPIs are relevant and what a KPIs mean in a given
firm, a SA with defined goals.
ICEIS2014-16thInternationalConferenceonEnterpriseInformationSystems
404

However, this kind of understanding is not
immediate, especially in several SMEs, which lack
of the know-how needed to perform this kind of
analysis and often choose the more “known” KPI,
instead of the more relevant, with possible negative
effects on the SA equilibrium.
Therefore, SAs need to understand which KPIs
are relevant for them, taken into account their “type”
and “goals”.
Problem 3. Build domain-specific KPIs, which
means KPIs specific for the SA type and the goals.
Finally, SAs are a multifaceted phenomena, that
is sometimes difficult to analyze and to comprehend.
Therefore, the analysis by itself of SAs’ goals, SAs
type and related KPIs could be misleading for firms
and SAs.
Problem 4. Reduce the complexity of the analysis
and of the monitoring of SAs performance.
4 KPIs ONTOLOGY, SA
TAXONOMY AND DATA
VISUALIZATION TECNIQUES
In order to address the problems presented in
Section 3, we propose the following solution.
For Problem 1, we propose the use of KPIs
ontologies (Section 4.1). For Problem 2 we propose
the use of SAs taxonomies (Section 4.2). Moreover,
for Problem 3, we highlight the importance to
consider both a KPIs ontology and a SAs taxonomy
(Section 4.2). For Problem 4, we propose the use of
data visualization techniques, such as interactive
hypertrees, to better understand complex phenomena
(Section 4.3).
Finally, in Section 4.4 we analyze the pertinence
of our approach with the existing literature.
4.1 Towards a KPIs Ontology
Ontologies can be very effective to represent shared
conceptualizations of specific domains (Bertolazzi et
al. 2001) and to allow people to reason about
sameness and differentness of concepts.
They can be seen as repositories of concepts,
intended as complex information structures tightly
interconnected with each-other. In knowledge
modeling it is customary to see ontologies as a three
layer organization of the knowledge in which the
lower layer is where information about individual
items is stored; the middle layer concerns the
conceptual modeling that allows creating ontologies
and the upper layer contains the meta-concepts or
modeling ideas. The technology used to implement
the ontologies is typically that of databases, where
the middle level corresponds to the database schema.
In this perspective, a KPIs Ontology represents a
good solution to the problems P2 and P3 defined in
section 3. In particular in the lower layer the KPI
ontology should store information on individual
KPIs, in the middle layer it should define the
concepts on financial and non-financial KPIs while
in the third layer it should describe the meta-
concepts needed to define the database schema.
In our proposal the concepts of the KPIs Ontology
are grouped according to three main conceptual
areas (meta-concepts, in the third layer):
- Atomic measures: including all the quantitative
information items (e.g. balance sheets’ items)
coming from firms and SAs;
- Ratios and Indicators: including all the relevant
indexes which can be derived from the atomic
measures or from other indexes by means of
formulas or algorithms;
- Triggers and Conditionals: representing all the
actions (e.g. warnings and alerts) and complex
expressions that may be tested to see if they are
satisfied or not.
For the lower layer (instances) and the middle layer
(schema) we propose a hierarchical structure
organized as in the following ontology fragment:
[fragment start]
KPI: a measure of the performance of activities,
processes, departments, firms, SAs or whatever
organizational entity at several level of granularity.
Each item should include the description, one or
more literature references, their rationales, formulas
and “limit values”.
Non-financial KPIs: KPIs that do not take
into account accounting information (e.g.,
KPIs on sustainability or environmental
impact).
o […]
Financial KPIs: KPIs based on
accounting information (e.g., from the
Management Accounting System and from
financial statements).
o Return on Equity (ROE):
measure of the efficiency of
organizations.
Rationale: how much profit a unit
of stock equity generates
Formula: (Net Result/Equity)*100
Limit values: OK if > 6%
Notes: ROE can be calculated also
as product of ROS*icp
OntologiesandInformationVisualizationforStrategicAlliancesMonitoringandBenchmarking
405
o Return on Investment (ROI): measure
of the efficiency of the total investments
in the core business made by an
organization.
Rationale: efficiency of an organization,
regardless of the funding choices or the
tax policies.
Formula: (EBIT/Core business
investments)*100
Limit value: warning if < 7%; OK if >
15%
o Return on Sales (ROS): how much
profit has been produce for 100 units of
sales.
Rationale: how much of the revenues is
available in order to cover financial
costs and taxes.
Formula: (EBIT/Total revenues)*100
Limit value: warning if <2%; OK
if>13%
o Increase in Intangible Assets: measure
how many intangible an organization
have done in a set time interval.
Rationale: effort for intangible assets.
Formula: gross value t
1
– net value t
0
Limit value: variable by business sector.
[fragment end]
Moreover, particularly relevant is the information
(e.g., questions, answers, notes) exchanged by users
about the interpretation of KPIs used for alliance
monitoring purposes.
Figure 1: Example of KPI STRUCTURE applied to ROE.
The relations among KPIs are tracked through the
analysis of the items (atomic values and/or other
indicators) composing the ratio. Referring to the
schema shown in Fig. 1, KPIs and their relations are
described by means of the recursive relation on the
entity named “Item Type”. The elements needed for
the semantic annotation of KPIs are included as
attributes of the class. The recursive relation can be
put in its hierarchical form (i.e. as a tree) through a
conversion of the relation “Is Composed By” of fig.1
to an associative entity. As an example, Fig. 2 shows
the KPI STRUCTURE, which forms an association
between the instances of the ITEM TYPE class.
4.2 An SAs Taxonomy Based on Goals
Analysis
From the literature analysis we can observe that not
all KPIs have the same relevance for all SAs and
that the performance monitoring of SAs sharing
similar goals is based on the same (or similar) KPIs.
For example, SAs aimed at distribution are often
monitored in terms of KPIs such as ROI, ROE and
ROS while SAs which aim is to jointly invest in
R&D are more focused on KPIs measuring the value
of their intangible assets (an increase in ROI, ROE
or ROS may occur years later). Moreover, when a
given KPI is relevant in more domains, it has
different value limits depending on the domain of
analysis.
Similar considerations apply to benchmarks.
Consequently, in order to offer a solution for
Problem 2 and Problem 3, a taxonomy on SAs based
on the analysis of SAs’ goals is needed as well.
In our proposal, referring to the database schema,
the taxonomy is modeled through the “IS-A”
relationships defined on the classes “Strategic
Alliance”. A further taxonomy on the class “Item
Type” has been defined in the same way. These
taxonomies take into account the lack of
homogeneity of partnerships, which is relevant for
the performance analysis. For example, partnerships
can be “vertical” alliances or “horizontal” alliances.
Then, vertical alliances can be subdivided in supply-
chains or in distribution SAs and so on (e.g., basing
the subdivision on number of participants, duration
of the alliance, inter-firm exchanges).
KPIs can be structured according to their
peculiarity in general purpose, domain-specific or
SA-specific.
The integration of the previously defined “KPIs
ontology” with the above outlined taxonomies offers
a guideline for the use of performance dashboards,
answering to questions such as “which KPIs should I
use in my SA?”, “how can I understand if my SA or
my firm are achieving the predefined goals?”.
Finally, the tracking of KPIs’ interests for firms
and SAs enable the creation of an interpretative
framework for SAs performance. Each firm and
each SA can see the best practice in its domain and
compare it to them. For example, if a SA in the
biotech sector, which aim is to invest in R&D, has
an increase of only 2% in intangible assets, when
ICEIS2014-16thInternationalConferenceonEnterpriseInformationSystems
406

similar SAs have an increase of 20%, it means that
something is not working right.
This means that, for each domain or SA type, it
is helpful to collect information on which KPIs are
most used, thus allowing the creation of a set of
usage-driven guidelines for the use of KPIs.
4.3 Information Visualization
Techniques for KPIs
Advanced visualization techniques are proven to be
very useful to help understanding complex
phenomena, and Strategic Alliances are an example
of “systems of systems” (Jamshidi, 2011) which can
benefit from the application of these techniques.
The previously defined KPIs Ontology, for
example, can be visually rendered (Katifori et al.,
2007) to better understand the KPIs dependency
from the “atomic measures”, as defined in section
4.1, and/or from other KPIs.
The extensive adoption of information
visualization techniques is also fostered from the
increased computational and graphic capabilities of
personal computers and “smart” devices, such as
smartphones and tables, which have made people
more receptive to high quality graphical
explanations.
For these reasons, our proposal includes the
visual rendering of both the KPIs ontology and the
alliances goals. In particular, we propose to
represent the KPIs ontology as an interactive
hypertree, allowing to simultaneously understand
which balance sheet items affect a given KPIs, what
relation exists among them and which other KPIs are
linked.
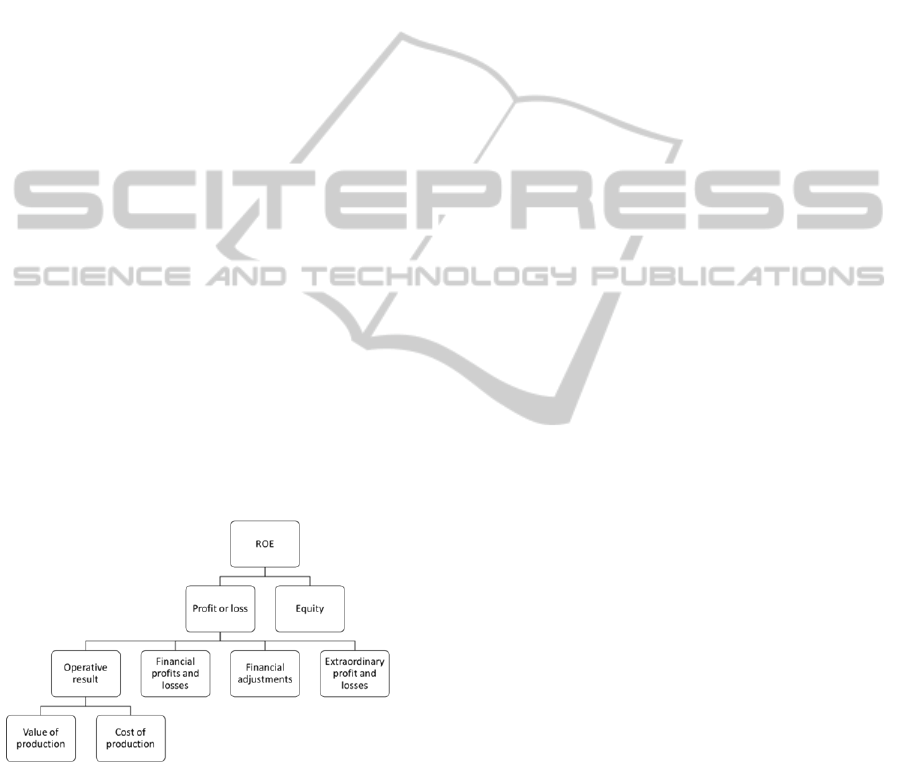
As example, in Fig. 2 is shown the interactive
hypertree of ROE. The hypertree can be browsed by
selecting which node of the structure is the focus of
the analysis.
Figure 2: Visual representation of the hypertree for ROE.
Finally, for the analysis of goals we propose to
adopt information visualization techniques based on
content analysis and text mining methods.
Figure 3: Word cloud for SA agreements’ goals.
To exemplify the concept, in Fig. 3 it is shown a
word cloud for the alliance goals coming from the
documents (e.g. strategic agreements) used to
formalize the SA. From this kind of analysis it is
possible to extract the relevant objectives of the
collaboration, such as offering new services,
developing continuing education courses or
improving marketing strategy.
4.4 Pertinence of the Approach
The proposed approach is based on the availability,
in the public domain, of performance-related
information (e.g. financial statements) for both firms
and SAs. While this information is already available
for firms, no rules and standards have been defined
for SAs. On the other hand, strategic alliances,
virtual organizations and other aggregative forms are
ever more important in the global economy. That's
why several countries are working on the above
mentioned rules and standards for SAs, like in the
case of the “Small Business Act” defined by
European Union to promote the aggregation of
Small and Medium Enterprises.
In this scenario, at the current state of research it
is not possible to evaluate our proposal on the field,
due to the lack of performance-related public
information on SAs (but in Italy, for example, they
will be available by the end of the first semester of
2014). Furthermore, in accordance with (Strecker et
al., 2011), we assume that prospective users at
present are not yet able to evaluate the effectiveness
and applicability of the tools and methods, because
they are validated on conceptual models rather than
on an adequate sample of actual data.
For these reasons the proposal has been validated
against the literature (Strecker et al., 2011), i.e. at
the best of our knowledge it has been built to be
coherent with existing literature and practice.
Indeed, taxonomies and ontologies are widely
OntologiesandInformationVisualizationforStrategicAlliancesMonitoringandBenchmarking
407

adopted to provide users with semantic elements,
and this is useful to understand strategic alliances.
Moreover, hypertrees have been successfully
exploited by several authors (Müller n.d.; Katifori et
al. 2007) to explore complex data-sets, to
comprehend the relationship existing in complex
phenomena and to find clusters, outliers and other
relevant patterns such as those outlined in our paper.
Finally, clouds of words have been used in a
wide diversity of applications, ranging from the
analytical to the emotional, and can be used for an
immediate visualization or most used words (static
word clouds) or for the illustration of the content
evolution in a stream of documents (Cui et al. 2010).
5 CONCLUSIONS AND FUTURE
WORKS
In this paper we present the main lines of a work
aimed at developing an interpretative framework to
understand how to use KPIs’ for monitoring and
benchmarking of Strategic Alliances. In particular,
we propose an ontology, two taxonomies and two
information visualization objects to help answering
question such as “which KPIs should I use in my
SA?”, “how can I understand if my SA or my firm
are achieving the predefined goals?”.
The proposal will be used to design and
implement an online database for strategic
partnerships governance and analysis and to test it
on the field. This online database can be useful to
SMEs that lack of the economical and managerial
resources required to enforce such a complex
performance measurement system.
Future works will include an improvement of the
content analysis, the linkage between goals and KPIs
and the analysis of SAs financial statements
.
REFERENCES
Agndal, H. & Nilsson, U., 2008. Supply chain decision-
making supported by an open books policy.
International Journal of Production Economics,
116(1), pp.154–167.
Bertolazzi, P., Krusich, C. & Missikoff, M., 2001. An
approach to the definition of a core enterprise
ontology: CEO. In OES-SEO 2001, International
Workshop on Open Enterprise Solutions: Systems,
Experiences, and Organizations. Citeseer, pp. 14–15.
Bititci, U.S. et al., 2004. Creating and managing value in
collaborative networks. International Journal of
Physical Distribution & Logistics Management,
34(3/4), pp.251–268.
Caglio, A. & Ditillo, A., 2008. A review and discussion of
management control in inter-firm relationships:
Achievements and future directions, Elsevier Ltd.
Caglio, A. & Ditillo, A., 2012a. Interdependence and
accounting information exchanges in inter-firm
relationships. Journal of Management & Governance,
16(1), pp.57–80.
Caglio, A. & Ditillo, A., 2012b. Opening the black box of
management accounting information exchanges in
buyer–supplier relationships. Management Accounting
Research, 23(2), pp.61–78.
Caputo, F., Livieri, B. & Venturelli, A., 2013. Intangibles
and Value Creation in Network Agreements: Analysis
of Italian firms. In Second “Management Control
Journal” Workshop: Controlling and Reporting for
Intangibles.
Comuzzi, M., Vanderfeesten, I. & Wang, T., 2013.
Optimized cross-organizational business process
monitoring: Design and enactment. Information
Sciences, 244, pp.107–118.
Comuzzi, M., Vonk, J. & Grefen, P., 2012. Measures and
mechanisms for process monitoring in evolving
business networks. Data & Knowledge Engineering,
71(1), pp.1–28.
Cui, W. et al., 2010. Context preserving dynamic word
cloud visualization. In Pacific Visualization Sym-
posium (PacificVis), 2010 IEEE. IEEE, pp. 121–128.
Das, T.K. & Teng, B.-S., 2000. A Resource-Based Theory
of Strategic Alliances. Journal of Management, 26(1),
pp.31–61.
Dietz, J., 2006. Enterprise Ontology: Theory and
Methodology, Springer.
Dyer, J.H., Kale, P. & Singh, H., 2001. Strategic Alliances
Work. MIT Sloan Management Review, pp.37–43.
Essa, S.A.G., Dekker, H.C. & Groot, T., 2014. The
influence of information and control on trust building
in buyer-supplier negotiations. In Management
Accounting Section (MAS) Research and Case
Conference.
Fox, M.S. et al., 1995. An Organization Ontology for
Enterprise Modelling. In Enabling Technologies:
Infrastructure for Collaborative Enterprises, 1995.,
Proceedings of the Fourth Workshop on. IEEE. pp. 1–25.
Fox, M.S., Chionglo, J.F. & Fadel, F.G., 1993. A
Common-Sense Model of the Enterprise. In
Proceedings of the 2nd Industrial Engineering
Research Conference.
Frank, U., 2012. Multi-perspective enterprise modeling:
foundational concepts, prospects and future research
challenges.
Software & Systems Modeling.
Gruninger, M. & Fox, M.S., 1994. The Design and
Evaluation of Ontologies for Enterprise Engineering.
In Workshop on Implemented Ontologies, European
Workshop on Artificial Intelligence, Amsterdam, The
Netherlands. pp. 1–14.
Hoogervorst, J.A.P., 2009. Enterprise Governance and
Enterprise Engineering, Springer.
Jamshidi, M., 2011. System of Systems Engineering: Inno-
vations for the Twenty-first century, John Wiley & Sons.
ICEIS2014-16thInternationalConferenceonEnterpriseInformationSystems
408

Kajüter, P. & Kulmala, H.I., 2005. Open-book accounting
in networks Potential achievements and reasons for
failures. Management Accounting Research, 16(2),
pp.179–204.
Kaplan, R. S., Norton, D. P. & Rugelsjoen, B., 2010.
Managing Alliances with the Balanced Scorecard.
Harvard Business Review, (February 2010), pp.114–121.
Katifori, A. et al., 2007. Ontology visualization methods—
a survey. ACM Computing Surveys (CSUR), 39(4),p.10.
Kulkarni, V., 2012. Modeling and Enterprises–the past,
the present and the future. and Empirical Studies in
Software Modelling, p.63.
Kulmala, H.I., 2002. Open-Book Accounting in networks.
LTA, 2, pp.157–178.
Lankhorst, M., 2013. Enterprise architecture at work:
Modelling, communication and analysis, Springer.
Lavie, D., Haunschild, P.R. & Khanna, P., 2012.
Organizational differences, relational mechanisms, and
alliance performance. Strategic Management Journal,
(September 2009).
Lee, C.-W., 2007. Strategic alliances influence on small
and medium firm performance. Journal of Business
Research, 60(7), pp.731–741.
Lin, Z.J., Yang, H. & Arya, B., 2009. Alliance partners
and firm performance: resource complementarity and
status association. Strategic Management Journal,
30(September 2003), pp.921–940.
Mouritsen, J., Hansen, A. & Hansen, C.Ø., 2001. Inter-
organizational controls and organizational
competencies: episodes around target cost
management/functional analysis and open book
accounting. Management Accounting Research, 12(2),
pp.221–244.
Müller, F., Hypervariate Information Visualization.
Trends in Information Visualization, p.31.
Nielsen, B.B., 2007. Determining international strategic
alliance performance: A multidimensional approach.
International Business Review, 16(3), pp.337–361.
Ouchi, W.G., 1979. A conceptual framework for the
design of organizational control mechanisms.
Management science, 25(9), pp.833–848.
Pan, Y., Tang, Y. & Gulliver, S.R., 2004. Artefact-
Oriented Business Process Modelling An Ontological
Dependency Approach.
Pansiri, J., 2008. The effects of characteristics of partners
on strategic alliance performance in the SME
dominated travel sector. Tourism Management, 29(1),
pp.101–115.
Parmenter, D., 2011. Key Performance Indicators: Deve-
loping, Implementing,and Using Winning KPIs, Wiley.
Parung, J. & Bititci, U.S., 2006. A conceptual metric for
managing collaborative networks. Journal of
Modelling in Management, 1(2), pp.116–136.
Romano, P. & Formentini, M., 2012. Designing and
implementing open book accounting in buyer–supplier
dyads: A framework for supplier selection and
motivation. International Journal of Production
Economics, 137(1), pp.68–83.
Simatupang, T. M. & Sridharan, R., 2004. Benchmarking
supply chain collaboration: An empirical study.
Benchmarking: An International Journal, 11(5),
pp.484–503.
Strecker, S. et al., 2011. MetricM: a modeling method in
support of the reflective design and use of
performance measurement systems. Information Sys-
tems and e-Business Management, 10(2), pp.241–276.
Uschold, M. et al., 1996. The Enterprise Ontology,
Windolph, M. & Moeller, K., 2012. Open-book
accounting: Reason for failure of inter-firm
cooperation? Management Accounting Research,
23(1), pp.47–60.
OntologiesandInformationVisualizationforStrategicAlliancesMonitoringandBenchmarking
409
