
Snake Method Enhanced using Canny Approach Implementation
for Cancer Cells Detection in Real Time
Ahmad Chaddad, Camel Tanougast and Abbas Dandache
Laboratory of Design, Optimization and Modeling (LCOMS), University of Lorraine, Metz, France
Keywords: Cancer, FPGA, Implementation, Segmentation, Snake.
Abstract: Optical microscopy is widely used for cancer cell detection via biopsy. Unfortunately this technique
requires a large number of samples to determine the grade of the cancer cells. Because time is critical in this
operation, a search for a method to reduce the length of this process is important. One such method showing
promise is the implementation of the snake method for cancer cell detection. Ideally, this method will aim
toward minimizing cost while maximizing efficiency. Using optical microscopy at LCOMS, we performed a
proof-of-concept study to distinguish between normal and abnormal cells. We developed a snake/active
contour method by which several curves move within images in order to find normal/abnormal cell
boundaries. Abnormal cell identification typically takes more than one hour; however. The implementation
of field programmable gate array (FPGA) technology solves this problem. A novel embedded architecture
of the snake method is developed for an efficient and fast computation of active contour used in high
throughput image analysis applications, where time performance is critical. This architecture allows for a
scalable and a totally embedded processing on FPGA of a large number of images. The architecture of the
snake method is able to detect objects from images which have irregular shapes, such as carcinoma cell
types. To demonstrate the effectiveness of the approach, the architecture is implemented on Xilinx ISE
12.3-FPGA technology using Verilog hardware description language (VHDL). The very promising results
using Snake method implementation and real cancer cell images from optical microscopy demonstrate the
potentials of our approach.
1 INTRODUCTION
Biomedical instrumentation is basic to accurate
medical diagnose. Electronic devices and
instrumentation for medical applications are now
essential for the prevention, diagnosis, treatment and
rehabilitation of patients’ diseases. In recent years,
the trend has been toward the miniaturization of
such system; namely, we have seen the development
of microelectronic integrated circuits in devices such
as biomedical implants, pacemakers, defibrillators,
etc. In addition, the robust nature of computer
analysis and vision facilitate the monitoring of
patient diagnoses e.g. medical imaging, such as:
Scanner, X-Ray, fNIRS, fMRI and Microscope
(Castanon 2007, Wang 2008). In our work, we focus
on optical microscopy imaging to automatically
detect cancer cells in real time using FPGA
technologies. Several literature sources propose the
dynamic segmentation method for detection of
objects inside images(Cataldo 2010, Szilágyi 2011).
Meanwhile, one of these methods, the Snake
method, possesses a very high degree of accuracy,
especially in cancer cell detection. The Snake
method algorithm consists of several iterations in
order to achieve the goal of cell detection. The
method utilizes several bio-images from the
microscopy system and requires at least three
minutes in each abnormal cell for detection. The
main disadvantage of the algorithmic approach
developed, is the high computing power required for
application in reasonable time. It is within this
context that a hardware implementation based
on FPGA technology of the proposed method is
considered in order to solve constraint of time.
Unfortunately, Snake method is not easy to
implement, so we integrated the Canny approach for
external energy. While the snake method is based on
both internal and external energies, the integration of
the Canny approach allows us to more easily
implement external energy. Limited work has been
done for Snake implementation using FPGA
187
Chaddad A., Tanougast C. and Dandache A..
Snake Method Enhanced using Canny Approach Implementation for Cancer Cells Detection in Real Time .
DOI: 10.5220/0004896901870192
In Proceedings of the International Conference on Biomedical Electronics and Devices (BIODEVICES-2014), pages 187-192
ISBN: 978-989-758-013-0
Copyright
c
2014 SCITEPRESS (Science and Technology Publications, Lda.)
technology. In this work, we propose a new
architecture/design with the snake method used as
the core of the implement segmentation whose
advantage lies in the parallelism for which
computation time is critical. An effort was made to
integrate Canny approach in external energy for
active contour equation. The objective of this
implementation is to achieve an Appropriateness
Algorithm Architecture target to meet the
performance needs in terms of computation time,
high accuracy of cancer cell detection, and
optimization of material resources for the embedded
implementation on FPGA technology. Texture
analysis applied on multispectral bio-image was
done in LCOMS laboratory in order to make a
classification between types of cancer cell (Chaddad
2011a). This analysis utilized different structural
patterns as well as apparent textures to diagnose
different grades of cancer malignancy. Our project
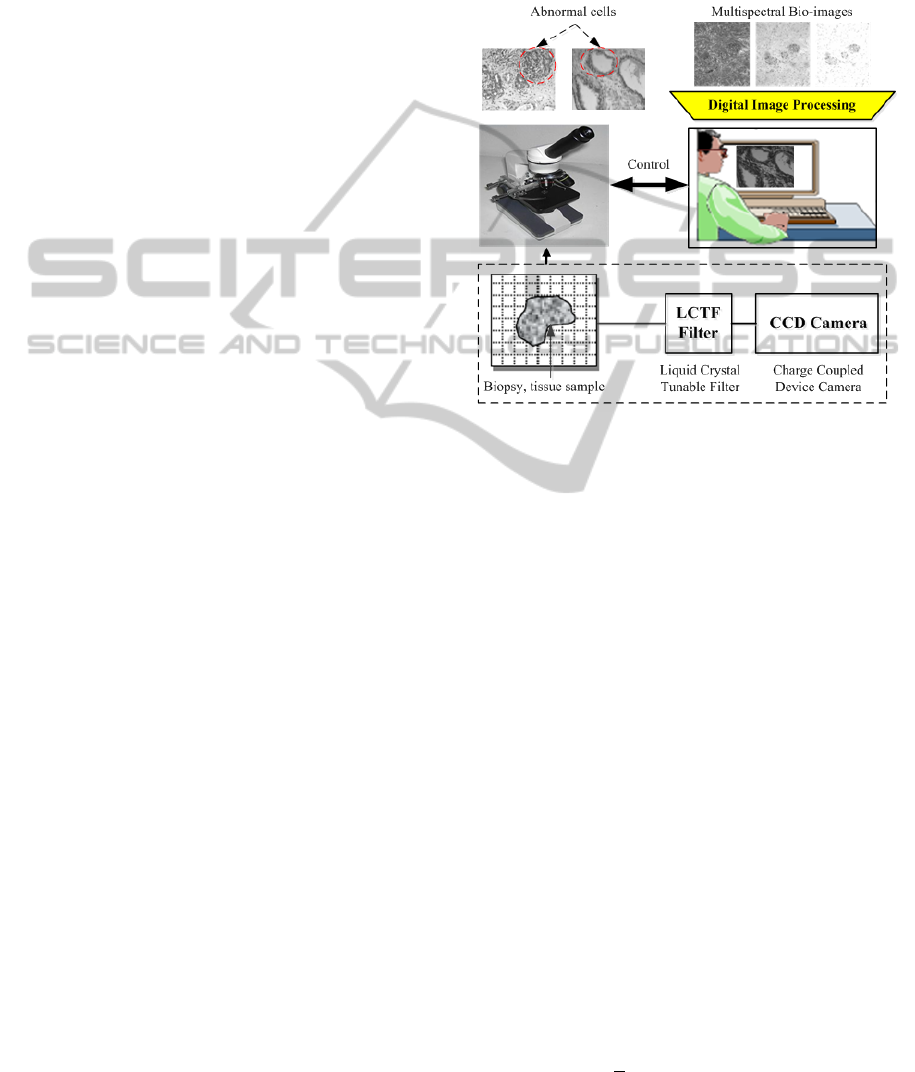
operates on the interface between optical
microscopy and a control center "computer". The
control center receives data from the optical
microscopy via a charged coupled device (CCD)
camera. The sensitivity of this camera is about 1000
times that of conventional CCD cameras. It was
developed for observation under a wide variety of
circumstances, from very bright stop action
situations to extremely low light fluorescence
conditions. The exposure time can be selected within
the range of 1/10000th of a second up to 5 minutes,
and a unique real time background subtraction
function makes it possible to eliminate fixed pattern
noise from optics and shading when doing
fluorescence. It has a built-in image memory and an
RS-170 output for standard video connection and a
SCSI interface for digital output and camera control.
Liquid Crystal Tunable Filter (LCTF) is a special
filter which allows capturing of 16 spectral bands
between 500 nm and 650 nm with a 9.375 nm step
size between each successive band (Chaddad 2012).
Fig.1 presents the global block diagram of our
proposed work.
This paper provides an architectural
implementation of external energy using canny
approach for fast active contour method in order to
detect cancer cells as described in section 2. We
report and discuss the results in section 3, and the
conclusion is the subject of section 4.
2 METHODS AND MATERIALS
2.1 Active Contour Model “Snake”
Snake method has been widely applied in various
object contour detection and object tracking. Two
Figure 1: Block diagram of automatic cells detection via
optical microscopy acquisition.
general types of active contour models have been
proposed: the first is based on the minimization of
the energy-functional associated to the model, as
proposed by Kaas (Kass 1988). The second is based
on geometric models as proposed by Caselles
(Caselles 1993)
and the third is based on shape
modeling as proposed by
Malladi (Malladi 1995).
Recently, utilization of deformable models and their
applications can be found in medical imaging to
detect cells or irregular shapes inside images (He
2008, Chen 2011). The energy function used by the
snake to find contours can be expressed by the
following equation:
(1)
where E
Internal
(internal energy) of the snake depends
directly on the contour dot, which concerns several
coefficients, such as curvature of the contour or
correctness of dot spacing. In addition, the contour
must retain a rounded shape by minimizing the
derivatives of several orders (Chen 2012). Ideally,
when the internal energy is minimum, all the points
are reasonably spaced. This can be expressed by the
internal spline energy in the following equation:
1
2
|
|
|
|
(2)
BIODEVICES2014-InternationalConferenceonBiomedicalElectronicsandDevices
188
where V is the parametric curve of the active
contour, ||V
s
||
2
is the first order measure of the
elasticity, ||V
ss
||
2
is the second order measure of the
curvature, α and β are the control coefficients.
The E
External
(external energy) of the snake
represents the image & constraint forces. It can be
expressed as Kass proposed it by the following
equation:
(3)
where W
line
, W
contour
and W
term
are regulator factors. In
our work we set W
line
= W
contour
= W
term
=1.
E
line
= I(x,y), is the line energy representing the
pixel intensity.
E
contour
= -|
I(x,y)|
2
, is the contour energy
representing the negative of square intensity
gradient.
, is the term energy
which depends on 5 coefficients c
x
, c
y
, c
xx
, c
yy
and
c
xy
. These coefficients are parallel and
independently computed. Each coefficient is the
result of a convolution between the image I(x, y)
and a mask filter as illustrated in the following
expressions:
1 1
⨂
,
(4)
1
1
⨂
,
(5)
121
⨂
,
(6)
1
2
1
⨂
,
(7)
1 1
1 1
⨂
,
(8)
2.2 External Energy Implementation
on FPGA
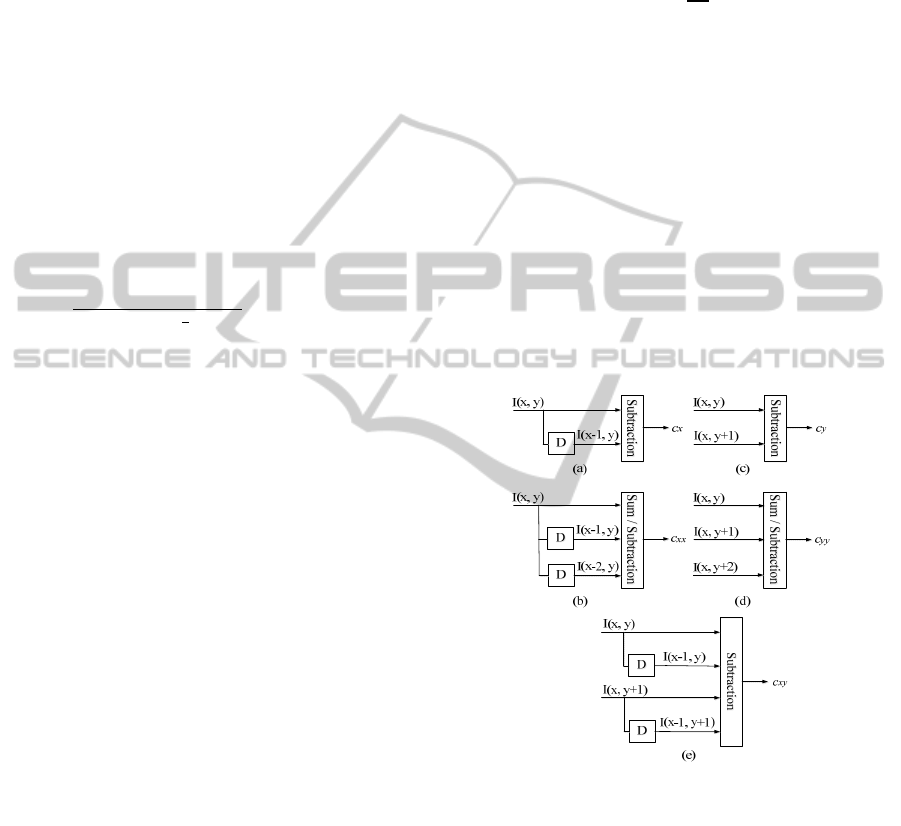
2.2.1 E
term
c
x
, c
xx
, c
y
and c
yy
are the 1D convolutions, each
coefficient can be described as illustrated in figure 2
(a, b, c and d) and c
xy
is the 2D convolution, it can be
described as illustrated in figure 2 (e).
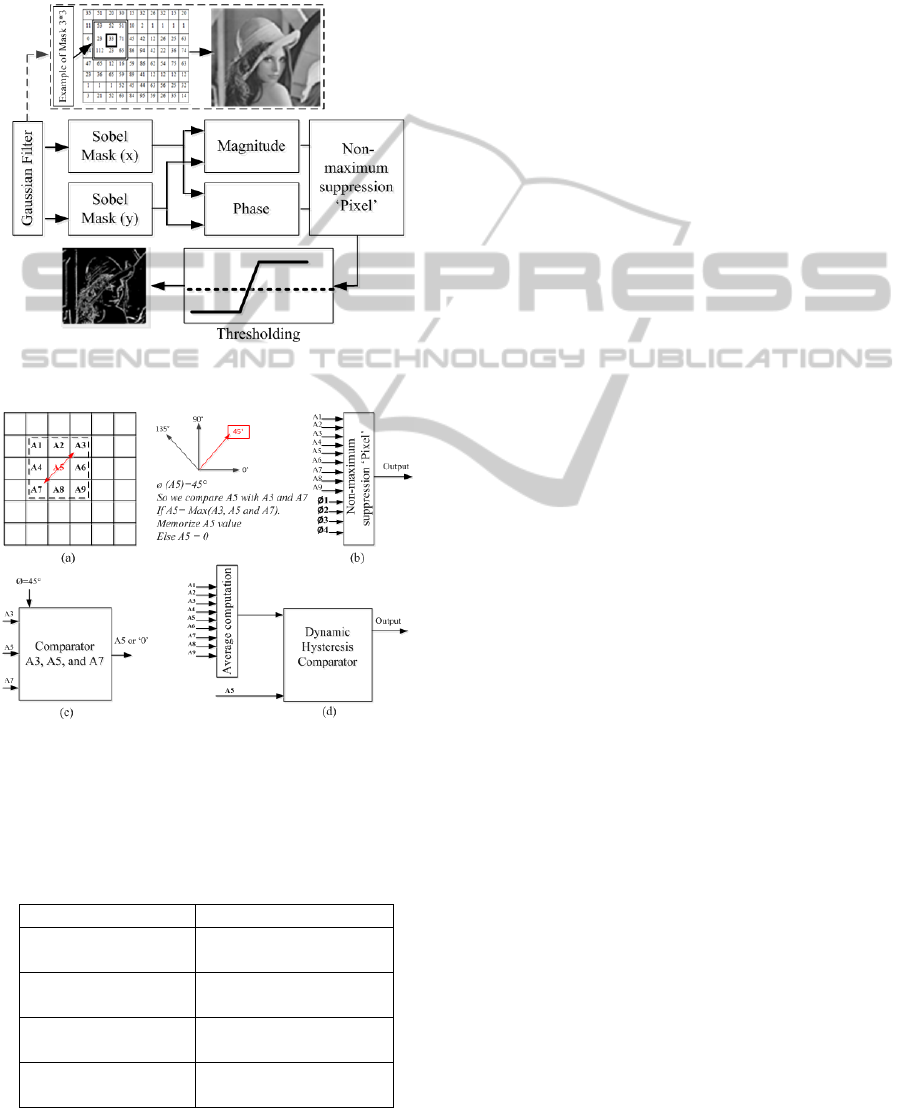
2.2.2 E
contour
It is representing the negative of the square intensity
gradient, as shown in figure 3. This energy can be
computed using the Canny approach, with a
Gaussian mask (3*3) convolved with the image for
noise reduction (Canny 1986). We computed
horizontal and vertical Sobel masks the same as the
Gaussian mask, and the gradient phase can be
described by the following equation:
(9)
where S
x
and S
y
are the convolution result with
vertical and horizontal Sobel filter respectively.
We considered four values for the phase gradient:
0°, 45°, 90° and 135°, where phase approximation
can be described in Table 1. It’s simple to compute
gradient phase where the multiplication and division
is the delay by left and right respectively. Figure 4
can be described by implementation of gradient
phase approximation. Non-maximum suppression
was used to determine the local maximum pixel
value, which is compared to the magnitude of
adjacent pixels depending on phase gradient. An
example in the following figure (see Fig. 4 a, b and
c) can be described by a non-maximum suppression
computation.
Figure 2: Schema blocks of term energy, (a) Filter by 1D
convolution of two coefficients depending on x, (b) Filter
by 1D convolution of three coefficients depending on x,
(c) Filter by 1D convolution of two coefficients depending
on y, (d) Filter by 1D convolution of three coefficients
depending on y, (e) Filter by 2D convolution of four
coefficients depending on x and y.
A thresholding based on two levels, low and high,
called dynamic hysteresis. These two levels vary
depending on pixel position. We compute the
average of the mask where the center is the pixel
position. Dynamic hysteresis thresholding is
presented in figure 4.d. We completed architecture
of E
contour
via thresholding step and the preliminary
SnakeMethodEnhancedusingCannyApproachImplementationforCancerCellsDetectioninRealTime
189
simulation result represents the efficiency of this
new architecture of external energy. A medical
image of cancer cells was taken and we applied our
active contour implementation. The results of our
cancer cell detection are presented in the following
section.
Figure 3: Schema blocks of Canny approach applied on
image.
Figure 4: Example of the non-maximum suppression and
thresholding computation , (a) example of non-maximum
suppression, (b) non-maximum suppression implemented
model, (c) block of non-maximum suppression applied of
example in (a) and (d) Dynamic hysteresis thresholding
model.
Table 1: Proposed approximation of gradient phase.
Gradient phase (θ) Sy/Sx
θ
1
= 0° where
0° <θ < 22.5°
0< Sy< Sx/2
θ
2
= 45° where
22.5° < θ < 67.5°
Sx/2< Sy< 2*Sx
θ
3
= 90° where
67.5° < θ < 112.5°
Sy>2*Sx
θ
4
= 135° where
112.5° < θ < 157.5°
-Sx/2< Sy< -2*Sx
3 EXPERIMENTAL RESULTS
We provide some results on histopathological
images of cell detection (Benign Hyperplasia,
Intraepithelial Neoplasia and Carcinoma) to
demonstrate the improvements obtained using our
architecture. All experiments were done on Xilinx
ISE 12.3-FPGA technology using VHDL structural
description and Matlab 2012a. Execution time on the
order of milliseconds achieved complete active
contour. The computation time of processing
depends on the type of image, size, and number of
objects inside the image. Hence, it is difficult to
determine the processing time exactly. However, our
goal in this work was to find abnormal cells via
active contour in real time using Xilinx ISE tool (see
Figures 5 and 6). This work is one part of a global
project which depends on several constraints such as
automatic optical microscopy system, cancer cell
detection in real time (Chaddad 2011b, 2013a), and
grade classification of cancer cells. Automatic
reading of microscopic images includes several
consecutive steps in its process. The system must
segment an image through detecting and extracting
cells from their surrounding medium using
morphological image processing. However, the
appropriate segmentation technique must be
carefully selected to process microscopic images
that are high resolution gray scale and multispectral
images. Following detection of cells within an
image, the system must extract some characteristic
parameters in order to distinguish cancerous from
normal cells (Chaddad 2011a). The effectiveness of
an automatic reading method is generally assessed
by its capacity to analyze and interpret a large
number of images in a short time. The problem of
time computation is still under investigation when
there is a need to analyze very large images on
different spectral bands. For example, the
experimental results in (Sieler 2010) showed that the
calculation time for gray level co-occurrence matrix
(GLCMs) and Haralick texture features without
segmentation step for an image of size 5000*5000
with 16 frequency bands is approximately 350
seconds using a software solution based on a
Pentium 4 machine running at 2400 MHz. This
effect is directly related to the nature of von
Neumann architecture which cannot operate in a
parallel fashion. Therefore, in order to reduce the
processing time when including the segmentation
step, expensive parallel high computing systems
based on specific hardware components and large
memory storage are designed in order to
efficiently compute and perform fast texture analysis
BIODEVICES2014-InternationalConferenceonBiomedicalElectronicsandDevices
190
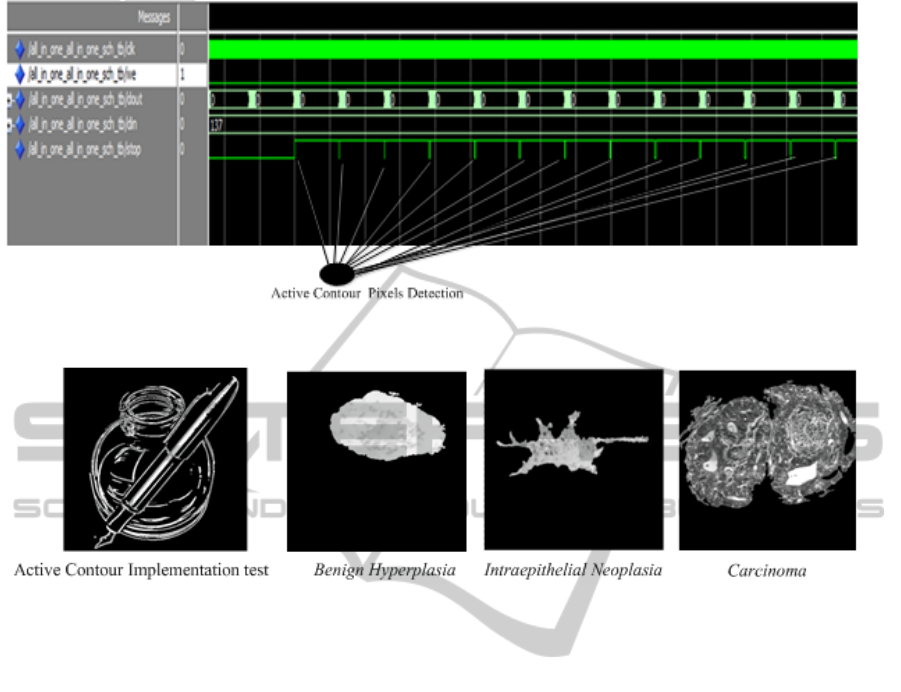
Figure 5: Simulation results from Xilinx ISE tool.
Figure 6: Simulation results of the active contour implementation using FPGA technology.
(Sieler 2010). On the other side, object extraction
from shape information in the image is also another
important task in biomedical image analysis
(Chaddad 2013b). For accurate extraction from very
high resolution images, object geometry can be
taken into account without the drawback of the
prohibitive computation time.
4 CONCLUSIONS
This paper has proposed and implemented an active
contour architechture for the detection of abnormal
cells. The experimental results showed that the
Snake method using the implementation of the
Canny approach in external energy provides good
performance of cancer cell detection. This
architecture applied to images of size 128*128
resulted in highly improved processing times (ms)
and can be extended to process larger images of
various types. External energy is implemented into a
single FPGA without the use of any external
memory. It also has been proven that by adding new
term of Canny approach to the classical Snake
method, its performance also increases. The power
of this method resides in its ability to detect the
Carcinoma type that was previously difficult to
capture it in short time. Therefore, the proposed
model of implementation allows accurate and
efficient dynamic segmentation of images containing
distinct objects in a limited time. This model is
useful in automatic segmentation of different
histopathological images and thus allowing a faster
detection of cancer cells using optical microscopic
bio-images. Robust cancer cell detection using
optical microscopy is a future continuation of this
work. Such an endeavor, which considers many
steps, interprets the various surpervised methods of
classification and detects the cancer cells in a
continous grade in order to treat this malignant
disease.
ACKNOWLEDGEMENTS
Authors would like to acknowledge the service
Anapat of the CHU hospital of the Nancy-Brabois
and the Architecture of Embedded Systems and
Smart Sensors (ASEC) team.
SnakeMethodEnhancedusingCannyApproachImplementationforCancerCellsDetectioninRealTime
191

REFERENCES
Castanon, CAB., Fraga, JS., Fernandez, S., Gruber, A.,
Costa, LF., 2007. Biological shape characterization
for automatic image recognition and diagnosis of
protozoan parasites of the genus Eimeria. Pat Recog
vol. 40, pp. 1899-1910.
Wang, X., Li, S., Liu, H., Wood, M., Chen, WR., Zheng,
B., 2008. Automated identification of analyzable
metaphase chromosomes depicted on microscopic
digital images. J Biomed Inf ., 41(2):264 71.
Cataldo, SD., Ficarra, E., Acquaviva, A., Mecii, E. 2010.
Achieving the way for automated segmentation of
nuclei in cancer tissue images through morphology-
based approach: a quantitative evaluation. Comp Med
Imag Graph.., 34(6):453 61.
Szilágyi, L., Szilágyi, S.M., Benyó, B., Benyó, Z., 2011.
Intensity inhomogeneity compensation and
segmentation of MR brain images using hybrid c-
means clustering models. Original Biomedical Signal
Processing and Control, Volume 6, Issue 1, 3-12.
Chaddad, A., Tanougast, C., Dandache, A., Bouridane, A.,
2011. Extracted Haralick’s Texture Features and
Morphological Parameters from Segmented
Multispectrale Texture Bio-Images for Classification
of Colon Cancer Cells. WSEAS Transaction on
Biology and Biomedicine Journal, Volume 8, Issue 2,
pp. 39-50.
Chaddad, A., et al., 2012. Evaluation of Different Shape
Parameters to Distinguish between Three Abnormally
Cancer Types of Cells. Journal of Computer Vision
and Image Processing, Vol.2, No.4, pp.17-28.
Kass, M., Witkin, A., Terzopoulos, D., 1988. Snakes:
active contour models. International Journal of
Computer Vision, vol. 1, no. 4, pp. 321–331.
Caselles, V., et al., 1993. A geometric model for active
contours in image processing. Numerische
Mathematik, vol. 66, no. 1, pp. 1–31.
Malladi, R., Sethian, JA., Vemuri, BC., 1995. Shape
modeling with front propagation: a level set
approach. IEEE Transactions on Pattern Analysis
and Machine Intelligence, vol. 17, no. 2, pp. 158–
175.
He, L., et al., 2008. A comparative study of deformable
contour methods on medical image segmentation.
Image and Vision Computing, vol. 26, no. 2, pp. 141–
163.
Chen, S. Y., Guan, Q., 2011. Parametric shape
representation by a deformable NURBS model for
cardiac functional measurements. IEEE Transactions
on Biomedical Engineering, vol. 58, no. 3 PART 1,
pp. 480–487.
Chen, S. Y., Yao, Al., 2012. Recent advances in
morphological cell image analysis. Computational
and Mathematical Methods in Medicine, vol.
2012(2012).
Canny, J., 1986. A Computational Approach to Edge
Detection. IEEE Transactions on Pattern Analysis
and Machine Intelligence, Vol 8, No. 6, pp. 679-698.
Chaddad, A., Tanougast, C., Dandache, A., Bouridane, A.,
2011. Classification of Cancer Cells Based on
Morphological Features from Segmented
MultiSpectral Bio-Images. Recent Advances in
Applied & Biomedical Informatics and
Computational Engineering in Systems Applications,
August 23-26.
Chaddad, A., Maamoun, M., Tanougast, C., Dandache, A.,
2013. Hardware Implementation of Active Contour
Algorithm for Fast Cancer Cells Detection. IEEE
29th Southern Biomedical Engineering Conference,
May 3-5.
Sieler, L., Tanougast, C., Bouridane, A., 2010. A scalable
and embedded FPGA architecture for efficient
computation of Grey Level Co-occurrence Matrices
and Haralick textures features. Microprocess
Microsyst., 34:14–24.
Chaddad, A., Tanougast, C., Golato, A., Dandache, A.,
2013. Carcinoma cell identification via optical
microscopy and shape feature analysis. Journal of
Biomedical Science and Engineering, 6, pp. 1029-
1033.
BIODEVICES2014-InternationalConferenceonBiomedicalElectronicsandDevices
192
