
Multi-dimensional Pattern Mining
A Case Study in Healthcare
Andreia Silva and Cl´audia Antunes
Department of Computer Science and Engineering,
Instituto Superior T´ecnico, University of Lisbon, Lisbon, Portugal
Keywords:
Healthcare, Hepatitis Dataset, Pattern Mining, Association Rules, Multi-dimensionality.
Abstract:
Huge amounts of data are continuously being generated in the healthcare system. A correct and careful anal-
ysis of these data may bring huge benefits to all people and processes involved in the healthcare management.
However, the characteristics of healthcare data do not make this job easy. These data are usually too complex,
massive, with high dimensionality, and are irregularly distributed over time. In the last decade, data mining
has begun to address this area, providing the technology and approaches to transform these complex data into
useful information for decision support. Multi-relational data mining, in particular, has gained attention since
it aims for the discovery of frequent relations that involve multiple dimensions. In this work we present a
case study on the healthcare domain. Using the Hepatitis dataset, we show how that data can be modeled and
explored in a multi-dimensional model, and we present and discuss the results of applying a multi-dimensional
data mining algorithm to that model.
1 INTRODUCTION
Huge amounts of data are continuously being gener-
ated in the healthcare system. The analysis of these
data is mandatory, since it may help in many areas of
healthcare management, such as evaluating treatment
effectiveness, understanding causes and effects, an-
ticipating future demanded resources, predicting pa-
tient’s behaviors and best treatments, defining best
practices, etc. (Koh and Tan, 2005; Kaur and Wasan,
2006). Due to the nature of this information, results of
these analysis may make the difference, by decreasing
healthcare costs and, at the same time, improving the
quality of healthcare services and patients’ life.
Healthcare data are usually massive, too sparse
and complex to be analyzed by hand with traditional
methods. In the last decade, data mining has begun to
address this area, providing the technology and ap-
proaches to transform huge and complex data into
useful information for decision making (Koh and Tan,
2005). Data mining (DM) is defined as the “non triv-
ial extraction of implicit, previously unknown, and
potentially useful information about data” (Frawley
et al., 1992). It has been successively applied to
many different subfields of healthcare management,
which results proved to be very useful to all parts in-
volved (Koh and Tan, 2005; Kaur and Wasan, 2006).
One of the characteristics of the data collected
in the healthcare domain is their high dimensional-
ity. They include patient personal attributes, resource
management data, medical test results, conducted
treatments, hospital and financial data, etc. Thus,
healthcare organizations must capture, store and an-
alyze these multi-dimensional data efficiently.
Multi-Relational Data Mining, or MRDM
(Dˇzeroski, 2003) is an area that aims for the discov-
ery of frequent relations that involve multiple tables,
in their original structure, i.e. without joining all
the tables before mining. In recent years, the most
common mining techniques have been extended to
the multi-relational context. However, there are few
capable of dealing with a massive number of records,
and of taking into consideration all dimensions at the
same time (Silva and Antunes, 2012).
In this work we present a case study on the health-
care domain, showing how existing data can be ex-
plored. The case is based on the use of the Hepatitis
dataset, created by Chiba University Hospital, con-
taining information about 771 patients having hep-
atitis B or C, and more than 2 million examinations
dating from 1982 to 2001. This dataset is organized
in a relational model that may help data storage, but
hinders data analysis, since the same type of infor-
mation is scattered through different tables, and it is
not easy to inter-relate the data in a timeline. In this
work we propose a multi-dimensional model for the
273
Silva A. and Antunes C..
Multi-dimensional Pattern Mining - A Case Study in Healthcare.
DOI: 10.5220/0004898802730280
In Proceedings of the 16th International Conference on Enterprise Information Systems (ICEIS-2014), pages 273-280
ISBN: 978-989-758-027-7
Copyright
c
2014 SCITEPRESS (Science and Technology Publications, Lda.)

Hepatitis dataset, that makes it possible an efficient
analysis and knowledge extraction. We also present
some statistics, in order to better understand the the
distributions of the data in this domain. After model-
ing the dataset through a multidimensional model, we
analyze the application of data mining to these mod-
els, and present the results of applying a traditional
MRDM algorithm – the StarFPStream (Silva and An-
tunes, 2012), to the proposed model. Results show
that using this model it is possible to mine these data
efficiently to address several goals, and that it is pos-
sible to find interesting relations. However, due to
the nature and distributions of these data, there is the
need for further analysis, with e.g. the application of
different types of algorithms.
Section 2 describes the Hepatitis dataset and sec-
tion 3 proposes a multi-dimensional model for the
Hepatitis data, in order to promote their analysis for
decision making. Section 4 describes how can we ap-
ply data mining to a multi-dimensional model, and
section 5 shows and discusses our goals, approaches
and results. Finally, section 6 concludes the work.
2 THE HEPATITIS CASE STUDY
The Hepatitis dataset
1
contains informationabout lab-
oratory examinations and treatments taken on the pa-
tients of hepatitis B and C, who were admitted to
Chiba University Hospital in Japan. There are 771
patients, and more than 2 million examinations dating
from 1982 to 2001, from about 900 different blood
and urine types of exams. The dataset also contains
data about the biopsies (about 695 biopsy results) and
interferon treatments (about 200) performed to pa-
tients. Biopsies reveal the true existence of hepatitis
and respective fibrosis state. However, they are in-
vasive procedures, and therefore there is an interest
in finding other indicators that allow the detection of
hepatitis in a more friendly way. Interferon treatments
have also been seen and used as an effective way to
treat hepatitis C, although it has tough side effects,
and its efficacy is not yet proved. Hence there is the
need to understand the impact of this treatment.
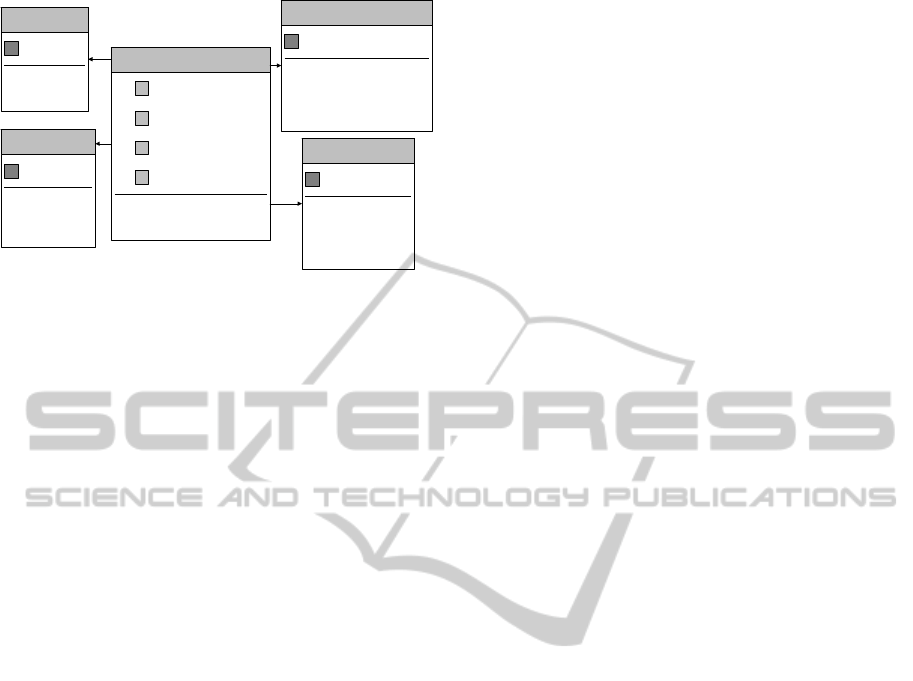
The hepatitis dataset is composed of several data
tables, modeled in a relational schema centered on the
patient. This model is shown in figure 1. Each patient
may have performed some biopsies, several hemato-
logical analysis, in-hospital and out-hospital exams,
and may also be under interferon therapy. Each one
1
The Hepatitis dataset was made available as part
of the ECML/PKDD 2005 Discovery Challenge: http://
lisp.vse.cz/challenge/CURRENT/
Patient
Interferon
Therapy
Hematological
Analysis
In-Hospital
Examination
Results of
Biopsy
Out-Hospital
Examination
Figure 1: Hepatitis relational model (Pizzi et al., 2005).
of these aspects is stored in one different table and is
independent of the others.
Despite being modular, this schema does not fa-
cilitates the analysis of these data, for several rea-
sons: (1) the various exams – both in-, out-hospital
and hematological analysis – are not directly related,
although the same type of exams may be present in
more than one table; (2) relating both exams, or ex-
ams and biopsies or interferon therapy requires join-
ing the tables for a common analysis. This process
of joining the tables is time consuming and non triv-
ial, and the resulting table hinders the analysis, since
it will contain lots of redundant data, as well as lots
of missing values; and (3) time is not directly mod-
eled, and therefore there is no easy way to understand
the interconnection between co-occurring events (e.g.
exam results during interferon therapy), neither the
disease evolution. Moreover, most data are distributed
irregularly, either in time, as well as per patient, mak-
ing a direct analysis unfeasible.
The work presented in (Pizzi et al., 2005) is the
first step on the multi-dimensionalanalysis of the hep-
atitis data. The authors use a multi-relational algo-
rithm to connect biopsies and urinal exams, and to
generate association rules that estimate the stage of
liver fibrosis based on lab tests. However, they are
only able to mine two dimensions of the relational
model at a time, and therefore they cannot relate
the biopsies with, for example, both the blood tests
(Hematological Analysis) and the other tests (In- and
Out-Hospital Examinations).
3 THE MULTI-DIMENSIONAL
MODEL
As stated before, one of the characteristics of the data
collected in the healthcare domain is their high di-
mensionality. In the case of the Hepatitis dataset,
we have administrative data such as patient’s features
(sex and date of birth), pathological classification of
the disease (given by biopsy results), duration of inter-
feron therapy, and temporal data about the blood and
urine tests performed to patients. Note that we could
have more data, such as treatment and tests’ cost,
hospital data related to out-hospital exams, informa-
ICEIS2014-16thInternationalConferenceonEnterpriseInformationSystems
274
!"#$%&#
'"#%
()"*+,-%
.$/-0,
()"*$&"#$/&1%023#0
!"#$%'
!5
6%)
78%
.$9#:;%"9
.$9#:'%<"=%
'"#%4'
!5
>/&#:
;%"9
()"*4'
!5
?/=%@"*%
@/9*"3A--%9./2&=
@/9*"3B/C%9./2&=
A&$#
.$/-0,4'
!5
+,-%
D$E9/0$0
7<#$F$#,
!"#$%'
D5
1%023#
4&4&#%9G%9/&+:%9"-,H
()"*4'
D5
.$/-0,4'
D5
'"#%4'
D5
Figure 2: Hepatitis star schema.
tion about doctors in charge of patients, etc., which
would increase the dimensionality of the dataset and
the complexity of the relational model.
One efficient way to store high-dimensional data
is through the use of a multi-dimensional model – a
star schema, in particular. A star schema clearly di-
vides the different dimensions of a domain into a set
of separated data tables, interrelated by a central table,
representing the occurring events. In the case of the
Hepatitis data, we can identify several dimensions –
patient, biopsy, possible exams and date information
– and events correspond to patient examinations.
In this sense, one of the possible star schemas
that can be defined is proposed in figure 2. The star
schema is composed of 4 dimensions (Patient, Biopsy,
Exam Type and Date) and one central fact table that
corresponds to the Examination Results. Each dimen-
sion is independent and contains the respective char-
acteristics (Patient contains patients’ features, and
Exam Type contains data about possible exams, like
upper and lower bounds and units). By analyzing the
central table, we can understand the relation between
all dimensions: one patient P, with active biopsy B,
performed exam E on date D. The result of this event
was r (given by attribute Result in the central table),
and at the moment of this examination, it was (or
not) being administrated interferon therapy (attribute
InInter feronTherapy?).
Adding new dimensions to this star schema is
straightforward. For example, we could add dimen-
sions Hospital and Doctor just by adding the respec-
tive keys into the central table, and each event in that
table would correspond to one exam E, performed to
patient P, with active biopsy B, on date D, in hospital
H with doctor Doc.
3.1 Building the Star Schema
In order to build our star schema, we had to perform a
pre-processing phase to join exam data from the dif-
ferent tables and improve their quality.
First, we decided to reduce data and select only
the most significant exams, based on the report car-
ried out by (Watanabe et al., 2003). These exams are
GOT, GPT, ZTT, TTT, T-BIL, D-BIL, I-BIL, ALB,
CHE, T-CHO, TP, WBC, RBC, HGB, HCT, MCV and
PLT. In this sense, dimension Exam Type contains the
known data about these exams (i.e. code, bounds and
units). The reason for this data reduction is that other
exams are so rare that one cannot draw any conclu-
sion based on them. Another reason is the fact that,
due to the lack of domain knowledge, we can only
interpret the results of these exams (as normal or ab-
normal results). Dimension Patient is equivalent to
the original table in the Hepatitis dataset, and Biopsy
contains only the possible outputs of biopsies (type
can be B or C, the fibrosis state varies from 0 to 4,
and respective activity from 0 to 3). Note that dimen-
sion Date contains all dates from 1982 to 2001 and is
trivial to generate.
Since these exams are spread in both Hemato-
logical Analysis, In- and Out-Hospital Examination
tables, each row of these tables corresponds to one
event (one examination) in the central table of the star
schema. Then, exam results were categorized into 7
degrees: extremely, very or simply high (UH, VH, H),
normal (N), low, very or extremely low (L, VL, UL).
The thresholds and categories for each of the selected
exams are described in (Watanabe et al., 2003), and
are not presented here due to space restrictions. The
exam results of patients with more than one result for
the same type of exam in one day were averaged.
Fibrosis are considered stable 500 days before
and 500 days after a biopsy (Watanabe et al., 2003).
Therefore, for each examination in the central table,
the correspondingactive biopsy is the most recent one
performed for the patient, within the 500 days interval
(or none).
Finally, interferontherapy data was also integrated
in the multi-dimensional star, by marking all exami-
nations in the central table made during the adminis-
tration of this therapy (using the information on the
Interferon Therapy table of the relational model).
3.2 Understanding the Data
After building the star schema for the Hepatitis
dataset as described above, it resulted in a central
table with almost 600 thousand examinations per-
formed, for 722 patients (the other 50 patients have
not performed none of the most significant exams,
therefore they remain on the Patient dimension, but
are not present in the central table).
In order to better understand the domain in ques-
Multi-dimensionalPatternMining-ACaseStudyinHealthcare
275
0
500
1000
1500
2000
2500
3000
3500
F M
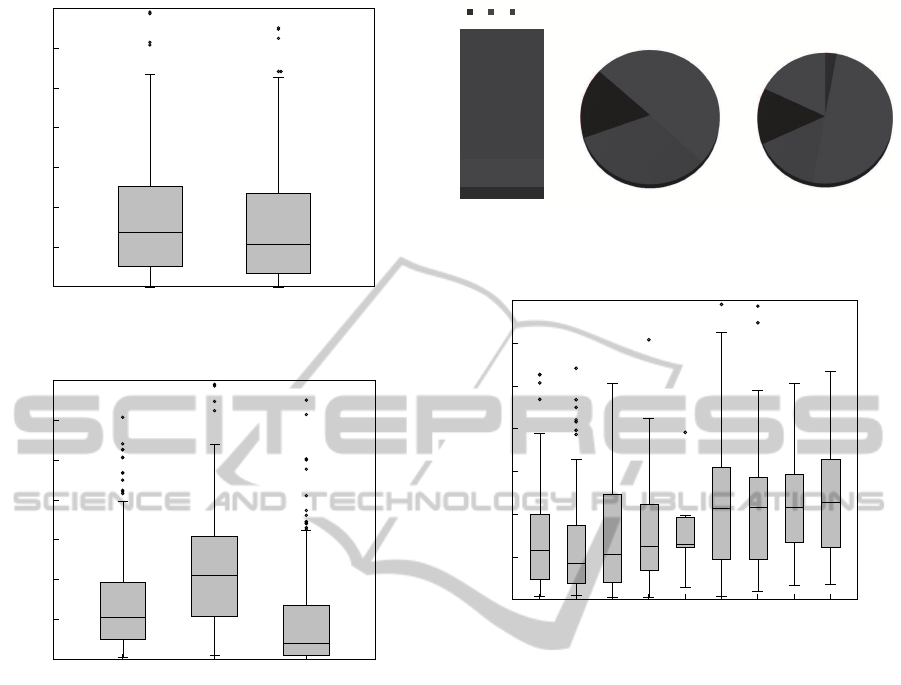
Figure 3: Number of exams per patient (feminine and mas-
culine).
0
500
1000
1500
2000
2500
3000
3500
B C Unknown
Figure 4: Number of exams per patient diagnosed with hep-
atitis B, C or still undiagnosed (none).
tion, figure 3 shows the distribution of the exams per
patient. We can see that, on one side, there are pa-
tients with just a few exams, and on another side,
patients with more than 2500 exams. However, in
average, each patient performed about 500 - 700 ex-
ams. Also, only 30% of all patients are feminine, but
women perform, in average, more exams than men.
From these patients, 234 have not performed any
biopsy, which means that they were not diagnosed
with any type of hepatitis, yet. The number of ex-
aminations performed to patients with hepatitis B, C
or none is shown in figure 4. Note that, from all pa-
tients, only 27.5% were diagnosed with hepatitis B, at
some point in time, 40% with hepatitis C, and the rest
32.5% have no biopsy. We can see in that figure that
patients with hepatitis C perform much more exams
than patients with hepatitis B. One possible explana-
tion is the fact that hepatitis C has been treated with
interferon therapy, and therefore more exams (and
biopsies) are performed to check if results improve.
Also, patients with no biopsy made much less
exams than the others. This may indicate that they
!"#$%
&'"($%
!'"'$%
)% *% +,-,"%
)&%
.!$%
)/%
..$%
).%
&!$%
)(%
&.$%
!"#$%%&'('
*#%
.$%
*&%
0#$%
*/%
&0$%
*.%
&($%
*(%
&1$%
!"#$%%&')'
Figure 5: Distribution of exams per state of hepatitis (i.e.
exams that, when performed, there was a valid biopsy indi-
cating the fibrosis state).
0
500
1000
1500
2000
2500
3000
3500
B1 B2 B3 B4 C0 C1 C2 C3 C4
Figure 6: Number of exams per patient, at each state of
hepatitis.
did not undertake the biopsy, because doctors thought
these patients were not infected with hepatitis B or C,
and therefore the biopsy was not necessary.
Figure 5 presents the variation of the number of
exams per state of hepatitis (fibrosis). A value of 0
means that there is no fibrosis, and 4 that the state of
the fibrosis is severe. Note that only one fifth of the
total examinations (about 137 hundred)are performed
while there is a valid biopsy (they are active 500 days
before and after they are conducted).
As expected, there are more cases of hepatitis in
their early states than in severe states. In the case of
hepatitis C, 50% of all performed exams correspond
to patients in state 1 of fibrosis. This means that, in
order to find correlations between exams and fibrosis
states, we are analyzing patterns that are common to
a very small percentage of data.
The number of exams per patient, at each state of
hepatitis does not suffer many changes, as can be seen
in figure 6. Furthermore, it is stable for patients with
hepatitis C, with the exception of state 0 (no fibrosis).
This can again be explained by the application of in-
terferon therapy and respective evolution check.
ICEIS2014-16thInternationalConferenceonEnterpriseInformationSystems
276

4 MULTI-DIMENSIONAL DATA
MINING
Data mining (DM) is defined as the non trivial extrac-
tion of implicit, previously unknown, and potentially
useful information about data.
In order to deal with multiple tables, data min-
ing has to join somehow the different tables, creat-
ing the tuples to be mined. An option that allows
the use of the existing single-table algorithms, is to
join all the tables in one before mining (a step also
known as propositionalization or denormalization).
At a first glance, it may seem easy to join the tables
into one, and then do the mining process on the joined
result (Ng et al., 2002). However, when multiple ta-
bles are joined, the resulting table will be much larger
and sparser, with many repetitions of the same values,
and the mining process more expensive and time con-
suming. Moreover, these repetitions of values may
cause distortions in the calculations of the measures
of interest and therefore hinder the discoveryof really
interesting patterns.
Multi-Relational Data Mining, or MRDM
(Dˇzeroski, 2003) is an area that aims for the discov-
ery of frequent relations that involve multiple tables,
in their original structure, i.e. without joining all the
tables before mining.
In recent years, the most common mining tech-
niques have been extended to the multi-relational con-
text (Dehaspe and Raedt, 1997; Ng et al., 2002;
Xu and Xie, 2006; Silva and Antunes, 2010; Silva
and Antunes, 2012). However, there are few capa-
ble of dealing with high number of records, and of
taking into consideration all dimensions at the same
time (Silva and Antunes, 2012).
Frequent pattern mining is a sub-area of data min-
ing that aims for enumerating all frequent patterns
that conceptually represent relations among entities.
A well-known example of a transactional pattern is
a market-basket: the set of items that are bought to-
gether frequently by a customer. In this healthcare do-
main, an example of a transactional pattern is a set of
frequent examinations performed and respective re-
sults. These frequent patterns can then be exploited in
various ways: for further direct analysis, for creating
association rules (Srikant, 1996), expressing tenden-
cies, and also, for example, for improving classifica-
tion results and predictions.
4.1 Problem Definition
Following the example of the star schema in figure 2,
dimensions (e.g. Patient) are composed of a pri-
mary key (e.g. PatientID) and a set of attributes de-
scribing the dimension (e.g. Sex and Age). Each
dimension can be seen as a simple set of pairs (at-
tribute, value), corresponding to the characteristics of
the elements of that dimension. For example, patient
1 = {(Sex, M), (Age,30), ...}. In the context of data
mining, an item is one of those pairs, and an itemset
is just a set of pairs.
The central fact table (ExperimentationResults)
contains one foreign key for each dimension, and a set
of measurement fields. Conceptually, it comprises all
business events (the actual occurrences). In this case,
our fact table contains all performed examinations.
The support of an itemset is defined as the num-
ber of its occurrences in the database. In the case of
a database modeled as a star schema, the number of
occurrences of one item of some dimension (one pair
attribute − value) depends on the number of occur-
rences of the respective transactions in the central ta-
ble. A pattern P is a frequent itemset, i.e. an item-
set whose support is greater or equal than a user de-
fined minimum support threshold, and the problem of
multi-dimensional frequent pattern mining over star
schemas is to find all patterns in a star.
An association rule is an expression of the form
X ⇒ Y, where X and Y are sets of items (Srikant,
1996), and the intuitive meaning of such a rule is that
database records which contain X tend to contain Y.
They are built according to frequent patterns, and the
support of a rule is the number of occurrences of X
and Y, together, in the database. Another interest-
ing measures used to evaluateassociation rules are the
confidence and the lift. The confidence of a rule is the
ratio between the support of the rule and the support
of the antecedent, i.e. the probability ofY occur when
X occurs. The lift measures the importance or unex-
pectedness of a rule. It is defined as the ratio between
the confidence of the rule and its expected confidence
(assuming X and Y are independent), and therefore
the farther lift values are from 1, the more unexpected
and important are the rules.
4.2 Related Work
There are many stand-alone algorithms to mine dif-
ferent types of patterns in traditional databases, but
just some of these algorithms have been extended to
the multi-relational case. In this work we focus on
frequent pattern mining over star schemas. The first
multi-relational methods have been developed by the
Inductive Logic Programming community about ten
years ago (Dehaspe and Raedt, 1997), but they are
usually not scalable with respect to the number of re-
lations and attributes in the database and they need
all data in the form of prolog tables. An apriori-
Multi-dimensionalPatternMining-ACaseStudyinHealthcare
277

based algorithm was introduced in (Crestana-Jensen
and Soparkar, 2000), which first generates frequent
tuples in each single table, and then looks for fre-
quent tuples whose items belong to different tables
via a multi-dimensional count array; (Ng et al., 2002)
proposed an algorithm that mines first each table sep-
arately, and then two tables at a time; (Xu and Xie,
2006) presented MultiClose, that first converts all di-
mension tables to a vertical data format, and then
mines each of them locally, with a closed algorithm.
The algorithm StarFP-Growth (Silva and An-
tunes, 2010) is a pattern-growth method that is able
to mine all dimensions without physically join them.
The idea is simple and consists in finding first all fre-
quent patterns in each dimension, based on the sup-
port given by the central table, and then finding all
multi-dimensional patterns by using the central ta-
ble again to know how and what local patterns co-
occur. The algorithm uses an efficient tree structure
to store the frequent itemsets, as well as an efficient
pattern-growth strategy to generate and propagate the
co-occurrences in a divide and conquer manner, and
without the need for candidate generation.
In this work we decided to use StarFP-Growth,
since it works directly on the whole star, and it is an
efficient multi-dimensional algorithm.
5 RESULTS AND DISCUSSION
For the analysis of the hepatitis star schema, we de-
cided to address two topics of interest, suggested for
this dataset: (1) Discover the differences between
patients with hepatitis B and C; and (2) Evaluate
whether laboratory examinations can be used to es-
timate the stage of liver fibrosis. This second topic is
of particular importance, since biopsies are invasive
to patients, and therefore doctors try to avoid them.
By using the star in figure 2 we are able to re-
late the exams (and other dimensions) with the type
of hepatitis, as well as with the fibrosis state. We can
look for what examination results are common (fre-
quent) along with hepatitis B or/and C, and see the
differences (goal 1). Similarly, we can look for fre-
quent exam results for each fibrosis state (goal 2), and
then, for example, use those patterns to help classify-
ing other patients with similar results.
5.1 Approach
At a first glance, the approach to follow may seem
straightforward: we may apply StarFP-Growth to the
hepatitis star, and choose all patterns that relate some
examination result with hepatitis types and fibrosis
states. However, as seen in section 3.2, only less than
1 fourth of all examinations have an active biopsy as-
sociated. In particular, 16% of examinations corre-
spond to hepatitis C, and only 7% to hepatitis B.
First, this means that, to find the hepatitis type B
as a frequent item (the same is valid for hepatitis C),
we have to select a very low support, and in order
to find some examination that is frequent along with
hepatitis B, we have to set the support to even lower
values. Furthermore, if we look to the frequency of
examinations corresponding to each fibrosis state, we
are talking about even lower supports. This leads to
lots of uninteresting and possibly misleading patterns.
And second, if we are using all data to contribute
for the support, highly frequent patterns (> 16% +7%
= 23%) are frequent because they co-occur more in
data with no biopsy information. And this means that
they are not interesting because they cannot discrimi-
nate any type of hepatitis (at most, they can discrimi-
nate the non existence of hepatitis, if they are not fre-
quent for any type of hepatitis).
In this sense, we decided to constrain the data, and
apply StarFP-Growth with low supports: (1) B: to all
examinations with hepatitis B; (2) C: to examinations
with hepatitis C; and (3) None: to all exams with no
biopsy data. This way, we found 3 sets of patterns:
B, C and None. And then, we generated the associ-
ation rules (with respective support, confidence and
lift measures), based on the discovered patterns (also,
3 sets of rules, B, C and None).
Next, for the analysis, we categorized patterns and
rules as discriminating or non-discriminating. A pat-
tern is discriminating if it belongs to group B or/and
C, but not to group None, i.e. if it is frequent for some
type of hepatitis, and it is not frequent for those that
are not diagnosed yet. Additionally, a pattern that be-
longs only to group None is also discriminating, since
it may be a good to indicate that a patient do not have
hepatitis. Patterns that belong to some group of hep-
atitis and at the same time to group None, are non-
discriminating, and thus not interesting. Discriminat-
ing patterns may be used to address goal 1, i.e. to
understand the differences between hepatitis B and C.
Finally, we analyzed association rules that impli-
cate some state of fibrosis, to understand if the state
can be estimated by examination results (goal 2).
5.2 Interesting Patterns
Table 1 presents a subset of the frequent patterns
found, with information about results and fibrosis. As
expected, the supports of these patterns are very low
(around 1%), in both groups. Patterns with more sup-
port correspond to patterns that are not discriminant
ICEIS2014-16thInternationalConferenceonEnterpriseInformationSystems
278

Table 1: Some examples of the patterns found in the hepati-
tis dataset.
!"##$%& ' ( )*&$
+,-.%,/,&"�
1 23$-45#63'(789 1: ;$-<2'9
= 23$-45#6>!?7@89 1: ;$-<2'9
A 23$-45#6>!?7B89 1: =: 1: )*
C
23$-45#6>!?789 =: =: A: )*
D 23$-45#6>E?7B89 1: 1:
;$-<2'<"&F<(9
G 23$-45#6>E?789 A: A: A: )*
H 23$-45#68(?789 =:
=:
1: )*
I 23$-45#6(8J7BK9 C: 1: )*<L
M 23$-45#6NK'7K9 1: ;$-<2)*&$9
1O 23$-45#6!K?7BK9 1: ;$-<2)*&$9
11 2P$Q6RS3$-45#6>!?7B89 1: 1:
;$-<2'<"&F<(9
1= 2P$Q6RS3$-45#6(8J7BK9 A: ;$-<2'9
1A 2T,U%*-,-61S3$-45#6(8J7BK9 1: ;$-<2'9
1C 2T,U%*-,-61S3$-45#6>!?789 1: ;$-<2(9
1D 2T,U%*-,-61S3$-45#6>E?789 1: ;$-<2(9
P4VV*%#<,&
(such as normal values for most of the examinations).
However, by analyzing the differences between
groups, we can find some possible interesting and dis-
criminating examinations. For example, we find that
ultra high (UH) values for the GPT test only appear
in the hepatitis B test set (more than 1% of the time),
but as the value lowers, the test stops being discrim-
inant. Another examples are patterns 9 and 10, that
may indicate that lower values on ALB and PLT tests
are good markers for not having hepatitis (note that,
in these data, not having information about a biopsy
does not say that a person do not have hepatitis, but
it may be an indicator for finding relations by which
doctors think there is no need for a biopsy. Neverthe-
less, it needs further analysis). Pattern 8 is marked
with an ∗ because, as can be noted, it has 4% of sup-
port for hepatitis B, and only 1% in group None, and
therefore it is considered non-discriminant. But, if we
look to patterns 12 and 13, very low (VL) values for
the CHE test may be an indicator of hepatitis B, mean-
ing that pattern 8 occurrences in the None group may
be outliers (or not yet diagnosed hepatitis B patients).
The only discriminant patterns that relate exam re-
sults and the fibrosis state can only find a relation for
fibrosis state 1 (patterns 13 to 15, in the table), be-
cause of the extremely low supports of other states of
fibrosis. And in fact, high (H) values for GPT and
GOT exams are not, by themselves, discriminant of
hepatitis C (patterns 4 and 6). At most, they may be
able to discriminate the fibrosis state in patients al-
ready diagnosed with hepatitis C.
5.3 Association Rules
Table 2 presents a subset of the frequent association
rules found of the form X ⇒ Fibrosis, with X any
other item.
Table 2: Some examples of the association rules found in
the hepatitis dataset.
!" #$%&' ()&* +),-./
0
1"2,34*56789:;<⟹<1=)>.$,),50; ?@'0AB A'CD E$
F
1"2,34*56G89:;<⟹<1=)>.$,),50; H0'IHB 0'AI E$
I
1J).*K+2-LM250CDA;<⟹<1=)>.$,),5A; 0C'CAB D'CF E$
?
1J).*K+2-LM250CDA;<⟹<1=)>.$,),50; DF'IFB 0'FH E$
H
1J).*K+2-LM250CIANO2P5=;<⟹<1=)>.$,),50; H0'FHB 0'AF Q2,<1#;
D
1J).*K+2-LM250CIANO2P5=;<⟹<1=)>.$,),5F; 0H'ARB A'CC Q2,<1#;
R
1J).*K+2-LM250CIANO2P5=;<⟹<1=)>.$,),5I; 0I'@0B A'CC Q2,<1#;
@
1J).*K+2-LM250CIANO2P5=;<⟹<1=)>.$,),5?; 0R'HRB A'C@ Q2,<1#;
In order to address the second goal, we wanted
to find all rules for which some examination result
implies some fibrosis state. Rules 1 and 2 are ex-
amples of those rules. However, and although their
confidence is around 50%, the lift is too close to 1,
which means that these rules are not unexpected and
are probably to tied to the data in question. Indeed,
both antecedents were non discriminant (as seen in
table 1), as well as these rules. All other rules of this
form are equivalent, and furthermore, can only esti-
mate the fibrosis state 1. This means that, using these
data, no examination result, by itself, can predict the
state of the fibrosis, in both type of hepatitis.
Rules 3 and 4 are examples of rules with higher
lift. They indicate that 20% of the patients that were
born in de 60s (i.e. that were examined with 20 to 40
years old) had hepatitis in fibrosis state 0, and 62% of
them in fibrosis state 1. Since these rules have higher
lifts, this may denote a relation between the age of the
patients with the state of the hepatitis.
Finally, rules 5 to 8 show that there are attributes
that, although being discriminative, they are not good
to predict the state of the fibrosis. In these examples,
women born in the 30s can predict any state, from 1
to 4, with smaller confidences (with the exception of
state 1, that is explained by the fact that there are more
instances of this type) and bad lifts.
In (Pizzi et al., 2005), the authors only generate
and analyze the confidence of association rules of the
form Examination Result → Fibrosis. However, be-
sides the confidence of those rules be low (in most
of the cases), neither the support or the lift of those
rules was analyzed. As shown here, rules of that form
with reasonable confidence (rules 1 and 2) have a lift
too close to 1 (and a very low support), which means
there are too few examples and these rules may not be
significant.
These poor results mean that there is the need for
further analysis of these data, in a different and more
structured way. They also prove that there are some
possible tendencies, but alone, examination results
cannot predict fibrosis state of hepatitis patients.
Multi-dimensionalPatternMining-ACaseStudyinHealthcare
279

6 CONCLUSIONS
In this work we presented a case study on the health-
care domain. Using the Hepatitis dataset, we showed
how these data can be modeled and explored in a
multi-dimensional model to promote decision sup-
port. We also discussed the use of a multi-dimen-
sional data mining algorithm to mine this model.
Results over the Hepatitis dataset show that it is
possible to mine these data and find interesting rela-
tions between dimensions. However,due to the nature
and distributions of these data, interesting patterns
found have very low support, and therefore, there is a
need to further analysis. Our analysis over the discov-
ered association rules concluded that the examination
results present in the hepatitis dataset, explored as de-
scribed, cannot predict the fibrosis state, mainly due
to the very low supports.
As future work, and in order to surpass the diffi-
culties of this dataset, other paths must be taken. One
of the problems comes from the lack of data and their
quality. The hepatitis dataset contains more than 30%
of patients that did not perform any biopsy (undiag-
nosed), and more than 75% of examinations for which
there is no information about an active biopsy. To
have a better understanding about why these patients
have not performed a biopsy requires domain knowl-
edge, and may help partitioning the data and improve
the results. In line with the above, this dataset con-
tains a very low number of instances for each type and
stage of hepatitis. There is the need for the integration
and analysis of more data in this domain.
The use of different approaches may also result
in better outcomes, such as infrequent pattern min-
ing (Zhou and Yau, 2007), for finding rare patterns; or
sequential and temporal pattern mining, for the anal-
ysis of the evolution of the disease.
An important step should also be the discovery of
structured patterns. Instead of considering one exam
at a time, we can, for example, aggregate the data per
pair (patient, biopsy), and using the same algorithm,
find frequent examination results that are common to
some type of hepatitis or that lead to some fibrosis
state. These structured patterns can also be used as
training data, in a further step, to improve classifica-
tion results, and therefore improve the prediction of
new hepatitis cases.
ACKNOWLEDGEMENTS
This work is partially supported by FCT – Fundac¸˜ao
para a Ciˆencia e a Tecnologia, under research
project D2PM (PTDC/EIA-EIA/110074/2009) and
PhD grant SFRH/BD/64108/2009.
REFERENCES
Crestana-Jensen, V. and Soparkar, N. (2000). Frequent
itemset counting across multiple tables. In Proc. of
the 4th Pacific-Asia Conf. on Knowl. Discovery and
Data Mining, pages 49–61, London. Springer.
Dehaspe, L. and Raedt, L. D. (1997). Mining association
rules in multiple relations. In ILP 97: Proc. of the 7th
Intern. Workshop on Inductive Logic Programming,
pages 125–132, London, UK. Springer.
Dˇzeroski, S. (2003). Multi-relational data mining: an intro-
duction. SIGKDD Explor. Newsl., 5(1):1–16.
Frawley, W. J., Piatetsky-Shapiro, G., and Matheus, C. J.
(1992). Knowledge discovery in databases: an
overview. AI Mag., 13(3):57–70.
Kaur, H. and Wasan, S. (2006). Empirical study on applica-
tions of data mining techniques in healthcare. Journal
of Computer Science, 2(2):194–200.
Koh, H. and Tan, G. (2005). Data mining applications in
healthcare. Journal of Healthcare Information Man-
agement, 19(2):64–71.
Ng, E. K. K., Fu, A. W.-C., and Wang, K. (2002). Mining
association rules from stars. In ICDM 02: Proc. of
the 2002 IEEE Intern. Conf. on Data Mining, pages
322–329, Japan. IEEE.
Pizzi, L., Ribeiro, M., and Vieira, M. (2005). Analysis
of hepatitis dataset using multirelational association
rules. In ECML/PKDD 2005 Discovery Challenge,
Porto, Portugal.
Silva, A. and Antunes, C. (2010). Pattern mining on stars
with fp-growth. In MDAI 10: Proc. of the 7th In-
tern. Conf. on Modeling Decisions for Artificial Intel-
ligence, pages 175–186, Perpignan, France. Springer.
Silva, A. and Antunes, C. (2012). Finding patterns in large
star schemas at the right aggregation level. In Proc. of
the 9th Intern. Conf. on Modeling Decisions for Arti-
ficial Intelligence, pages 329–340, Spain. Springer.
Srikant, R. (1996). Fast algorithms for mining association
rules and sequential patterns. PhD thesis, University
of Wisconsin, Madison. Supervisor-Jeffrey Naughton.
Watanabe, T., Susuki, E., Yokoi, H., and Takabayashi, K.
(2003). Application of prototypelines to chronic hep-
atitis data. In ECML/PKDD 2003 Discovery Chal-
lenge, Cavtat, Croatia.
Xu, L.-J. and Xie, K.-L. (2006). A novel algorithm for fre-
quent itemset mining in data warehouses. Journal of
Zhejiang University - Science A, 7(2):216–224.
Zhou, L. and Yau, S. (2007). Efficient association
rule mining among both frequent and infrequent
items. Computers and Mathematics with Applications,
54(6):737–749.
ICEIS2014-16thInternationalConferenceonEnterpriseInformationSystems
280
