
Pressure Sensor for Gastrointestinal Intraluminal Measuring
L. R. Silva, P. J. Sousa, L. M. Goncalves and G. Minas
Centro Algoritimi, University of Minho, Campus de Azurem 4800-058 Guimaraes, Portugal
Keywords: Pressure Sensor, Intraluminal Pressure, GI Disorders, Strain Gauges.
Abstract: This paper reports an innovative technique to measure intraluminal pressure in the gastrointestinal tract
(GI), which is typically performed through an exam called oesophageal manometry. This type of
measurement is performed with a catheter, comprising several pressure sensors along it, and gives important
information for the diagnosis of motility and peristalsis disorders in the GI tract. The presented work
explores the use of PDMS polymer (Polydimethylsiloxane) as the support material for the pressure sensors.
These PDMS layers are placed in the pressure measurements sites of the catheter. The presented work also
explores different materials for the metal strain gauges that act as the pressure sensors. Due to the
microfabrication techniques, the presented pressure sensors allow on-chip integration (with other
microsensors for GI diagnosis), and its pressure measurements will add essential diagnostic information, not
only for the GI motility and peristalsis disorders, but also in the early cancer detection. The initial
mechanical tests showed promising results for the intended application. After optimization of the fabrication
process, different experiments are scheduled for simulating the pressure signals that would occur in vivo
conditions. In summary this method will permit high integration and good sensitivity measurement, while
maintaining low fabrication costs.
1 INTRODUCTION
An oesophageal manometry provides crucial
information for the diagnosis of motility and
peristalsis disorders, such as diffuse esophageal
spasm or nutcracker esophagus, and typically
assesses the motor function of three main structures:
Upper Esophageal Sphincter (UES); esophageal
body; and Lower Esophageal Sphincter (LES)
(ASGE, 2012, AGA, 2005). The pressures typically
associated with this exam are in the range of
7-200 mmHg (Holloway, 2006). The manometry
equipment is composed by a catheter and several
pressure sensors along it (Murray et al., 2003). A
manometry exam can be classified accordingly to
the number of sensors that are employed:
conventional (4 to 8 sensors) and high resolution
manometry (20 to 36 sensors) (Kahrilas et al., 2008).
The high resolution exam has been gaining ground
in the last few years due to the higher spatial
resolution within the oesophageal lumen, which
enables to completely define the intraluminal
pressure profile (Kahrilas et al., 2008).
The pressure sensors are typically based on two
methods: water perfused and solid state sensors
(Bodger and Trudgill, 2006). The solid state ones
permit to downsize the sensor area (areas sensible to
pressure as low as 1 mm
2
), which is preferable for
high resolution systems (ASGE, 2012).
This paper reports an innovative technique to
measure the intraluminal pressure in the
gastrointestinal tract (GI) using the concept of
oesophageal manometry. The developed system
explores the use of PDMS polymer
(Polydimethylsiloxane) as the support material for
deposited metal strain gauges that serve as the
pressure sensors. In order to create pressure sensitive
regions in PDMS, one or four diaphragms (four for
intrasphincteric measurements due to asymmetric
pressure profiles) per measurement site will be
micromachined in the PDMS layers (Figure 1). An
external layer of PDMS is also required to isolate the
sensor from the organism.
The strain gauges are then distributed in these
diaphragm’s regions, where the elastic strain is
higher, thereby improving the measurements’
sensitivity. An external intraluminal pressure will act
in these diaphragms, thereby deforming the
deposited strain gauges, leading to a change of the
gauges’ electrical resistance, which directly relates
with the applied pressure.
200
R. Silva L., J. Sousa P., M. Goncalves L. and Minas G..
Pressure Sensor for Gastrointestinal Intraluminal Measuring.
DOI: 10.5220/0004901102000206
In Proceedings of the International Conference on Biomedical Electronics and Devices (BIODEVICES-2014), pages 200-206
ISBN: 978-989-758-013-0
Copyright
c
2014 SCITEPRESS (Science and Technology Publications, Lda.)
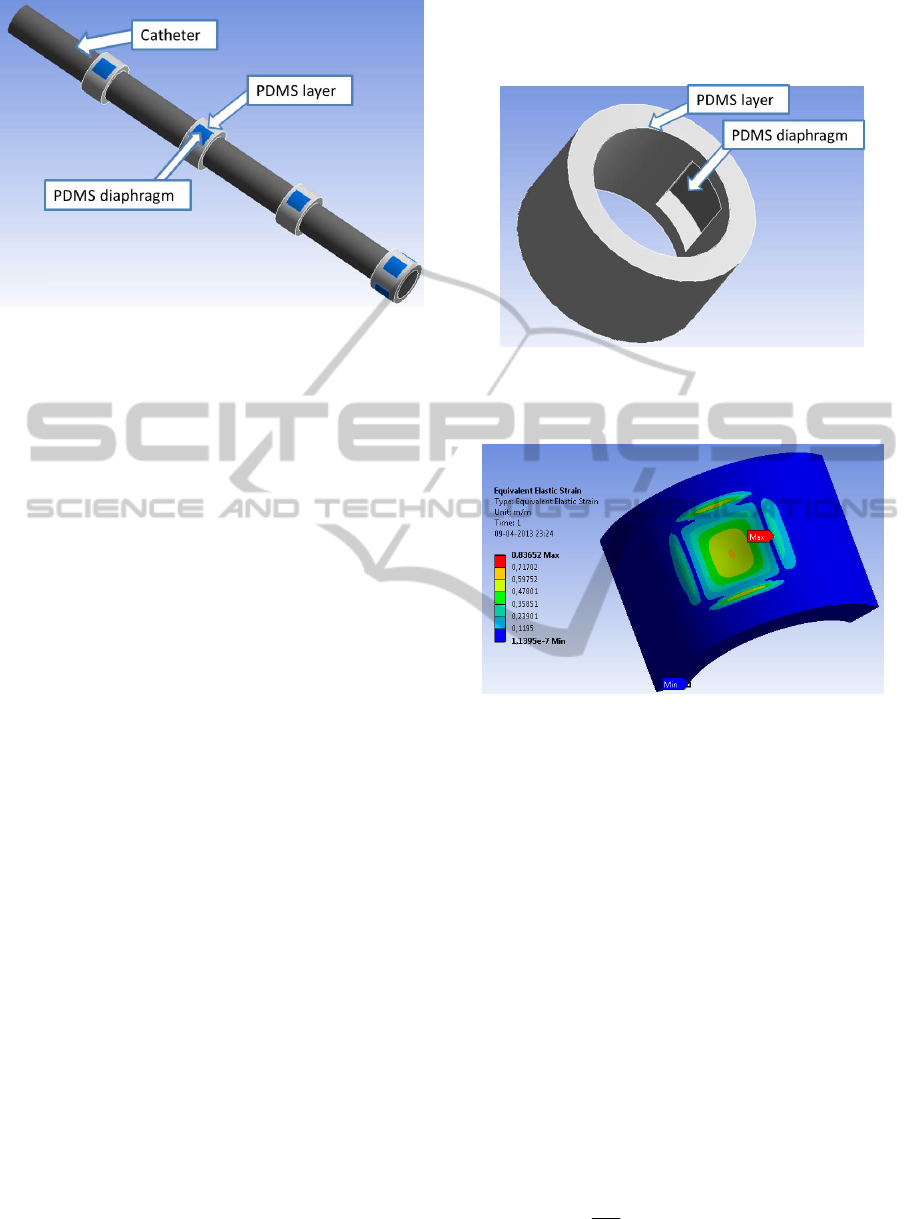
Figure 1: Catheter and the respective PDMS layers along
it (diaphragms are highlighted). At the tip, four
diaphragms are machined for intrasphincteric
measurements.
2 PROPOSED SYSTEM
2.1 Catheter
A regular circular catheter with a diameter between
2.7 and 4 mm is typically used for intra-oesophageal
pressure measurements. This catheter should be
flexible and can be made of different polymeric
materials, as polyvinyl chloride or silicone (ASGE,
2012). In the proposed system, a PDMS layer is
placed externally to the catheter, in the pressure
sensitive areas (Figure 1). The PDMS polymer was
chosen due to its bio-compatibility and resistance to
pH down to 2, which are required features for GI
applications (Cao, 2013). Additionally, PDMS is a
material with low cost, high flexibility and
compatible with micro-electronic mechanical
systems (MEMS).
The various diaphragms are presented in
Figure 1. These regions are the pressure sensitive
sites that will enable the pressure measurements.
These diaphragms (Figure 2) enable a greater
flection of the structure in response to exterior
pressures. Figure 3 shows the strain on a PDMS
layer, which has a central diaphragm (simulated in
ANSYS software). In this simulation, both the
bottom and side surfaces of the structure were
defined as fixed supports. A 110 mmHg pressure
signal was then applied perpendicularly to the
exterior surface. As it can be seen, the diaphragm
strain (i.e. the central area) is several orders of
magnitude greater than the one in the surrounding
area. Furthermore, the highest strain was in the
borders of the diaphragm and in its centre.
Therefore, the pressure sensors should be placed in
these areas of interest, which significantly increases
the pressure measurement sensitivity.
Figure 2: Representative section of the catheter with a
diaphragm machined in the structure (centre of the
structure).
Figure 3: Elastic strain distribution along the diaphragm
and surrounding structure for a 110 mmHg pressure signal
(simulated using ANSYS software).
2.2 Pressure Sensors
As the name suggests, a pressure sensor is capable
of converting a mechanical deformation caused by
an external load into an electrical signal
(Elwenspoek, 2001). In this work, metal strain
gauges, deposited in PDMS, are used as pressure
sensors. This gauge is deposited through lithography
processes which are explained in detail in section 3.
A strain gauge consists of a flexible backing
which supports a metallic foil pattern. This type of
sensor is based on electrical resistance changes.
Whenever a force is applied to this sensor, a
deformation is developed in the metal pattern which
in turn leads to a change of the strain gauge
electrical resistance (Elwenspoek, 2001). This
change is given by the following expression:
(1 2 )
dR
R
(1)
PressureSensorforGastrointestinalIntraluminalMeasuring
201
where υ is the Poisson’s ratio of the material and ε is
the mechanical deformation of the material.
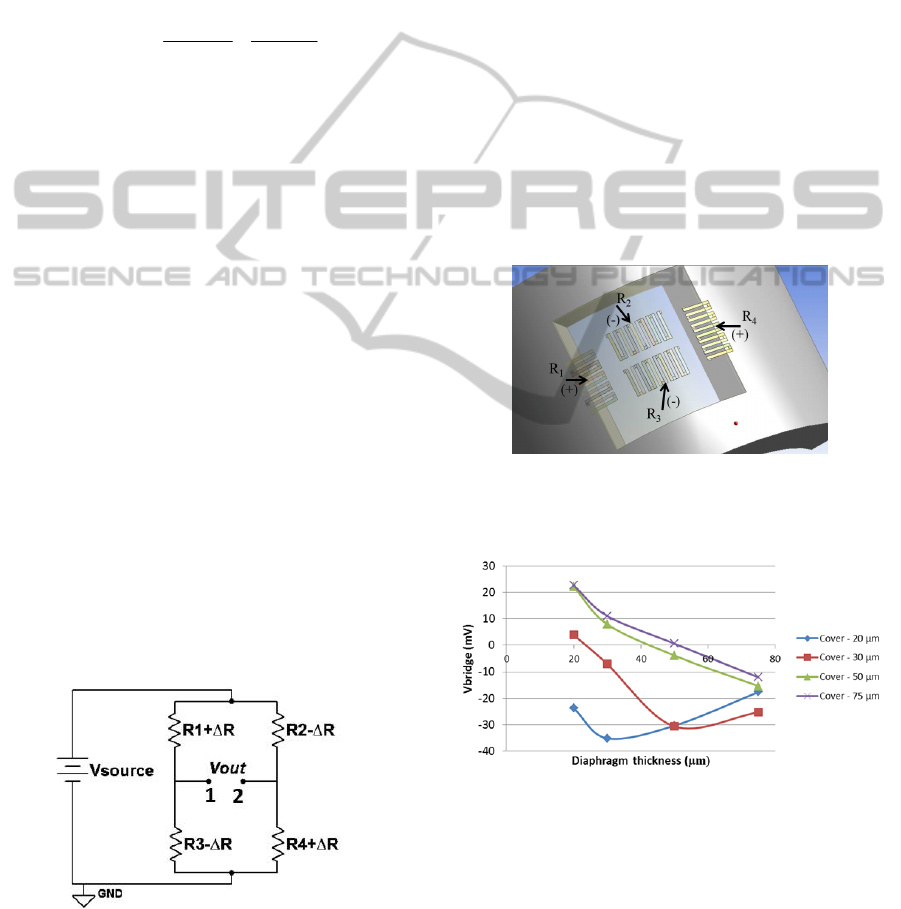
The resistance change is quantified using the
well-established Wheatstone bridge circuit (Figure
4), which converts the resistance change in an output
voltage proportional to this variation. The output
voltage is given by the combination of the electrical
resistances R1, R2, R3 and R4 that constitute the
fully active Wheatstone bridge which results in
(Elwenspoek, 2001):
R
R
R
R
R
R
VV
sourceout
13
3
24
4
(2)
Given the elastic strain distribution obtained in
Figure 3, the strain gauges should be placed in the
central region and in the borders of the diaphragm,
in such a way that the same pressure signal will
generate opposite variations on the resistance of
each pair of resistances (R
1
/R
4
and R
2
/R
3
). The strain
gauges final layout along the diaphragm is illustrated
in Figure 5. For example, in response to a pressure
signal, these strain gauges will either increase (R1
and R3) or decrease (R2 and R4) their resistance and
vice versa. By placing the resistances this way a
fully active bridge is ensured, which will result in a
higher value of V
OUT
(see equation (2)), i.e. a higher
output voltage of the Wheatstone bridge.
Furthermore, by placing the four resistances as close
as possible, undesirable changes of some
parameters, such as temperature, are almost
negligible, once all resistances will be subjected to
the same variations, cancelling each other out. These
resistors are then connected as presented in Figure 4.
Different materials, particularly Al (Aluminium) and
Au (Gold) are being study to act as the active
element of the pressure sensor. Important parameters
of the deposition process are being optimized, at this
stage, to ensure the best adhesion to PDMS.
Figure 4: Wheatstone bridge (fully active).
2.3 Encapsulation
An external PDMS layer is necessary to isolate the
strain gauges metal from the intraluminal medium.
Consequently, this layer will result in a reduction of
the measurement’s sensitivity. A numerical study,
through ANSYS, was done in order to optimize the
thickness of both this external layer and the
diaphragm. Figure 6 shows the theoretical electrical
signal output that results in response to the same
pressure signal for different thicknesses of both the
external PDMS layer (cover) and the diaphragm.
The inversion of the signal polarity is due to the
ratio between the thickness of the cover layer and
the thickness of the diaphragm.
As it can be seen, the highest sensitivities are
achieved with lower cover thicknesses and the best
result was obtained for a diaphragm’s and cover’s
thickness of 30 and 20 µm, respectively. These
values will serve as guideline for the fabrication
steps.
Figure 5: Strain gauges placement in the diaphragm
(ANSYS) (diaphragm is transparent for better
comprehension).
Figure 6: Voltage output of the Wheatstone bridge
according to the thickness of the diaphragm and the
PDMS cover layer, for Aluminium strain gauges (200 nm
thickness) and a pressure signal of 225 mmHg.
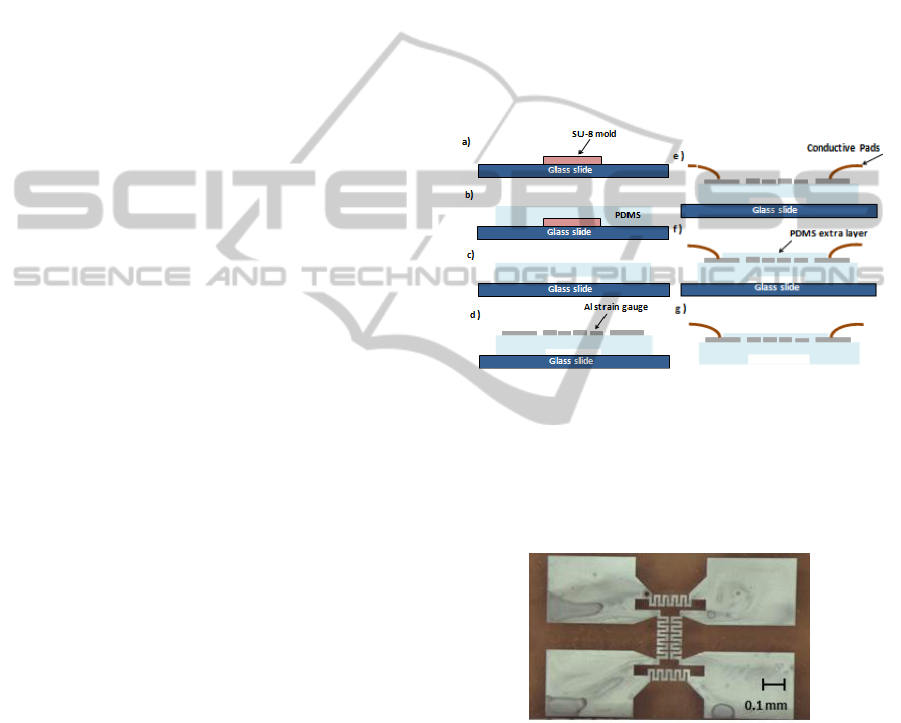
3 FABRICATION
The fabrication steps of the diaphragm structure and
its embedded strain gauges are described in Figure 7.
BIODEVICES2014-InternationalConferenceonBiomedicalElectronicsandDevices
202
The diaphragm on the PDMS structure is fabricated
using a SU-8 mold (height of 50 µm). The PDMS
pre-polymer is mixed in the ratio of 10:1
(base/curing agent) and subsequent degassed in a
vacuum desiccator in order to prevent bubble
formation in the mold material (due to incorporated
gas and crosslinking reaction by-products).
The PDMS is then deposited by spin coating
over the mold at 500 rpm in order to obtain a PDMS
50 µm thick film. After this step, it is cured in a hot
plate at a temperature of 85°C for a period of two
hours. Subsequently the PDMS structure that
contains the diaphragm is detached from the mold,
with the help of a scalpel, that cuts the area around
the patterned zone and it is placed over a glass slide.
Then, a metallic thin film is deposited onto the
PDMS to create the strain gauges. This film is
deposited by Physical Vapor Deposition (E-beam)
and patterned by standard photolithography. In this
process the positive photoresist AZ4562 is deposited
by spin coating at 6000 rpm for 20 seconds and
cured in a hot plate at 100°C for 10 minutes. After
this period the samples are left to cool for 10
minutes and, then, exposed to UV light with the
MaskAligner equipment. In order to accomplish this
process it is necessary to use the mask that contains
the micro features to be transferred and exposed
using the Soft Contact mode during 0.85 minutes.
Then, the photoresist developer is used to remove
the zones exposed to the UV light remaining only
over the metallic zones that were protected. This
removing process uses a solution that contains the
AZ351-B developer diluted in distilled water (4:1)
and a mixer to perform the photoresist development.
After 10 minutes developing it is cleaned with
distilled water and dried with a nitrogen flow.
With the previous steps successfully carried out,
it is necessary to perform the etch of the metallic
deposited films. For the aluminium etching a
recipient that contains an Al etch solution is used.
Next, it is visualized when all the non-protected
areas have been removed. The samples are then
removed, cleaned with IPA and dried with a nitrogen
flow. Other etchants can be used for other metals. In
the case of Gold, a Gold etch TFA can be used. To
finish the patterning of the metallic film it is
necessary to remove the photoresist that has been
used to protect the zones of interest. For that, a
solution of AZ100 is used during 15 minutes. The
structure is then cleaned with distilled water. An
example of the final structure obtained is presented
in Figure 8. In order to maintain the electric contact
from the strain gauges to the exterior, wires are then
attached to the conductive pads with silver
conductive paint. Finally, the external PDMS layer
(30 µm) is spun (800 rpm) onto the metal to cover
the sensors. Although the manufacturing process just
described has been successfully used, several
challenges must be overcome. First, it is necessary
to improve the adhesion between the metal film and
the surface of PDMS, which could be done with
chromium adhesion layers or plasma surface
treatment of PDMS prior to deposition.
Another problem is the presence of microcracks
that can appear due to the pressure and temperature
conditions involved in the deposition process. As
such, an optimization of the process or the metal of
choice is currently being carried out. The best results
at this stage were obtained for aluminium and gold.
Figure 7: Schematic representation of the fabrication
process of the strain gauges. a) SU-8 mold; b) pouring the
PDMS pre-polymer on the SU-8 mold and curing; c)
detaching the structure in PDMS and putting on a glass
slide; d) deposition and patterning the metallic film; e)
outer electrical contacts; f) covering the sensors with a
second layer of PDMS; g) separating the sensor.
Figure 8: Aluminium strain gauges embedded in PDMS.
4 READOUT SYSTEM
The final readout system can be seen in Figure 9. As
previously stated, a Wheatstone bridge is typically
used for strain gauge pressure measurements and
this case is no exception. Nevertheless, additional
components are required, so as to amplify the
resultant signal, which is of very low amplitude. The
signal is also filtered in order to reduce the high
PressureSensorforGastrointestinalIntraluminalMeasuring
203
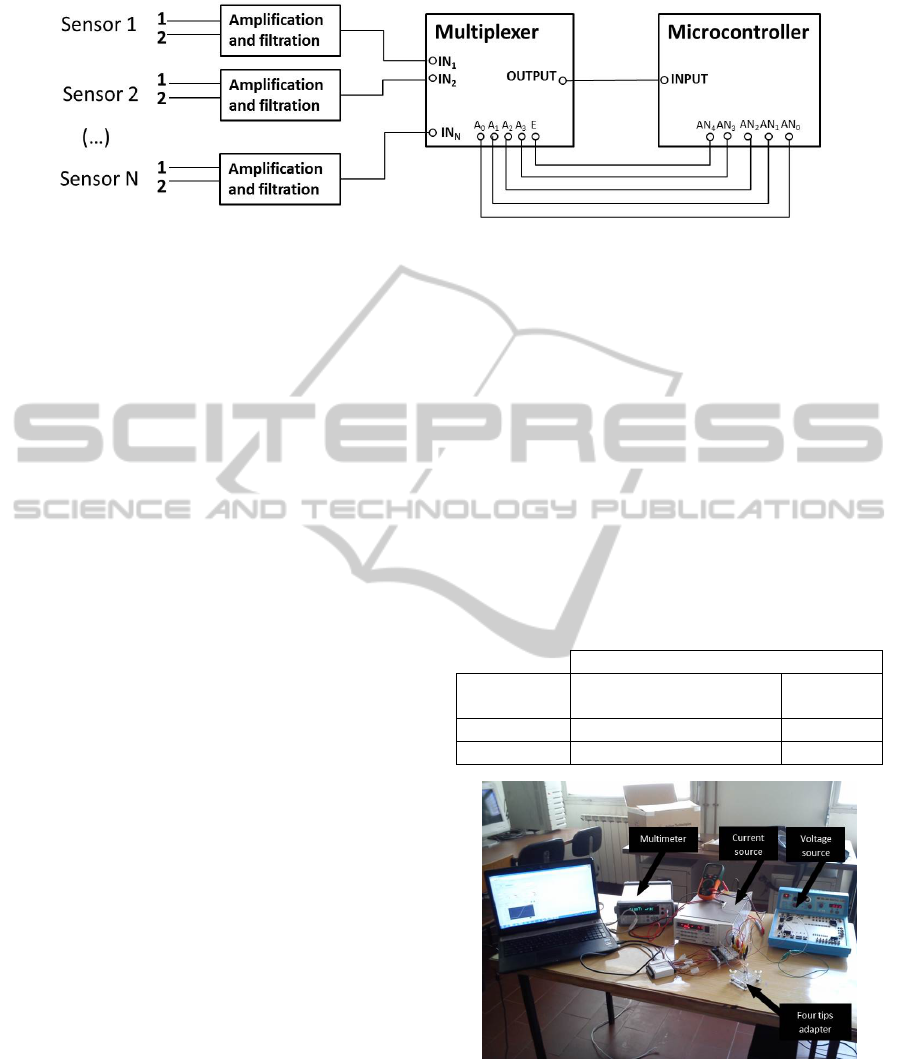
Figure 9: Different blocks that constitute the readout system and their connections. The sensors can be seen in Figure 4.
frequency noise signal and the power supply signal
(~50 Hz) that could overlap the signal of interest.
In addition, a multiplexer is used enabling a
sequential reading of the pressure sensors. The
addressing of the multiplexer channels (which
determines what sensor signal to read) as well as the
reading and commutation frequencies between
channels are defined through a microcontroller
(PIC32MX795F512L). The microcontroller’s
programming is carried out by MPLAB IDE.
Finally, the signal is acquired and converted to
digital to be presented in a computer through a user
friendly interface that is being developed with the
software Qt Creator.
5 EXPERIMENTAL RESULTS
5.1 Resistivity Measurement
As reported in section 3 various materials are in
study for being used as the strain gauge’s active
element. Two of these, more precisely, gold and
aluminium, were already deposited with proven
methodology. At this stage a resistivity measurement
was carried out based on the Van der Pauw method.
This method enables the resistivity measurement of
a material, regardless of its form, considering that
the test sample is approximately two-dimensional
(i.e. width much larger than the thickness).
In that method, four electrical contacts are set in
the different corners of the sample. An electric
current is then applied between two contacts and the
resulting voltage is measured in the other two.
Altogether eight separate measurements are
conducted so as to ensure a greater precision.
The experimental setup required for this test
includes a current source, a voltage source and a
multimeter with a four tips adapter (Figure 10). A
computer software then controls and varies the
applied current in all the four points (Figure 11) and
sets parameters such as: error margin; number of
readings; and film thickness for a correct calculation
of the resistivity.
As shown in Table 1, the obtained results for the
resistivity are dissimilar to the theoretical values
expected for gold and aluminium bulk films. This
was expected, since bulk material is typical a single
crystal structure, and thin-films are polycrystalline,
with much smaller crystal sizes, with many interface
regions. In addition, the deposition process doesn’t
guarantee a homogenous or free of cracks film, due
to PDMS substrate. For these reasons higher
resistivity values are expected. However, these
values are acceptable for the desired application.
Table 1: Theoretical and measured (mean value) resistivity
for aluminium and gold.
Resistivit
y
(nΩ/m)
Metal Theoretical (BYU,
1994)
Measure
d
Aluminiu
m
28.2 335±20
Gold 24.4 110±10
Figure 10: Experimental setup for the resistivity
measurements (including a multimeter, current and
voltage sources and a four tips adapter).
5.2 Mechanical Tension Test
At this stage mechanical extension tests were done.
BIODEVICES2014-InternationalConferenceonBiomedicalElectronicsandDevices
204
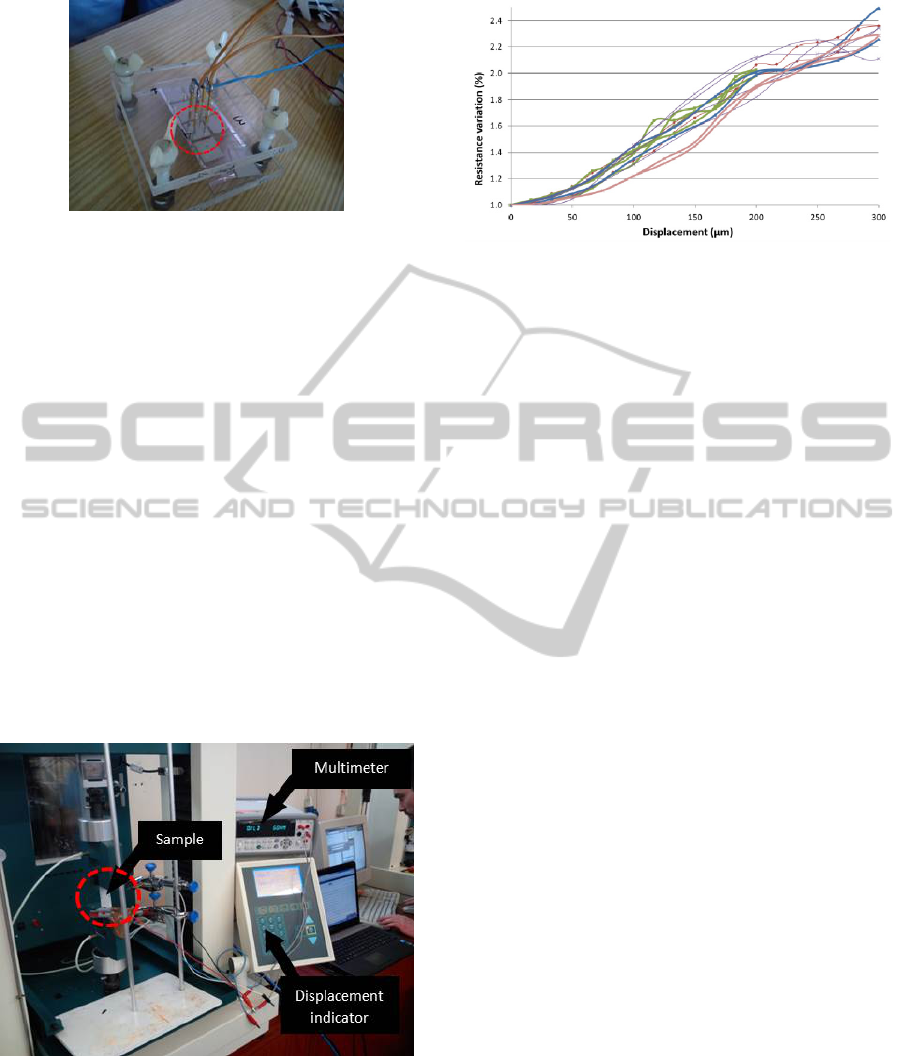
Figure 11: Four tips adapter.
Therefore, an experimental setup, shown in Figure
12, was used. The metallic film deposited in PDMS
is then attached to two clamps which are responsible
for the extension of the sample (PDMS/metal) in a
controlled manner (by the displacement indicator
seen in Figure 12). Simultaneously, the resistance of
the film is recorded in order to associate the
resistance change with the sample stretching. The
main purpose of this experiment was to verify if the
metallic film recovers its original resistance between
cycles of extension, which is required for this
application.
Figure 13 shows 6 distinct cycles of consecutive
extension and recovery for gold films (6 x 2 cm with
a thickness of 100 nm) in a 1 mm thick PDMS layer.
As it can be seen, for an extension of 300 µm, the
maximum resistance change was approximately
2.4 % of its initial value. Furthermore, the films
recovered their initial resistance value in the
recovery cycle as seen in the graph.
Figure 12: Experimental setup for the mechanical tests.
6 CONCLUSIONS
This paper relates to an innovative technique for
measuring the intraluminal pressure in the
Figure 13: Displacement versus resistance change for gold
films deposited in PDMS.
gastrointestinal tract (GI). A multiple sensor
approach is proposed, which is based in strain
gauges. The strain gauges are supported by a PDMS
layer, which guarantees a small sensitive area,
enabling a higher integration, while maintaining low
overall cost. At this stage the deposition process for
the strain gauges is being optimized. However, the
initial mechanical tests with gold show promising
results for the application intended. After this
optimization step, different experiments are
scheduled with the final geometry for the strain
gauges and adequate manometry equipment so as to
simulate the pressure signals that would occur in in
vivo conditions.
ACKNOWLEDGEMENTS
This work is funded by FEDER funds through the
"Eixo I do Programa Operacional Fatores de
Competitividade (POFC) QREN, project reference
COMPETE: FCOMP-01-0124-FEDER-020241, and
by FCT- Fundação para a Ciência e a Tecnologia,
project reference PTDC/EBB-EBI/120334/2010.
REFERENCES
AGA, 2005. Technical Review on the Clinical Use of
Esophageal Manometry. Gastroenterology, Volume
128, p. 209–224.
ASGE, 2012. Esophageal function testing - Report on
Emerging Technology. Gastrointestinal Endoscopy,
76(2).
Bodger, K. & Trudgill, N., 2006. Guidelines for
oesophageal manometry and pH monitoring. BSG
Guidelines in Gastroenterology.
BYU (Brigham Young University), 1994. Department of
Electrical & Computer Engineering. Available at:
http://www.cleanroom.byu.edu [February 2013].
PressureSensorforGastrointestinalIntraluminalMeasuring
205

Cao, W., 2013. Fabrication and modeling of stretchable
conductors for traumatic brain injury research.
Princeton.
Elwenspoek, M., 2001. Mechanical microsensors.
Londres: Springer.
Holloway, R. H., 2006. Esophageal manometry. GI
Motility online: Oral cavity, pharynx and esophagus.
Kahrilas, P. J., Ghosh, S. K. & Pandolfino, J. E., 2008.
Challenging the Limits of Esophageal Manometry.
Gastroenterology, Volume 134, pp. 16-18.
Murray, J. A., Clouse, R. E. & Conklin, J. L., 2003.
Components of the standard oesophageal manometry.
Neurogastroenterol. Motil., Volume 15, p. 591–606.
BIODEVICES2014-InternationalConferenceonBiomedicalElectronicsandDevices
206
