
SmartCoping
A Mobile Solution for Stress Recognition and Prevention
Edith Maier
1
, Ulrich Reimer
1
, Emanuele Laurenzi
1
, Monika Ridinger
2
and Tom Ulmer
3
1
Institute for Information & Process Management, University of Applied Sciences St. Gallen, St. Gallen, Switzerland
2
Department of Psychiatry, University of Regensburg, Regensburg, Germany
3
myVitali ag, Widnau, Switzerland
Keywords: Sensor-based Application, Stress Management, Relapse Prevention, Ambulatory Monitoring, Mobile
Health, Data Analysis, User Adaptation, Pattern Recognition.
Abstract: The paper describes the development of a mobile solution based on smartphones and sensors for the early
recognition of stress. The solution is based on real-time capture and analysis of vital data such as heart rate
variability as well as activity and contextual data such as location and time of day. Individual recognition
patterns for stress are derived from combining vital and contextual data by using subjective stress assess-
ments via mood maps as additional input during an initial learning phase. The reliability of stress alerts and
therapeutic impact will be tested in a clinic specialised on the treatment of alcoholics since stress tends to
cause craving and therefore trigger relapses.
1 INTRODUCTION
Stress is the body’s normal response to a real or
implied threat. In small doses, stress can help us
perform under pressure, make us stay focused, ener-
getic and alert. However, if stress symptoms persist,
it starts causing major damage to our health, produc-
tivity, relationships and quality of life. Chronic
stress can cause hypertension, suppress the immune
system, increase the risk of heart attack and stroke,
and make people more vulnerable to anxiety, addic-
tive behaviour and depression (e.g. Legendre and
Harris, 2006; Ornish, 1990). Excessive and pro-
longed stress may also cause burnout, which is a
state of emotional, mental and physical exhaustion.
We cannot completely eliminate stress from our
lives, but we can learn how to cope with it by con-
trolling stress-inducing situations and physiological
reactions. This, however, requires that we are aware
of the fact that we are stressed at a particular mo-
ment, by certain events or by encounters with specif-
ic persons. The timely recognition of stress is there-
fore a major goal of the SmartCoping project.
The app being developed facilitates the continu-
ous monitoring of a user’s stress level and gives a
warning when it exceeds a previously defined
threshold. The user can then either choose the exit
strategy by withdrawing from a stressful situation or
apply relaxation techniques derived from muscle
relaxation, meditation practice or mindfulness train-
ing. The effect of these exercises is visualised – and
thus reinforced – by means of biofeedback.
The SmartCoping app addresses two scenarios:
1. The Prevention of Chronic Stress: The target
group consists of individuals who are or feel
threatened by stress or aficionados of the Quanti-
fied Self movement who are interested in meas-
uring and documenting their vital as well as con-
textual data so as to increase their self-awareness
and long-term health (Swan, 2012).
2. Therapeutic and Rehabilitation Support for con-
ditions caused by Stress: Here the target group
are in- or outpatients or patients who continue to
need support after treatment in avoiding stress,
e.g. patients after alcohol detoxification, burn-out
patients, or patients suffering from depression. In
this scenario the therapist or nurse may have ac-
cess to the data if the patient agrees.
In the following section we briefly discuss the
challenges we face in this endeavour as well as the
innovative aspects of our project. Section 3 de-
scribes the mobile solution under development in-
cluding its technological implementation. Finally,
we outline the current state of the project and discuss
how we will measure its impact.
428
Maier E., Reimer U., Laurenzi E., Ridinger M. and Ulmer T..
SmartCoping - A Mobile Solution for Stress Recognition and Prevention.
DOI: 10.5220/0004903704280433
In Proceedings of the International Conference on Health Informatics (HEALTHINF-2014), pages 428-433
ISBN: 978-989-758-010-9
Copyright
c
2014 SCITEPRESS (Science and Technology Publications, Lda.)

2 CHALLENGES
AND INNOVATIVE ASPECTS
There is a plethora of health-related apps on the
market including apps for coping with stress, such as
the Stress Tracker from AboveStress Inc., one of the
most downloaded apps which also offers progressive
muscle relaxation and guided imagery exercises.
Another well-known example is the iStress app from
PsiApps Inc. which apart from stress warnings en-
courages the users to record their negative emotions
and thoughts. Whereas some apps try to determine
the individual stress level by asking a series of ques-
tions, the more innovative apps use the sensors inte-
grated in many of today’s smartphones as well as
external sensors to recognise and display stress
symptoms and monitor them over time. A very
interesting approach was pursued by the Mobile
Heart Health Project driven by Intel researchers.
They used a wireless ECG to detect changes in stress
levels as measured by heart rate variability (HRV)
and to trigger mobile therapies such as breathing
techniques (Morris and Guilak, 2009). So-called
“mood maps” adapted from clinical scales were used
for subjective assessment to correlate HRV meas-
urements with self-perception. In the end, the HRV
measurement was discontinued because of the chal-
lenges posed by the continuous capturing of sensor
data in everyday life and the focus shifted to the use
of mood maps.
Stress is also a topic in several large-scale pro-
jects funded by the EU, namely Interstress, Monar-
ca, Optimi and Psyche (for an overview see Riva et
al., 2011). These projects tend to have a mainly
therapeutic focus and aim at developing personal
health systems for people with mental problems or
disorders where stress plays a role. Some of the
projects capture contextual data such as physical
activity and location in a continuous way – as is the
case in SmartCoping. However, vital data such as
ECG are captured at certain pre-defined intervals
using stationary equipment, which makes stress
alerts triggered by stressful situations – a major goal
in the SmartCoping project – impossible.
For reliable stress alerts the display of stress
symptoms (such as HRV and accelerated heart rate)
alone does not suffice. For an app that warns its
users against imminent stress, much more complex
logic is required that goes well beyond the apps
currently available on the market
.
In short, SmartCoping will go beyond existing
stress apps by the following innovative features:
Interpreting vital data in context: It has been
shown (e.g. Clifford, 2007 or Ritter, 2009) that due
to artefacts it is very difficult to interpret vital data
gathered in real-life settings as opposed to laboratory
settings. This also applies to HRV, even when one
uses a chest strap, which yields more accurate meas-
urements than a bracelet or smart watch. For this
reason, we also take into account contextual infor-
mation such as location, activity and the user’s sub-
jective stress experience.
Automatic user adaptation: A major challenge is
posed by the fact that HRV stress measures vary
greatly between individuals depending on age,
health status and other factors. Therefore, each sub-
ject’s baseline and stress threshold has to be estab-
lished so the stress warnings can be adapted to each
individual.
Subjective stress assessment: Studies have
shown (e.g. Mandryk and Atkins, 2007) that stress
as experienced by a subject largely coincides with
normalised physiological measurements. This is why
in the adaptation/learning phase the user is prompted
to rate his or her own emotional state, so the system
can continually calibrate its threshold values in ac-
cordance with the user’s response.
Therapeutic effectiveness: Since the app is to be
used for therapeutic purposes evidence for its effica-
cy is required. The user testing in the final phase of
the project, which will be conducted in cooperation
with a clinic, is expected to provide the proof of
concept for our approach.
3 METHODOLOGICAL
APPROACH AND ITS
IMPLEMENTATION
In the following sub-sections we discuss the various
concepts, parameters, and models that form the un-
derpinning of SmartCoping.
3.1 Physiological Indicators for Stress
Heart rate variability (HRV) is considered a reliable
indicator for stress (e.g. Delaney and Brodie, 2000).
Increased stress reduces the fluctuation in beat-to-
beat intervals, whereas decreased stress increases
fluctuation.
For measuring HRV we require a wireless ECG
sensor, which operates continuously and provides a
high-quality ECG signal to capture the minute
changes in beat-to-beat intervals measured in milli-
seconds. At present, these requirements are only
fulfilled by chest straps. Whilst the wearing of a
chest strap may be perfectly acceptable for fitness or
SmartCoping-AMobileSolutionforStressRecognitionandPrevention
429
training purposes, bracelets or smart watches would
be much more convenient and unobtrusive for con-
tinuous measuring as needed for the SmartCoping
app. Currently, certain new devices are in the pipe-
line that are more comfortable to wear than a chest
strap, but still have an adequate degree of accuracy.
HRV is calculated based on the ECG signal from
an ECG sensor and transmitted via Bluetooth 4.0.
The sensor either transmits a signal for each heart
beat or provides the time between two heart beats.
Every minute, the app calculates the variations be-
tween two heart beats over a time-window of four
minutes. We use different algorithms for calculating
HRV, three time-based, one frequency-based:
‐ SDNN: standard deviation of RR intervals in the
current time frame;
‐ RMSSD: root mean square difference of succes-
sive RR intervals in the time frame;
‐ PNN50: percentage of pairs of adjacent RR in-
tervals differing by more than 50 ms in a time
frame (Bilchick and Berger, 2006);
‐ LF and HF: low and high frequency spectral
powers (Fagard et al. 1998);
‐ LF/HF: ratio between LF and HF, indicating the
balance between the sympathic and parasym-
pathic nervous system.
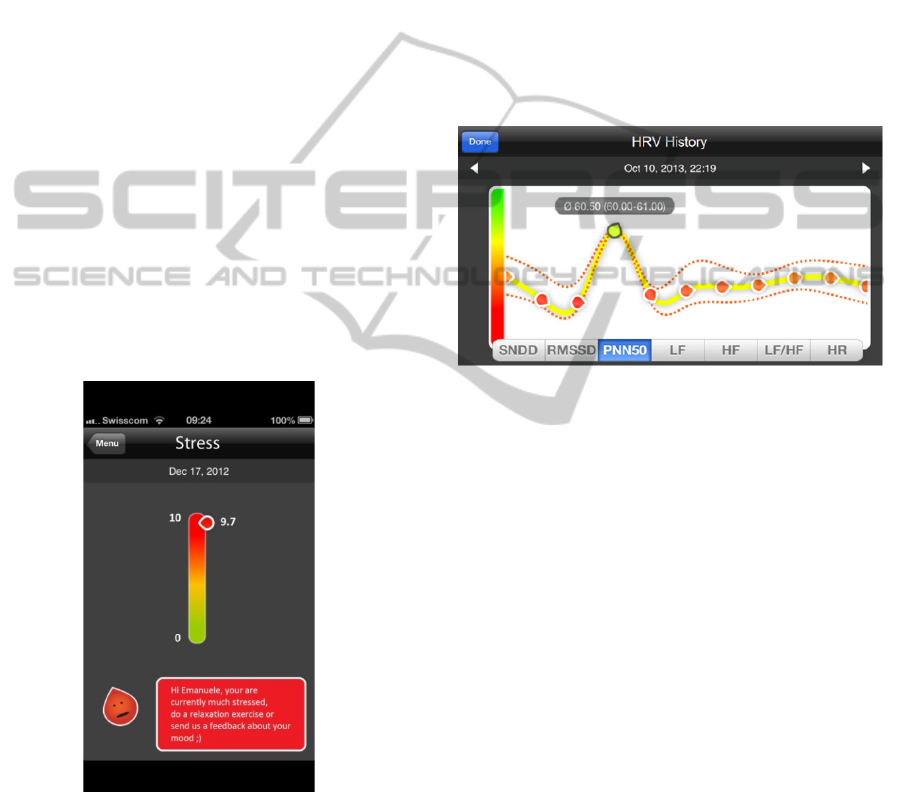
Figure 1: Current Visualisation of HRV values.
The HRV values obtained are aggregated to provide
an overall measurement of the stress level on a scale
from 0 to 10 (see Figure 1).
The current version of the app allows the inspec-
tion of the HRV values underlying the computed
stress level. Figure 2 gives an example of how the
HRV history is visualised, in this case for the metric
PNN50. At the bottom of the figure, all the HRV
metrics are listed. By selecting a metric the corre-
sponding history curve is displayed. The user can
also select individual “drops” that indicate the ag-
gregate measurements computed at pre-defined
intervals. They give information concerning the date
when the data were captured as well as average
(straight line), minimum and maximum values (dot-
ted lines) along the timeline. In Figure 2 the green
drop has been selected. By pinching in or out, the
user can change the granularity of time: single val-
ues, hourly, daily, weekly, monthly and yearly. Fi-
nally, the arrows in the upper left-hand and right-
hand corner allow scrolling to the left and right
along the time line, respectively.
Figure 2: HRV History.
The curve depicted in Figure 2 illustrates the effect
of a user’s sports activity on HRV. During the time
covered by the red drops that precede the green one,
the user had finished his work and had some physi-
cal exercise. Afterwards, relaxation set in so that the
HRV went up (the green drop). When returning to
work, the HRV dropped again.
3.2 Interpretation of Physiological
Data
Even with more sophisticated and accurate sensors,
measuring HRV will be affected by artefacts caused
by body movements. Therefore on the one hand we
have to integrate artefact detection and compensa-
tion into the app, on the other hand we cannot just
rely on HRV, but also include contextual infor-
mation. Together, vital and contextual data will
serve as the basis for recognising stress patterns that
are more reliable. At the moment, contextual data
comprise information about:
‐ Physical Activity measured by an accelerometer
integrated in the smartphone (or in the ECG sen-
sor),
‐ Location, which is measured by the GPS receiver
in people’s phones. The GPS coordinates, howev-
HEALTHINF2014-InternationalConferenceonHealthInformatics
430

er, are only useful when associated with locations
relevant to the individual users such as their house,
flat or work place. By assigning particular labels to
the relevant coordinates, these can be used in the
history view of stress warnings and help users
make sense of the data, e.g. to find out where
stress is particularly high.
‐ Change of Location: Moving from one location to
another may be an important indicator for stress
and will therefore be included in the recognition of
stress patterns.
‐ Time of Day: Exposure or experience of stress may
vary substantially during the course of day, which
is why it is also included as a variable in the
recognition patterns for stress.
There are other contextual data that might be rel-
evant such as people’s communication patterns, i.e.
incoming and outgoing calls, e-mails or text mes-
sages as logged on their smartphones or even a se-
mantic analysis of their content. However, these
cannot be taken into account for technical reasons,
e.g. they cannot be accessed under iOS, and they
would raise data protection and privacy issues.
3.3 Determining Individual
Recognition Patterns for Stress
As mentioned before, stress measures vary greatly
across individuals, which has been shown time and
again both in lab and real-life settings. According to
Morris and Guilak (2009), for instance, colleagues
of similar age, physical fitness, profession, and per-
sonality style differed dramatically in their HRV
baseline and threshold values. Therefore the
SmartCoping app includes an adaptive component to
identify the personal baseline and threshold values.
Combined with contextual information a learning
component determines user-specific stress patterns
(see Figure 3). To this end, the mobile phone app
queries the user during the learning phase at regular
intervals about his or her personal experience of
stress. Using this user feedback the system learns
recognition patterns for stress by employing a super-
vised learning approach.
A major challenge is posed by the very heteroge-
neous nature of the input data which include numer-
ic values for HRV and the number of steps, time
values for the time of day as well as nominal values
for both location and change of location. Besides,
we are dealing with time series data where the time
intervals to be examined are not defined a priori but
have to be determined by the learning algorithm. For
this purpose, we are using a special kind of neural
network (BINN) developed by our project partner
ai-one (Reimer at al., 2011), which has already been
successfully applied to learning recognition patterns
on time series data, e.g. for forecasting price devel-
opments on the stock exchange. The BINN is quite
different to existing neural nets:
‐ It is biologically inspired, i.e. consists of neurons
with dendrites to which the synapses from other
neurons are connected, and an axon which ends in
synapses on other neurons.
‐ Stimulation is via spikes, i.e. binary signals, which
either fire or do not.
‐ Connections between neurons get strengthened
when being traversed.
‐ Depending on the existence or absence of stimuli
neurons are created or destroyed and connections
reinforced or inhibited.
‐ In particular, there is no need for a predefined
topology or a similarity function.
The learning process happens primarily during
the initial phase of app usage and is gradually
phased out once the patterns cease to show any ma-
jor changes despite additional input. User response
regarding the subjective assessment of stress level is
prompted at previously defined intervals and when-
ever the app assumes the occurrence of stress based
on the patterns learned up to that point. Besides,
users are free to provide feedback any time, e.g.
when they feel particularly stressed or relaxed.
3.4 Biofeedback for Reducing Stress
Apart from the continuous recording of stress levels
and generating stress warnings, the SmartCoping
solution will also comprise a biofeedback compo-
nent to support users in emotional regulation aimed
at reducing stress. This component will guide the
user through relaxation exercises such as breathing
exercises, and at the same time visualise the stress
level based on HRV thus showing the immediate
impact of an exercise. The reinforcing effect of HRV
biofeedback has been well demonstrated in various
studies (e.g. Lehrer, 2013, or Sakakibara et al.,
2013).
3.5 Architecture
The SmartCoping system consists of sensors, the
app on the mobile phone and the backend (cp. Fig-
ure 3). The app calculates the HRV based on the
ECG signals from the sensor and transmits the HRV
measures, the aggregated stress levels as well as all
sensor and contextual data to the backend.
The data are stored at the backend and their history
can be displayed either via a web browser ( and
SmartCoping-AMobileSolutionforStressRecognitionandPrevention
431
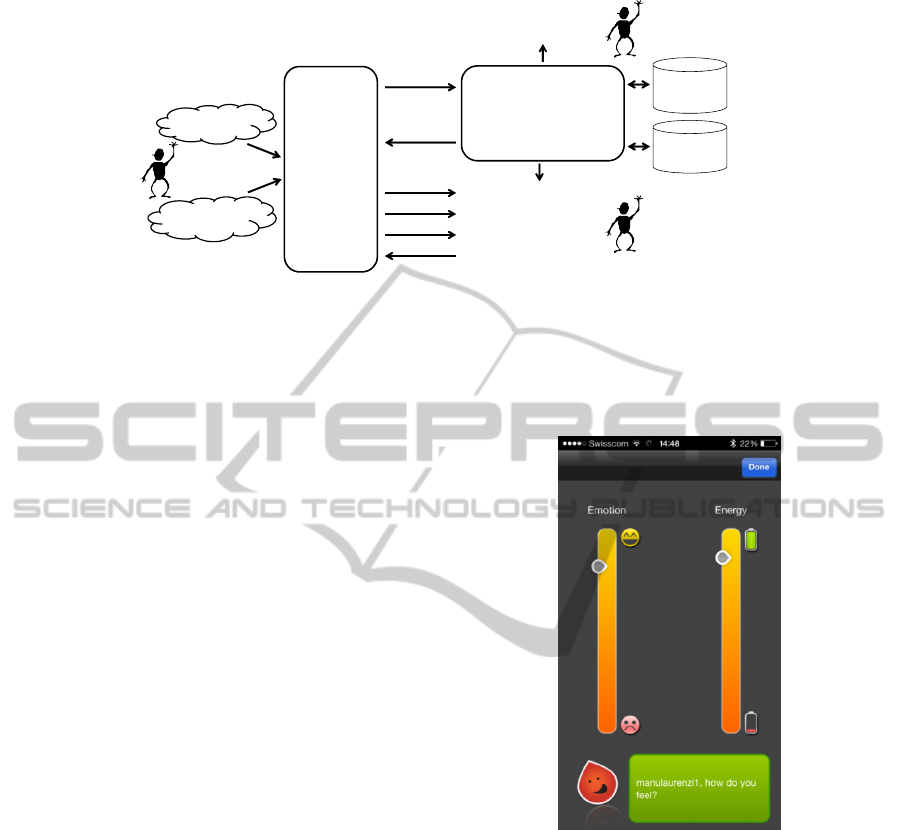
Figure 3: Data Flows and Architecture of SmartCoping.
viewed by a therapist or coach if the user agrees) or
via the display on the mobile phone. The learning
algorithm for recognising individual stress patterns
runs in the backend. The stress patterns are defined
as a (biologically inspired) neural network. The
neural network prompts the mobile phone to gener-
ate a stress alert if a stress pattern is recognised in
the input data. A simplified “light” version of the
neural network will be installed in the smartphone
app to allow a simpler, though less accurate stress
recognition process when there is no connection to
the backend.
4 PRELIMINARY RESULTS
AND NEXT STEPS
This paper discusses work in progress. Currently, the
learning algorithm is being implemented and differ-
ent versions of the mood map are being tested with
potential users.
Originally we considered using a similar mood
map as in the Mobile Heart Health project (Morris
and Guilak, 2009) that integrates the two dimensions
of valence (emotion) and arousal (energy) in one
matrix. However, a series of user tests showed that
some users found the matrix too complex and there-
fore had difficulty in finding the appropriate point
that corresponded to their mood.
As a result, we decided to split the two dimen-
sions into two separate columns “Emotion” and
“Energy”, which enables the user to focus on one
specific dimension at a time (see Figure 4).
Additionally, we might pre-define the character-
istics of certain activities, such as being absorbed in
non-physical work, strenuous physical work, sports
or non-active leisure time (e.g. reading, watching
movies) and present them as a menu to the user.
Those activities combined with the feedback about
the mood will allow the learning algorithm in the
backend to obtain a more adequate as well as a more
comprehensive assessment of the user’s stress levels
and thus enhance the recognition of stress patterns.
Figure 4: Mood Map.
Furthermore, we might prompt users for their sensa-
tions (e.g. visual, auditory, olfactory, affective) as
there is growing evidence that sensory impressions
can affect physiological stress reactions (Hasson et
al., 2013; Angelucci et al., 2013). To this end, we
might either offer a series of options from which
users can choose the most appropriate one or let
users define sensations relevant to them. Besides, as
a result of the feedback from some users whose
HRV measures have shown fluctuations for no obvi-
ous reason, we will look closely at the question of
time frames. Possibly, we will have to define differ-
ent time frames for different HRV metrics to achieve
a more reliable overall indication of stress.
For the time being, the app is tested only by
healthy individuals. Once we have integrated the
Coach
Therapist
Physician
User
Backend:
• learn recognition patterns
for stressfrom HRV,con‐
textdata,user feedback
• apply recognition patterns
to incoming sensor data
Context data
User
Smartphone
App
HRV
access to history
stresswarning
access to history
HRV,feedback,
context data
biofeedback
stresswarning,
history
Recognition
patterns
for stress
History
subjective stressfeedback
HEALTHINF2014-InternationalConferenceonHealthInformatics
432

feedback of the test users and solved the various
problems, the app will be validated in a field test
with high-risk subjects, namely detoxified alcohol-
ics. In stressful situations, they are overwhelmed by
the urge to drink (craving) as a neurobiologically
triggered stress reaction that is beyond their con-
scious control (Sinha, 2013).
The impact will be measured in terms of the per-
ceived stress of the test persons. This will be meas-
ured with the German version of the Perceived
Stress Questionnaire (PSQ), which has been shown
to be a valid and economical tool for stress research
(Fliege et al., 2005). Usability of the app and user
satisfaction will also be measured, especially pa-
tients’ judgements of the every-day practicability
and convenience of the system and its perceived
effectiveness with regard to the prevention of crav-
ing and thus relapse (Clarke et al., 2010).
ACKNOWLEDGEMENTS
The work reported in this paper is funded by the
Swiss Confederation's innovation promotion agency
(CTI) under grant number 14049.2 PFES-ES.
REFERENCES
Angelucci, F. L., Silva, V. V., Dal Pizzol, C., Spir, L. G.,
Praes, C. E., Maibach, H., 2013. Physiological effect
of olfactory stimuli inhalation in humans: an over-
view. Int J Cosmet Sci, Sep 30. doi:
10.1111/ics.12096.
Bilchick, K.C., Berger, R. D., 2006. Heart Rate Variabil-
ity. In J Cardiovasc Electrophysiol, vol. 17, no. 6, pp.
691-694.
Clarke, T. K., Dempster, E., Docherty, S. J., Desrivieres,
S., Lurdsamy, A., Wodarz, N., Ridinger, M., Maier,
W., Rietschel, M., Schumann, G., 2010. Multiple pol-
ymorphisms in genes of the adrenergic stress system
confer vulnerability to alcohol abuse. Addiction Biolo-
gy, no. 1, pp. 202–208.
Clifford, G., 2007. ECG Statistics, Noise, Artifacts, and
Missing Data. In Acharya, R. U., Suri, J. S., Spaan, J.
A. E., Krishnan, S.M. (eds). Advanced Methods and
Tools for ECG Data Analysis. Artech House, Boston.
Delaney, J. P. A., Brodie, D. A., 2000. Effects of Short-
Term Psychological Stress on the Time and Frequency
Domains of Heart-Rate Variability. Perceptual and
Motor Skills, no. 91, pp. 514–524.
Fagard, R. H., Pardaens, K., Staessen, J. A., Thijs, L.,
1998. Power spectral analysis of heart rate variability
by autoregressive modelling and fast Fourier trans-
form: A Comparative Study. Acta Cardiologica, vol.
53, no. 4, pp. 211–218.
Fliege, H., Rose, M., Arck, P., Walter, O. B., Kocalevent,
R. D., Weber, C., & Klapp, B. F., 2005. The Perceived
Stress Questionnaire (PSQ) reconsidered: validation
and reference values from different clinical and
healthy adult samples. Psychosomatic medicine, vol.
67, no. 1, pp. 78-88.
Hasson, D., Theorell, T., Bergquist, J., Canlon, B., 2013.
Acute stress induces hyperacusis in women with high
levels of emotional exhaustion. PLOS, vol. 8, no. 4,
doi: 10.1371.
Legendre, A., Harris, R., 2006. Exaggerated response to
mild stress in rats fed high-fat diet. American Journal
of Physiology - Regulatory, Integrative, and Compara-
tive Physiology, vol. 291 no. 5, pp. 1288-1294.
Lehrer, P., 2013. How Does Heart Rate Variability Bio-
feedback Work? Resonance, the Baroreflex, and Other
Mechanisms. Biofeedback, vol. 41, no. 1, pp. 26–31.
Mandryk, R., Atkins, M. 2007. A fuzzy physiological
approach for continuously modelling emotion during
interaction with play environments. International
Journal of Human-Computer Studies, vol. 6, no. 4, pp.
329–347.
Morris, M., Guilak, F., 2009. Mobile heart health: Project
highlight. IEEE Pervasive Computing, vol. 8, no. 2,
pp. 57–61.
Ornish, D., Brown, S., Scherwitz, L., Billings, J., Arm-
strong, W., Ports, T., McLanahan, S., Kirkeeide, R.,
Brand, R., Gould K., 1990. Can lifestyle changes re-
verse coronary heart disease?. Lancet vol. 336, no.
8708, pp. 129–133.
Reimer, U., Maier, E., Streit, S., Diggelmann, T.,
Hoffleisch, M., 2011. Learning a Lightweight Ontolo-
gy for Semantic Retrieval in Patient-Centered Infor-
mation Systems. International Journal of Knowledge
Management, vol.
7, no. 3, pp. 11–26.
Ritter, W., 2009. Measuring Psychophysiological Signals
in Every-Day Situations. In Proceedings of HCI Inter-
national.
Riva, G., Baños, R., Botella, C., Gaggioli, A., Wiederhold,
B. K., 2011. Personal Health Systems for Mental
Health: The European Projects. In Westwood, J. D.,
Westwood, S. W., Felländer-Tsai, L., Haluck, R. S.,
Hoffman, H. M., Robb, R. A., Senger, S., Vosburgh,
K. G. (eds), Medicine Meets Virtual Reality. IOS
Press.
Sakakibara, M., Hayano, J., Oikawa, L., Katsamanis, M.,
Lehrer, P., 2013. Heart Rate Variability Biofeedback
Improves Cardiorespiratory Resting Function During
Sleep. Applied Psychophysiology and Biofeedback, pp.
1–7.
Sinha, R., 2013. The clinical neurobiology of drug crav-
ing. Curr Opin Neurobiol, vol. 23, no. 4, pp. 649–654.
Swan, M., 2012. Health 2050: The realization of personal-
ized medicine through crowdsourcing, the Quantified
Self, and the participatory biocitizen. Journal of Per-
sonalized Medicine, vol. 2, no. 3, pp. 93–118.
SmartCoping-AMobileSolutionforStressRecognitionandPrevention
433
