
SYNC-SOM
Double-layer Oscillatory Network for Cluster Analysis
A. V. Novikov and E. N. Benderskaya
Department of Computer Systems and Software Technologies, St.-Petersburg State Polytechnical University,
Polytechnicheskaya, St.-Petersburg, Russia
Keywords: Cluster Analysis, Kuramoto Model, Self-organized Feature Map, Oscillatory Network.
Abstract: Despite partial synchronization in the oscillatory networks based on Kuramoto model can be used for cluster
analysis, convergence rate of synchronization processes depends on number of oscillators and number of
links between oscillators. Moreover result of clustering depends on radius of connectivity that should be
chosen in line with input data. We propose double-layer oscillatory network for the two problems. Our net-
work relevant in situation when fast solution is required and when input data should be clustering without
expert estimations. In this paper, we presented results of experiments that confirmed better quality then tra-
ditional algorithms.
1 INTRODUCTION
Recent researches have suggested that synchroniza-
tion among neurons in the brain is used to imple-
ment the cognitive functions, for example, vision,
motion, memory (Haken, 2007). The oscillatory
networks provide biologically plausible and parallel
methods of modeling cognitive functions. The syn-
chronization processes in oscillatory networks have
been applied to various problems such as image
segmentation, cluster analysis, sound and image
recognition (Basar, 1998); (Cumin et al., 2006);
(Benderskaya et al., 2009).
The Kuramoto equation is one of the successful
models of synchronization among phases of oscilla-
tors (Kuramoto, 1984). However, convergence of
synchronization processes depends on number of
oscillators and degree of connectivity between oscil-
lators in networks that are based on Kuramoto mod-
el. For example, clusters may be elongate and placed
close to each other, in this case radius of connectivi-
ty (determines oscillators that should be connected)
should be chosen exactly before starting algorithm
of clustering. Improper radius will cause a false
allocation of clusters. Obviously, that a small radius
is the cause of small number of connections between
the oscillators in the network and as a result it is
cause of low level of convergence rate.
In this paper, we proposed a double-layer oscilla-
tory network SYNC-SOM that ensure faster conver-
gence rate without any estimation such as radius of
connectivity. The input layer is based on self-
organized feature map (SOM) that encodes input
features and the output layer based on oscillatory
network that uses Kuramoto model (Sync) performs
cluster analysis.
2 PRELIMINARIES
2.1 Self-organized Feature Map
Self-organized feature map is special class of artifi-
cial neural networks that are based on unsupervised
competitive learning (Kohonen, 2001). Each neuron
competes for its activation. Self-organization algo-
rithm is divided into three steps: competition, coop-
eration and adaptation.
Competition process finds the best vector w that
represents the weight with the smaller distance to the
input vector x (Haykin, 1999):
arg min .
j
j
i xxw
(1)
The neuron-winner determines the spatial location of
the topological neighborhood – cooperation process:
2
,
2
exp .
2
ji
ji
ht
n
x
rr
(2)
305
Novikov A. and Benderskaya E..
SYNC-SOM - Double-layer Oscillatory Network for Cluster Analysis.
DOI: 10.5220/0004906703050309
In Proceedings of the 3rd International Conference on Pattern Recognition Applications and Methods (ICPRAM-2014), pages 305-309
ISBN: 978-989-758-018-5
Copyright
c
2014 SCITEPRESS (Science and Technology Publications, Lda.)
Parameter σ is effective width that affects the num-
ber of neurons that will be involved in the adaptation
process, and r
i
denotes the location of neuron i on
the map grid. Synaptic adaptation is the last step that
allows excited neurons (that are located in topologi-
cal neighborhood) to adjust its weight. In other
words excited neurons move closer to the input
vector:
1.
jj j
tttt ww xw
(3)
2.2 Kuramoto Model
Kuramoto model is able to ensure various type of
synchronization in networks with various structures
(Acebron et al., 2005); (Arenas et al, 2008). Dynam-
ic of the model described by following equation
(Kuramoto, 1984):
1
sin .
N
ii ji
j
K
N
(4)
Phase of oscillator θ
i
is basic state variable that dis-
poses in the range from 0 to 2π. Frequency ω
i
can be
considered as offset parameter. Coupling strength K
affects the rate and the type of synchronization. High
value of coupling strength ensures global synchroni-
zation and low value of coupling strength ensures
local synchronization or desynchronization.
The degree of synchronization between oscilla-
tors can be evaluated by estimate r that helps to
define state of synchronization (Kuramoto, 1984):
11
11
,
j
NN
i
j
i
jj
re
N
Ne
.
(5)
The state of global synchronization occurs when r
→ 1, global de-synchronization occurs when r → 0.
Partial synchronization occurs in case:
1
c
rKK
.
(6)
The degree of partial synchronization depends on
value of critical coupling strength K
c
that is depends
on the width of the frequency distribution of oscilla-
tor: K
c
= 2γ.
An important feature of the Kuramoto model is
possibility to provide synchronization processes in
networks with various communication structures.
We performed experimental study using numerical
simulations and found that states of global and par-
tial synchronization can be successfully sets in the
oscillatory networks with communication structures
such as grids, stars, bidirectional list and unidirec-
tional circular list.
2.3 Oscillatory Networks based on
Kuramoto Model
Oscillatory networks are nonlinear dynamic systems
where neuron (unit) is oscillating element that is
called an oscillator. The dynamic of the oscillatory
network is characterized by the type of synchroniza-
tion: global, local (partial) and desynchronization.
Local synchronization can be interpreted as a case of
clustering where each ensemble synchronous oscilla-
tors corresponds to one cluster.
The adapted model for oscillatory network that is
intended for cluster analysis (Miyano et al., 2007);
(Bohm et al., 2010):
sin .
i
iji
jN
i
K
N
(7)
Each oscillator corresponds to only one input vector
from data set and coordinates of oscillator equals to
coordinates of corresponding object. Parameter N(θ
i
)
defines number of neighboring oscillators for oscil-
lator i. The set of oscillator neighbors depends on
connectivity radius ϵ that should be chosen in line
with input data.
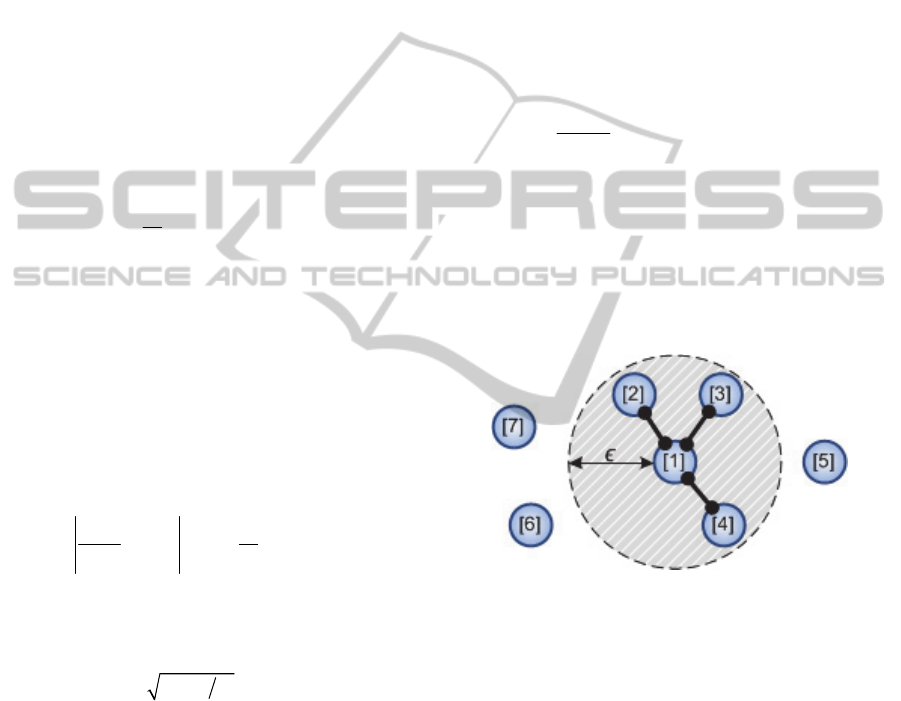
Figure 1: Illustration of how connections are established
for oscillator in line with radius ϵ.
The connection is established between oscillators
if Euclidian distance (it can be other metric) between
less than connectivity radius ϵ.
We have investigated possibilities of the network
for cluster analysis using the widespread data set
FCPS (Ultsch, 2005). Experiments have shown
problems with elongate or with non-uniform density
clusters that are located closely next to each other,
for example, samples EngyTime, TwoDiamonds and
WingNut. It can be hard to choose right radius con-
nectivity or even impossible.
Moreover convergence rate of synchronization
processes depends on number of oscillators in net-
work based on Kuramoto model. For example, the
oscillatory network with grid structure has quadratic
dependence O(n
2
) and network with unidirectional
ICPRAM2014-InternationalConferenceonPatternRecognitionApplicationsandMethods
306
list structure has cubic dependence O(n
3
). Therefore
solution of data clustering may have cubic complexi-
ty in worst case.
3 THE SYNC-SOM NETWORK
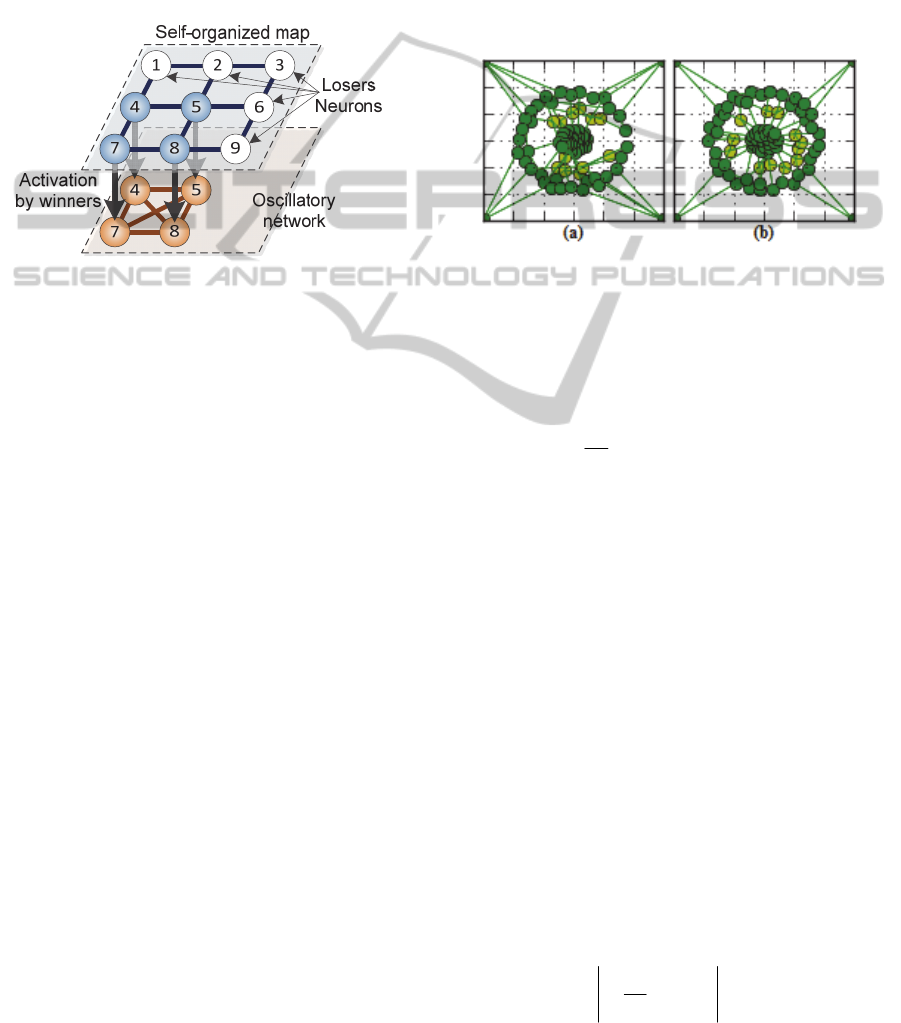
The proposed network SYNC-SOM consists of the
input and the output layers. The architecture of the
network presented on the figure 1.
Figure 2: The architecture of the SYNC-SOM oscillatory
network. The input layer encodes features from input data
set and the output layer performs clustering.
The input layer based on self-organized feature
map that reduces high dimensional input space to a
lower dimensional map space. Final state of input
layer defines number of active oscillators in the
output layer that usually equals to number of neu-
rons-winners. The input layer contains several prin-
ciple differences from conventional self-organized
map that will be described further.
Initial values of weights are initialized by ran-
dom values in the conventional algorithm and it has
a high influence on learning process (self-
organization process). In this case a neuron-winner
is random and spatial location of the topological
neighborhood that is defined each step of learning
becomes random too. And as a result it is the imme-
diate cause of maps with different topologies at the
end of learning process with the same data set.
Moreover, random initialization is cause of the for-
mation of areas in which high and low concentration
of neurons can occurs. Therefore some clusters can-
not be allocated properly by the second layer. It is
especially significant shortcoming for the sample
TwoDiamonds.
We propose to perform initialization of weights
by “uniform grid” in line with input data set. The
“uniform grid” represent rectangular grid that covers
input data in first two dimensions and distance be-
tween the nodes is the same in each of the two di-
mensions of data. Further the “uniform grid” should
be aligned with the center in other dimensions of
data. Thus coordinates of nodes of the “uniform
grid” define initial weights of neurons.
Our approach for the initialization ensures stable
results of learning process and prevents formation of
areas that are crowded by neurons, whereas in other
areas there is a lack of them. Example of difference
of formed featured maps is presented on figure 3.
Also we offer to abandon using of permutations of
objects of input data set during training on each step
as this reduces complexity of learning process, be-
cause complexity of the permutation is O(n!).
Figure 3: Difference of formed feature maps in cases (a)
the random and (b) the “uniform grid” initialization of
weights for the sample “Target”.
The output layer of SYNC-SOM is based on the
oscillatory network whose dynamics described by
the following model:
sin
i
iji
jN
i
K
N
.
(8)
Number of oscillators N is defined by number of
winner-neurons in the input layer. Each neuron-
winner corresponds to only one oscillator and coor-
dinates of neurons from the input layer corresponds
to coordinates of oscillators in the output layer. The
proposed architecture ensures faster solution than
basic oscillatory neural networks based on Kuramo-
to model because the output layer uses significantly
fewer oscillators due to using neurons-winners of the
input layer instead of objects of an input data.
Connections between oscillators are formed if
Euclidean distance between them is less than aver-
age distance between approximately no more than
ten percent of the total number neurons-winners in
input layer. Additionally, U-matrix P-matrix (Ultsch,
2005), information about active and dead neurons
(losers) from the first layer can be used for forming
more accurate structure of the output layer.
Evaluation of the end of the process clustering r
c
is described as follows (Novikov et al., 2013):
1
1
ji
i
N
c
ijN
i
re
N
.
(9)
SYNC-SOM-Double-layerOscillatoryNetworkforClusterAnalysis
307
Ending process synchronization (clustering) is indi-
cated when r
c
→ 1. Oscillators whose phases are
approximately equal to each other belong to the
same cluster with high probability, in other words
each ensemble of synchronous oscillators corre-
sponds to one cluster of data.
4 EXPERIMENTAL RESULTS
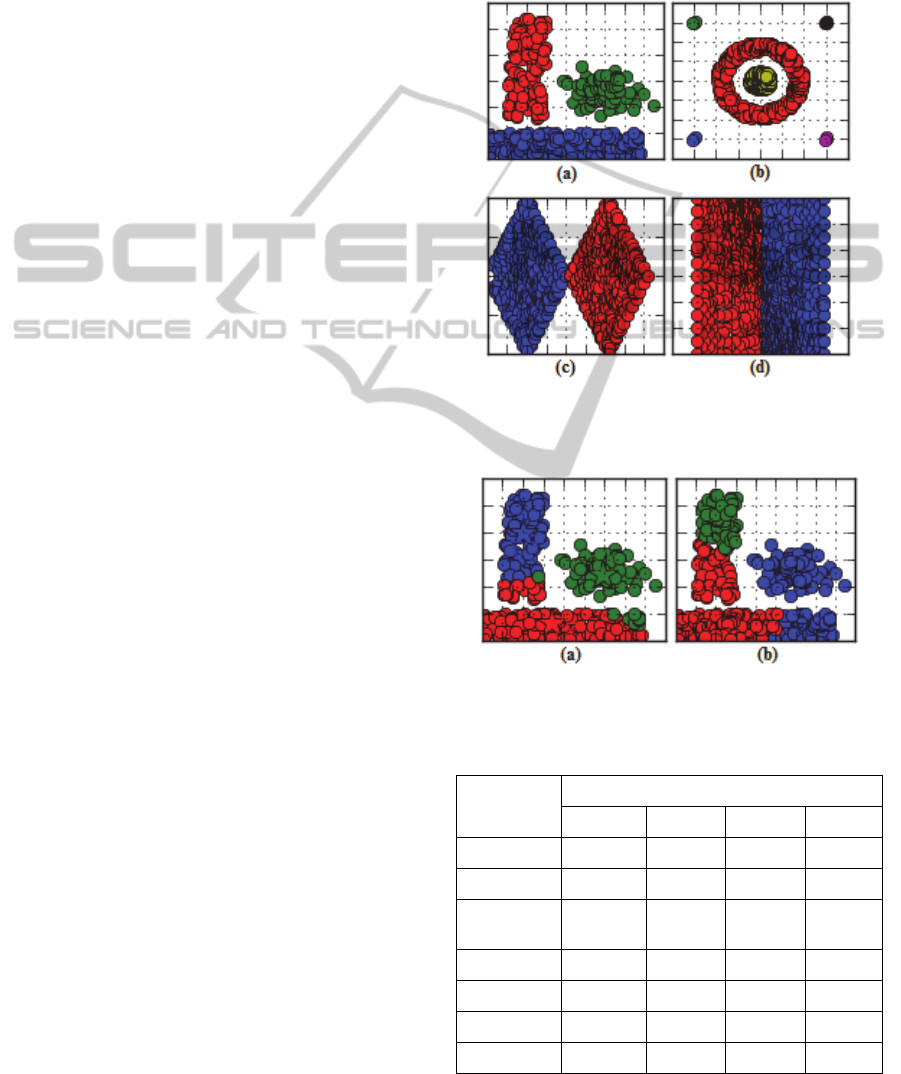
To illustrate how SYNC-SOM is used for cluster
analysis, we have performed study using data set
FCPS. Comparison has been performed with algo-
rithms such as K-Means (MacQueen, 1967), ROCK
(Guha et al., 2000), Hierarchical (Anil et al., 1988),
Sync (Bohm et al., 2010) and DBSCAN (Ester et al.,
1996). All experiments have been performed on a
workstation with Intel Core i5-2300 CPU 2.8 GHz
and 4.0 GB RAM.
We can confirm that the oscillatory network
SYNC-SOM is able to ensure accurate results of
clustering for all samples from the FCSP data set.
We have used 100 neurons in the input layer and
coupling strength K in the output was used equal to
1. Several SYNC-SOM results of clustering are
presented on figure 4. It’s important to note that
clusters can be allocated not only by final state of
the output layer. Sometimes global synchronization
can be reached and only one cluster can be allocated
in this case. Analysis of dynamics of the output layer
should be performed by dendogram that shows hier-
archical organization of clusters where uniting time
of clusters is main feature to determine the actual
number of clusters (Wang el al., 2009).
K-Means is not able to allocate clusters properly
from samples Lsun, Target, WingNut and several
others sample where clusters don not have Gaussian
or spherical distribution. Hierarchical algorithm has
problems with clustering Lsun, Target, Chainlink
due to using only minimization of the distance be-
tween objects, i.e. has troubles with elongated clus-
ters that are close to each other. Illustration that
shows shortcomings of K-means and Hierarchical
algorithm is presented on figure 5.
DBSCAN, Sync and ROCK algorithms success-
fully allocate clusters for all samples. DBSCAN
requires finely tuned parameters (number of trusted
neighbors and connectivity radius), especially, it’s
hard to find properly parameters for successful clus-
tering samples TwoDiamonds and WingNut, and
small parameter changes can lead to incorrect re-
sults. But obvious DBSCAN advantage is high per-
formance. Sync and ROCK are parameterized by
connectivity radius too, but they are more robust.
The Sync is robust due to possibility to allocate
clusters by the mentioned before dendogram in case
of global synchronization. And ROCK is robust due
to depth analysis of structures. However, they solve
the problem slowly compared with other considered
algorithms. Table 1 demonstrates comparison of rate
solving between the algorithms.
Figure 4: SYNC-SOM results of clustering. (a) Three
clusters for Lsun. (b) Six clusters for Target. (c) Two
clusters for TwoDiamonds. (d) Two clusters for WingNut.
Figure 5: Illustration of shortcomings. (a) K-means. (b)
Hierarchical.
Table 1: Execution time of various algorithms.
Sample
Algorithm (Execution time)
syncsom sync dbscan rock
Lsun 6.12 26.6 0.37 24.0
Target 12.8 74.3 1.78 174
Two
Diamonds
14.8 299 1.43 194
WingNut 21.1 423 2.30 397
Chainlink 21.7 72.0 2.96 383
Hepta 2.58 0.87 0.12 3.65
Tetra 5.70 127 0.39 24.5
ICPRAM2014-InternationalConferenceonPatternRecognitionApplicationsandMethods
308

The SYNC-SOM is much faster than Sync and
ROCK algorithms. Sync can be faster than SYNC-
SOM only for very small input data sets, for exam-
ple, the sample Hepta, because our algorithm spends
some time for encoding features.
5 CONCLUSIONS
In this paper we have proposed novel oscillatory
network SYNC-SOM for cluster analysis that is
based on Kuramoto model and on SOM. We have
investigated problems with convergence rate in the
conventional oscillatory network based on Kuramoto
model and problems with learning processes in
SOM. We have performed comparison with various
algorithms such as K-Means, DBSCAN, ROCK,
Sync and Hierarchical. Our experimental results
have confirmed ability of SYNC-SOM to perform
fast successful clustering.
REFERENCES
Acebron, J. A., Bonilla, L. L., Vicente, C. J. P., Ritort, F.,
and Spigler, R. (2005). The Kuramoto model: A sim-
ple paradigm for synchronization phenomena. Reviews
of modern physics, 77, 137–185.
Anil, K., Dubes, J. C., Dubes, R. C. (1988). Algorithms for
Clustering Data. Prentice Hall, Englewood Cliffs,
New Jersey.
Arenas, A., Diaz-Guilera, A., Kurths, Y. Moreno, Y.
Zhou, C. (2008). Synchronization in complex net-
works. Physics Reports, 469, 93–153.
Basar, E., (1998). Brain function and oscillations. Spring-
er-Varlag, New York.
Benderskaya, E. N., Zhukova, S. V. (2009). Large-
Dimension Image Clustering by Means of Fragmen-
tary Synchronization in Chaotic Systems. Pattern
Recognition and Image Analysis, vol. 10, no. 2, 306-
316.
Bohm, C., Plant, C., Shao, J., Yang, Q. (2010). Clustering
by synchronization. KDD ’10 Proceeding of the 16th
ACM SIGKDD international conference of Knowledge
discovery and data mining, 583-592.
Costa, J. A. F., Hujun, Y. (2010). Gradient-based SOM
Clustering and Visualisation Methods. In Proc. of the
2010 International Joint Conference on Neural Net-
works.
Cumin, D., Unsworth, C. P. (2006). Generalizing the
Kuramoto Model for the Study of Neuronal Synchro-
nisation in the Brain. Report University of Auckland
School of Engineering, 638.
Ester, M., Kriegel, H., Sander, J., Xu, Xiaowei, X. (1996).
A density-based algorithm for discovering clusters in
large spatial databases with noise. Proc. of the 2
th
Int.
Conf. on Knowledge Discovery and Data Mining, 226-
231.
Guha, S., Rastogi, R., Shim, K. (2000). ROCK: A Robust
Clustering Algorithm for Categorical Attributes. In
Proc. of the 15
th
Int. Conf. on Data Engineering.
Haken, H., (2007). Brain Dynamics, Springer-Verlag,
Berlin Neidelberg.
Haykin, S. (1999). Neural networks: A comprehensive
foundation. Macmillan College Publishing Company,
New York, 2
nd
edition.
Kohonen, T. (2001). Self-Organizing Maps. 3
nd
edition,
Berlin: Springer.
Kuramoto, Y. (1984). Chemical Oscillations, Waves, and
Turbulence. Berlin: Springer.
MacQueen, J. B. (1967). Some Methods for Classification
and Analysis of Multivariate Observations. Proc. Fifth
Berkley Symp. Math. Statistics and Probability, vol. 1,
281-297.
Miyano, T., Tsutsui, T. (2007). Data Synchronization as a
Method of Data Mining. International Symposium on
Nonlinear Theory and its Applications.
Novikov, A.V., Benderskaya E.N. (2013). The Oscillatory
Neural Networks Based on Kuramoto Model for Clus-
ter Analysis. The 11th International Conference "Pat-
tern Recognition and Image Analysis: New Infor-
mation Technologies" (PRIA-11-2013), vol. 1, 106-
109.
Ultsch, A. (2005). Clustering with SOM: U*C. Proceed-
ings Workshop on Self Organizing Feature Maps. Par-
is, France. 31-37.
Wang, X., Jiao, L Wu. J. (2009). Extracting hierarchical
organization of complex networks by dynamics to-
wards synchronization. Physica A, 388, 2975-2986.
SYNC-SOM-Double-layerOscillatoryNetworkforClusterAnalysis
309
