
Data Mining Models to Predict Patient’s Readmission in Intensive
Care Units
Pedro Braga
1
, Filipe Portela
2
, Manuel Filipe Santos
2
and Fernando Rua
3
1
Information System Department, University of Minho, Guimarães, Portugal
2
Algoritmi Research Centre, University of Minho, Guimarães, Portugal,
3
Serviço de Cuidados Intensivos, Centro Hospitalar do Porto, Porto, Portugal
Keywords: Readmission, Intensive Care, INTcare, Decision Support in Intensive Care Medicine, Data Mining, SWIFT.
Abstract: Decision making is one of the most critical activities in Intensive Care Units (ICU). Moreover, it is
extremely difficult for health professionals to interpret in real time all the available data. In order to improve
the decision process, classification models have been developed to predict patient’s readmission in ICU.
Knowing the probability of readmission in advance will allow for a more efficient planning of discharge.
Consequently, the use of these models results in a lower rates of readmission and a cost reduction, usually
associated with premature discharges and unplanned readmissions. In this work was followed a numerical
index, called Stability and Workload Index for Transfer (SWIFT). The data used to induce the classification
models are from ICU of Centro Hospitalar do Porto, Portugal. The results obtained so far, in terms of
accuracy, were very satisfactory (98.91%). Those results were achieved through the use of Naïve Bayes
technique. The models will allow health professionals to have a better perception on patient’s future
condition in the moment of the hospital discharge. Therefore it will be possible to know the probability of a
patient being readmitted into the ICU.
1 INTRODUCTION
Ensuring that in a given situation are taken the better
decisions, remains a huge challenge for science and
technology. Thus, the Information Technology (IT)
has been playing a crucial role in the adoption of
measures and optimization of processes in
organizations. The field of medicine is no exception,
and the needs for rapid development and the use of
IT as a response to various problems is increasing.
As an example, there is intensive medicine, where
critically ill patients need special care for their
survival. The readmission of patients in Intensive
Care Units (ICU) is currently one of the major
problems and challenges of health professionals in
the field of intensive care medicine, because it can
be danger to the patient and spend extra resources.
Since the ICU readmissions are common and costly,
there is a need to investigate the application of new
techniques to reduce unplanned readmission of
patients into the ICU, because the currently existing
techniques do not provide satisfactory results
(Gortzis, Sakellaropoulos, Ilias, Stamoulis, and
Dimopoulou, 2008).
This study aims to demonstrate that by using data
mining (DM) techniques it was possible to
determine the probability of patient’s readmission in
order to assist health professionals in their decision
process.
This article is structured in the following way:
Introduction which is presented a brief introduction
about the environment and the foundations of the
work to develop. Background: where is presented
the problem and some theoretical fundaments:
Intensive Medicine, Readmissions, INTCare and the
Stability and Index for Load Transfer. Study
Description: describes the process of project
development. Discussion of Results: are discussed
and interpret the results obtained. Conclusions:
where are presented the most important conclusions
of the work. Future Work: presents
recommendations for future work.
604
Braga P., Portela F., Filipe Santos M. and Rua F..
Data Mining Models to Predict Patient’s Readmission in Intensive Care Units.
DOI: 10.5220/0004907806040610
In Proceedings of the 6th International Conference on Agents and Artificial Intelligence (ICAART-2014), pages 604-610
ISBN: 978-989-758-015-4
Copyright
c
2014 SCITEPRESS (Science and Technology Publications, Lda.)

2 BACKGROUND
2.1 Intensive Medicine
Intensive Medicine (IM) is a medical specialty
whose main goals are to diagnose and treat patients
with serious illnesses and restore them to their
previous state of health. IM can still be set up as a
“Multidisciplinary field of medical science that
specifically addresses three stages: prevention,
diagnosis and treatment of patients with potentially
reversible pathophysiological conditions that
threaten or present failure of one or more vital
functions” (Silva, 2007). Associated with IM comes
the Intensive Care Units (ICU). ICUs are
characterized as qualified locals to assume full
responsibility for patients with organ dysfunction,
supporting, preventing and reversing failure of vital
organs (Ministério da Saúde, 2003). Intensivist is a
health professional with critical care training that
works in the ICU.
2.2 ICU Readmission
An unplanned readmission of patients is directly
related to a bad decision by the intensivist at the
time of patient assessment (discharge). However, the
ability to predict relapse of a patient after the
discharge from the ICU is limited (Gajic, et al.,
2008). In order to understand how it is processed the
readmission of a patient it is important first to realize
how it is processed an admission. The admission
into UCI is, by definition, "a time of transition for
some patients whose life is at risk and it is part of a
process and not an end in itself" (Ministério da
Saúde, 2003). It is considered admission when the
patient admitted to the health facility occupies a bed
or couch for a minimum of 24 hours (ACSS, 2012).
A patient is considered readmitted if he/she is
hospitalized at the same hospital with the same
principal diagnosis within thirty days after discharge
(ACSS, 2012). According to literature review, in
North America and Europe, the average rate of
readmission of patients in ICUs is around 7%. A
study conducted by the Royal Melbourne Hospital in
Australia showed that the rate of readmission of
patients was 10.5%. The main factors can be
respiratory and cardiac problems, the progression of
the patient's condition, care needs post-operative,
and inadequate follow-up care (Russell, 1999). A
study conducted in England by SSentif Intelligence
(Intelligence, 2013), showed that on average 16% of
patients above 75 years of age suffer readmission 28
days after discharge, although this figure varies
significantly across the country, in the West South
England has an average of 12.98% and the city of
London register a value of 17.06%
2.3 Stability and Workload Index for
Transfer
It is extremely difficult for the health professionals
to interpret almost instantly all the data available. In
fact, at the time of admission or discharge of the
patient the criteria employed by the health
professional are often subjective and are not likely to
be reproduced in other cases. Many of these
professionals are often forced to rely on their
intuition and subjective analysis to assess the clinical
status of the patient and thus determine whether the
patient is ready for discharge or not (Gajic, et al.,
2008).
Published data shows that there are models or
mathematical techniques that help predict
readmission of patients in the ICU. As an example,
according to Gajic (2008), there is a study to
develop and validate a numerical index called
Stability and Workload Index for Transfer (SWIFT)
(Gajic, et al., 2008). The considered variables to be
used in SWIFT in order to estimate the probability
of unplanned readmission were: length of stay in the
ICU (duration in days), the source of the patient's
admission, the Glasgow coma scale (GCS), the
partial pressure of oxygen in arterial blood [PaO2] /
and the fraction of inspired oxygen [FIO2] and
evaluation of nursing care for respiratory problems
[PCO2].
The final score is derived from a set of
information available at the time of hospital
discharge estimating the probability of the patient in
the ICU using as support the scores presented in
Table 1.
SWIFT is according to some experts from ICU
of Centro Hospitalar do Porto (CHP) the most
popular readmission technique currently used in
Portuguese hospitals. Therefore this predictive
model was the basis of the current study using DM
techniques.
2.4 INTCare
This study is being developed under the research
project called INTCare. INTCare is an Intelligent
Decision Support System (IDSS) for Intensive Care
Medicine, and is implemented in ICU of the
Hospital de Santo António, CHP. The main
objective was to change the responsiveness of
reactive response to proactive, thus enabling
DataMiningModelstoPredictPatient'sReadmissioninIntensiveCareUnits
605
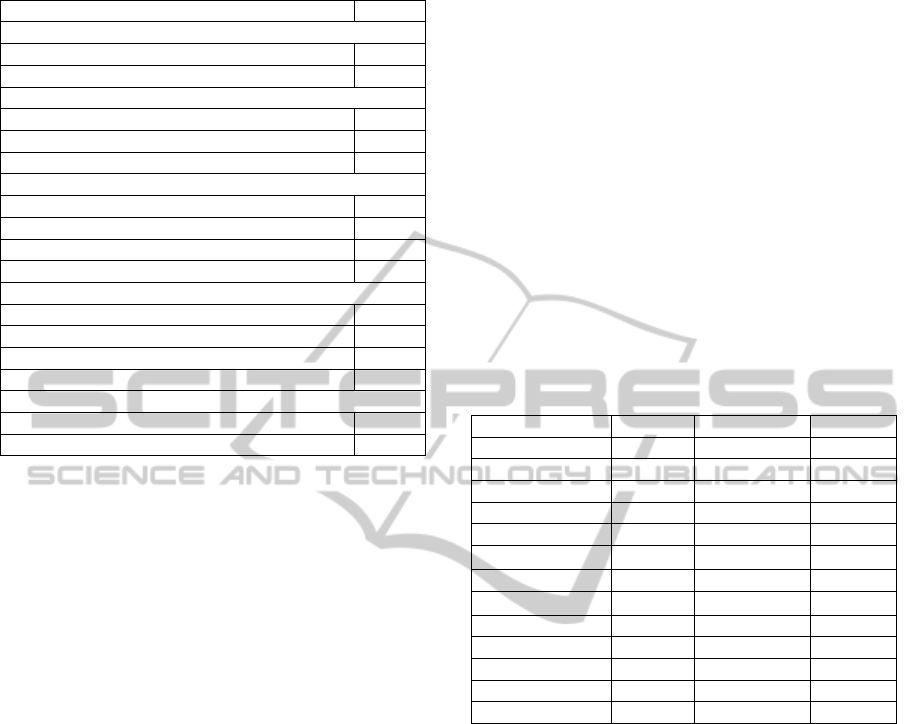
Table 1: SWIFT Variables and scores.
Variables Score
Original source of this ICU admission
Emergency department. 0
Transfer from a ward or outside hospital 8
Total ICU length of stay (duration in days)
<2 0
2-10 1
>10 14
Last measured PaO2/FIO2 ratio
>400 0
<400 and ≥150 5
<150 and ≥100 10
<100 13
Glasgow Coma Scale at time of ICU discharge
>14 0
11-14 6
8-10 14
<8 24
Last arterial blood gas PaCO2
<45 mm Hg 0
>45 mm Hg 5
physicians to ensure an improvement in the
treatment of their patients (Portela, et al., 2012). The
system uses a set of variables to try to predict the
patient's condition through intelligent autonomous
agents that are responsible for the fulfilment of
objectives, which include the use of data mining to
predict organ failure and the outcome of a patient in
the next 24 hours. Currently this approach (predict
readmissions) is part of one of the goals of INTCare
II project recently approved by the Foundation for
Science and Technology. INTCare System consists
of four subsystems within which stand the system of
data acquisition, the knowledge management,
inference and the interface. For more information
about the structure of INTCare it is possible to check
on the following article (Portela, Pinto, & Santos,
2012).
3 STUDY DESCRIPTION
3.1 Methods and Tools
For this study it was used the purpose of forecasting
through a set of classification models. For the work
were used Oracle SQL Developer for data treatment,
R for data analysis and the Oracle Data Miner
(ODM) to build prediction models (Taft, et al.,
2003). Due the type of techniques available in ODM
it was used: Support Vector Machines (SVM),
Decision Trees (DT) and Naïve Bayes (NB).
3.2 Business and Data Understanding
The Business goal of this study is decreasing the
readmissions number through the use of Data
Mining. The Data Mining objective is developing
models which allow determine the probability of
patient readmission. These models act as a support
to health professionals in decision-making and
improving the patient's health services. To this study
it was used real data provided from CHP databases.
Although the data acquisition subsystem incorporate
five different data sources (Portela, Pinto, & Santos,
2012), the attributes used were collected in real time
from only two different sources: Laboratory (LAB)
and Clinical Process (CP) – Electronic Health
Record (EHR). Table 2 presents the attributes, type,
domain and source of the information available.
Table 2: Attributes overview.
Attributes Type Domain Source
episode number - LAB/CP
nprocess number - LAB/CP
nsample varchar - LAB
daten date - CP
sex varchar [M;F] CP
po2 number
[0;
+∞ [
LAB
fio2 number [0;100] LAB
Pco2 number
[0;
+∞ [
LAB
emergencyroom varchar [True;False] CP
input date date - CP
output date date - CP
validation pco2 date - LAB
validation po2 date - LAB
To this work it was evaluated a set of episodes
with admission and discharges in the ICU, since
December 20, 2010 to April 23, 2013. The attribute
Glasgow coma scale (GCS) was not considered in
this study because it is an attribute registered
manually and consequently, countless null values
were found.
3.3 Data Preparation
At this stage it was conducted an Extract
Transforming and Loading (ETL) process, the
number of times needed until they present quality. In
this phase one of the main goal is to build new data
from the existing data. The following derivations of
new attributes were made in the dataset and can be
seen in Figure 1.
The scores come from assigning values
according to the score table SWIFT. Observing
Table 1, and ignoring the GCS, variables in the
analysis are: emergency room, length of stay,
ICAART2014-InternationalConferenceonAgentsandArtificialIntelligence
606
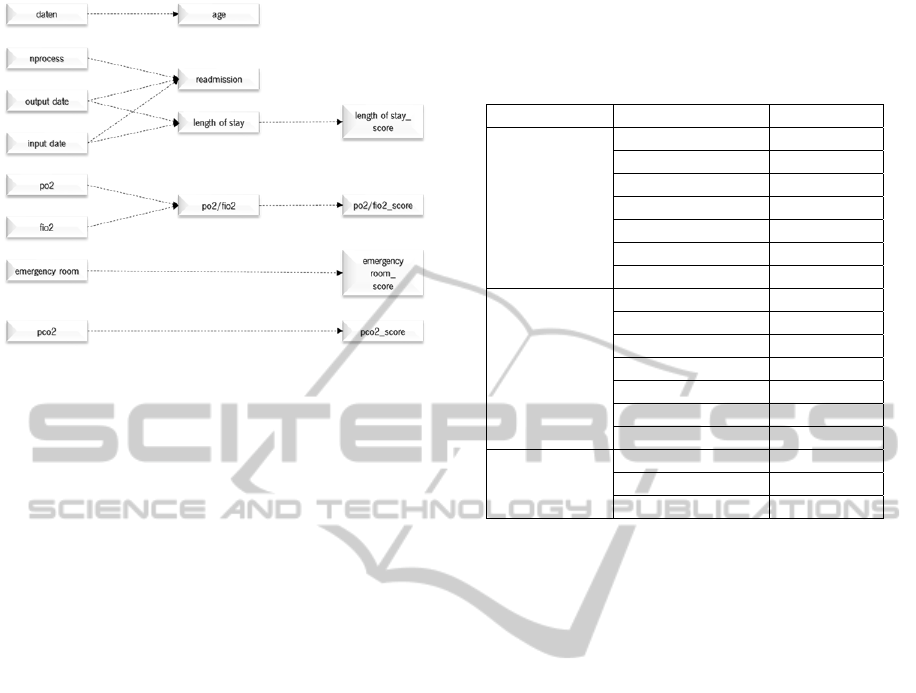
Figure 1: Schematic construction of new data.
PO2/FIO2 and PCO2. Table 1 made a point
between variables and their respective scores
according to SWIFT. Table 1 also presented the
scores domain.
New attributes:
Age: Domain [15 ; +∞ [
Readmission: Domain [0,1]
Length of Stay: Domain [1,76]
PO2/FIO2: Domain [0, +∞ [
Scores:
Emergency Room
Length of Stay
PO2/FIO2
PCO2
In order to induce classification models some of
the input attributes needed to be transformed. The
point is to transform the attributes into discrete and
normalized values in order to be used.
For the attributes PO2/FIO2, PCO2 and Length
of Stay was necessary to convert the continuous
numeric data into class intervals. For this purpose it
was used an approach of equitable distribution of
data classes. Attributes PO2/FIO2 and PCO2 were
equitably distributed however attribute Length of
Stay had a slightly different approach.
The distribution followed the evaluation criteria
of health professionals from CHP, and the attribute
Length of Stay was divided into 3 parts: patients up
to 1 day in hospital, in other words, sick passengers
in ICU, patients between 2 and 5 days of
hospitalization, so patients without extra
complications, like infections or allergies, and
patients with more than 5 days of admission, i.e.,
patients in serious condition with high probability of
extra complications. In Table 3 it is possible to
observe the division of classes.
Table 3: Data overview of the classes created by attribute.
Attribute
Class %
PO2/FIO2
[28-120[ 14.7
[120-167[ 14.0
[167-214[ 14.1
[214-265[ 14.3
[265-328[ 14.2
[328-430[ 14.2
[430-39250[ 14.5
PCO2
[11,3-32,5[ 14.0
[32,5-35,9[ 14.2
[35,9-38,8[ 13.9
[38,8-41,4[ 14.0
[41,4-44,7[ 14.3
[44,7-50[ 14.1
[50-134] 15.5
Length of
Stay
[1] 34.4
[2-5[ 37.8
[5-76] 27.8
3.4 Modelling
This phase focused on getting models to translate
business goals through the application of data
mining techniques. The process suffered two
approaches, one for the normal table generated
(score_swift_A) and one for a second table
(score_swift_B) which suffered an oversampling.
The necessity of using the oversampling technique is
related to the existent dominance of a type of data
distribution over the other. When facing this
imbalance, the models tend to have a greater number
of errors over the minority of the data distribution.
So the oversampling through the data replication,
increase the weight of minority data distribution, in
order to be able to obtain a better performance of the
classification models (Barua, Islam, and Murase,
2013).
In order to understand what has been done in the
1
st
approach (A) the balance is 98.66% for no
readmitted patients and 1,34% for readmitted
patients. For the 2
nd
approach (B) the balance is 51%
for no readmitted patients and 49% for readmitted
patients. This takes into account two different
approaches and eight scenarios using or not
CaseMix.
CaseMix is generally represented as non-clinical
data collected from the patient which may be useful
for analysis and diagnosis or for research purposes.
For the design and evaluation of the models were
used 70% of the data for training and the remaining
DataMiningModelstoPredictPatient'sReadmissioninIntensiveCareUnits
607
30% for the test. The training block is used to
produce the model and the test is used to measure
the ability of generalization of the model. The test
block is also the percentage of data that are not used
in the learning process. The encoding model is
presented as follows:
Target (dependent) =
R
eadmission;
Input (independent) = {Normal, Scores, Class
and CaseMix};
Normal =
{pco2, po2/fio2, emergencyroom,
len
g
th of sta
y}
Scores =
{pco2_score, po2/fio2_score,
emergencyroom_score, lengthof
sta
y_
score
}
Classes =
{class_pco2, class_po2/fio2,
class
_
len
g
thofsta
y
, emer
g
enc
y
room
}
CaseMix = {sex, age}
Models applied to the two approaches are
presented as follows:
M1 = {Normal + Scores}
M2 = {Scores}
M3 = {Normal}
M4 = {Normal + Scores + Class}
M5 = {Normal + Scores + CaseMix}
M6 = {Scores + CaseMix}
M7 = {Normal + CaseMix}
M8 = {Normal + Scores + Class + CaseMix}
Taking into account the two approaches it was
developed a total of 48 models: 2 approaches * 8
scenarios * 3 techniques * 1 target.
In the construction of classification models the
parameters were catalogued using oracle data
mining according to the representation in Table 4.
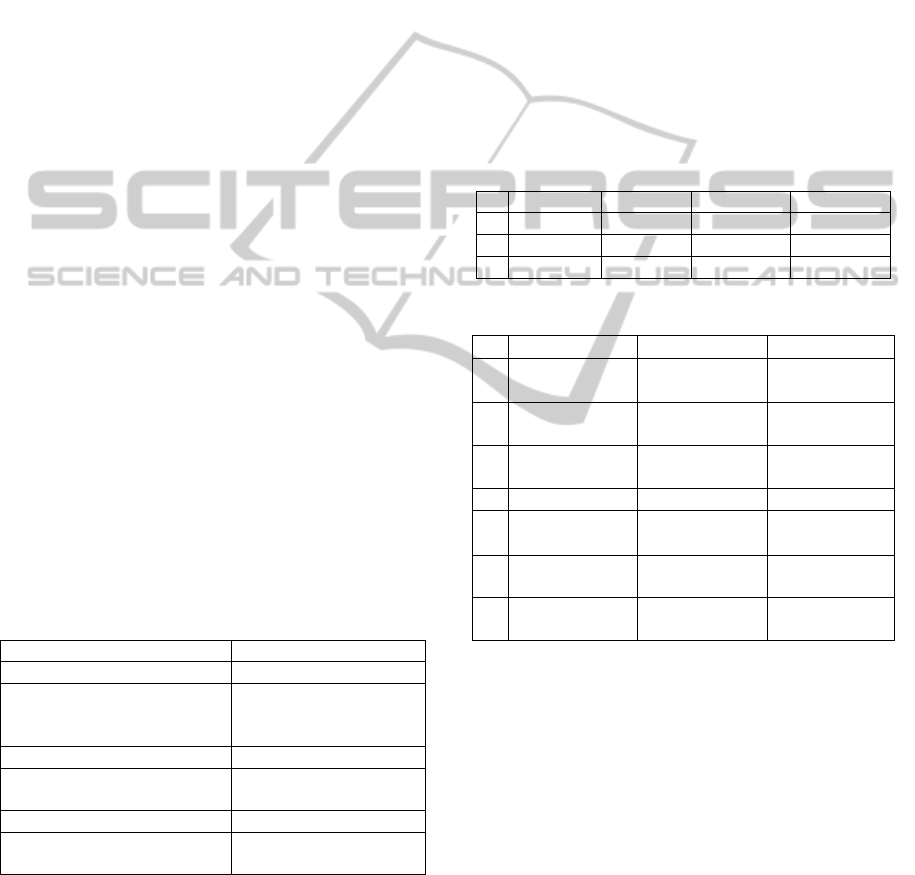
Table 4: Techniques Settings.
Description Values
Algorithm Name Support Vector Machine
Kernel Function Gaussian
Tolerance Value 0,001
Active Learning yes
Algorithm Name Decision Tree
Homogeneity Metric Gini
Maximum Depth 7
Algorithm Name Naive Bayes
Pairwise Threshold 0
Singleton Threshold 0
3.5 Evaluation
The evaluation phase focuses primarily on the
assessment and comparison of the results, noting
whether they meet the initial goals of the project. All
models were reviewed and evaluated in order to find
influencing factors which may have escaped at
earlier stages. In order to prove the results for the set
of models developed for the readmission of patients,
it is possible to observe in Tables 5 and 6 the
attained results in terms of the three metrics:
accuracy, sensitivity and specificity. In Table 5
there are the best three models in terms of accuracy.
As it is possible observe the approach B is the one
that presents the best results and the Naive Bayes
figure as the technique that reaches the highest
values of acuity most precisely with models
NB_M7B and NB_M5B. Also in line with the
results obtained, it is possible to observe through
Table 6 the best 3 models for each metric and
approach.
Table 5: Best models results.
Accuracy Sensitivity Specificity
1º NB_M7B 98.91% 99.67% 98.12%
2º NB_M5B 98.12% 98.02% 98.23%
3º DT_M5B 96.77% 98.51% 95.02%
Table 6: Best models for approach A and approach B.
A Sensitivity Specificity Accuracy
1º
DT_M4A
99.63%
SVM_M4A
71.56%
NB_M5A
94.07%
2º
DT_M1A
99.52%
SVM_M2A
47.48%
NB_M7A
92.51%
3º
SVM_M8A
99.52%
SVM_M1A
42.92%
NB_M8A
91.96%
B Sensitivity Specificity Accuracy
1º
NB_M7B
99.67%
NB_M5B
98.23%
NB_M7B
98.91%
2º
DT_M5B
98.51%
NB_M7B
98.12%
NB_M5B
98.12%
3º
DT_M7B
98.51%
SVM_M7B
95.77%
DT_M5B
96.77%
In order to evaluate the results and to compare
the classification models for patients at the ICU
readmission, an analysis was performed through the
Receiver Operating Characteristic (ROC). The
analysis via ROC curves, which were recently
introduced in the field of DM (Prati, Batista, &
Monard, 2008) have become a powerful tool in the
evaluation of classification models. Currently, the
ROC curves are widely used in medicine, taking into
account its extreme importance in the evaluation of
medical treatments. A point near 100% is the perfect
model, i.e., all positive and negative examples are
correctly classified. From Figure 2 it was observed
that the model NB_M7_CASEMIX_B is what is
closest to the perfect spot, presenting itself as the
best classification model.
ICAART2014-InternationalConferenceonAgentsandArtificialIntelligence
608
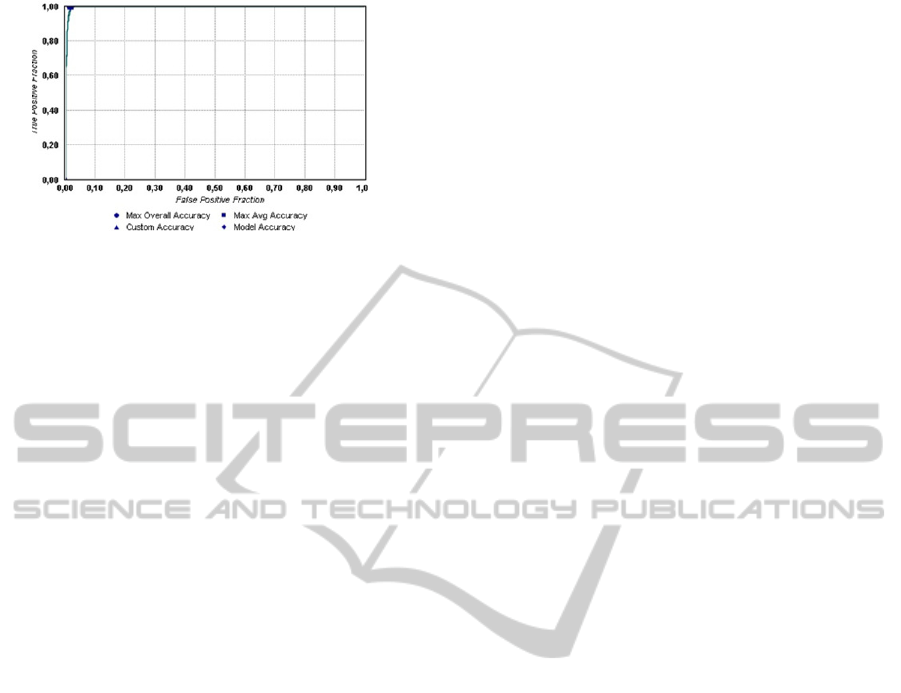
Figure 2: ROC for model
NB_M7_CASEMIX_B.
4 DISCUSSION OF RESULTS
The best classification model in terms of accuracy is
the NB_M7B with a precision of 98.91%, followed
by NB_M5B with 98.12% and DT_M5B with 96,
77%.
The results showed in table 6 corroborated the
idea of being necessary the use of oversampling
techniques. As can be observed for example to the
models without oversampling the best specificity
result it is 71.56% and for the models with
oversampling it is 98.23%. In fact before the use of
the oversampling technique (A) the results were
poor, however after the implementation of
oversampling (B) the results improved significantly.
One thing that is noticeable is that most of the top
ranking models in this study are given through the
technique of DM Naive Bayes. Based on the results
obtained so far it is possible conclude that to obtain
good results it was important to include other non-
clinical attributes of the patient like age and sex.
5 CONCLUSIONS
This work contributed with a set of classification
models that can help health professionals in the
decision making. The models were introduced in
order to predict whether a patient will be readmitted,
or whether a patient won’t be readmitted. The
adoption of these models may result not only in
reducing the high mortality associated to early bad
discharges, but also can contribute to a reduction of
costs of institutions. Furthermore, the impact of
these models on the ICU will be huge, because
allows the health professionals to use them as a
decision support and, consequently, improve the
health care of patients.
6 FUTURE WORK
Completed this study it is important to draw some
prospective directions. Future work will include: To
c
reate new models through the exploration and
inclusion of new
attributes; To determine an
evaluation metric of the models; To create patterns
(clustering) for readmission through the generated
models and integrate the developed models in a
decision support system, in particular INTCare and
optimize the developed models.
ACKNOWLEDGEMENTS
This work is supported by FEDER through
Operational Program for Competitiveness Factors –
COMPETE and by national funds though FCT –
Fundação para a Ciência e Tecnologia in the scope
of the project: FCOMP-01-0124-FEDER-022674.
The authors would like to thank FCT
(Foundation of Science and Technology, Portugal)
for the financial support through the contract
PTDC/EIA/72819/ 2006 (INTCare) and PTDC/EEI-
SII/1302/2012 (INTCare II).
REFERENCES
ACSS, 2012. Administração Central do Sistema de Saúde,
Circular Normativa nº 33/2012 Available at:
http://www.acss.min-saude.pt.
Barua, S., Islam, M. & Murase, K., 2013. ProWSyn:
Proximity Weighted Synthetic Oversampling
Technique for Imbalanced Data Set Learning.
Advances in Knowledge Discovery and Data Mining.
s.l.:Springer Berlin Heidelberg, pp. 317-328.
Chapman, P. et al., 1999. CRISP-DM 1.0, s.l.: SPSS.
Gajic, O. et al., 2008. The Stability and Workload Index
for Transfer score predicts unplanned intensive care
unit patient readmission: Initial development and
validation. Crit Care Med. 676-682.
Gortzis, L. G. et al., 2008. Predicting ICU survival: A
meta-level approach, s.l.: BMC Health Services
Research.
Intelligence, S., 2013. Hospital Readmissions on the
Increase, press release.
Ministério da Saúde, 2003. Cuidados Intensivos:
Recomendações para o seu desenvolvimento.
Portela, F., Pinto, F. & Santos, M. F., 2012. Data Mining
Predictive Models for Pervasive Intelligent Decision
Support in Intensive Care. Advances in Information
Systems and Technologies.
Portela, et al., 2012. Intelligent and Real Time Data
Acquisition and Evaluation to Determine Critical
Events in Intensive Medicine. Procedia Technology.
DataMiningModelstoPredictPatient'sReadmissioninIntensiveCareUnits
609

Prati, Batista & Monard, 2008. Curvas de ROC para
avaliação de classificadores. pp. 215-222.
Russell, S., 1999. Reducing readmissions to the intensive
care unit.. Heart Lung.
Santos, M. F., Mathew, W. & Portela, C. F., 2011. Grid
data mining for outcome prediction in intensive care
medicine, s.l.: Springer CCIS.
Silva, A., 2007. Modelos de Inteligência Artificial na
análise da monitorização de eventos clínicos adversos,
Disfunção/Falência de órgãos e prognóstico do
doente, Universidade do Porto, PHD Thesis;
Taft, M. et al., 2003. Oracle Data Mining Concepts, 10g
Release 1 (10.1), s.l.: Oracle Corporation.
ICAART2014-InternationalConferenceonAgentsandArtificialIntelligence
610
