
Quality Assessment Technique for Enterprise
Information-management System Software
E. M. Abakumov and D. M. Agulova
Department of Information Technologies, All-Russia Research Institute of Automatics, Moscow, Russia
Keywords: Software Quality, Enterprise Information System, Quality Requirement, Quality Evaluation, Quality Model,
Quality Characteristic, Quality Measure.
Abstract: The paper represents an overview of existing methods and standards used for the quality assessment of
computer software. Quality model, quality requirements and recommendations for the evaluation of
software product quality are defined in standards, but there is no unified definition for the algorithm that
describes the process of software quality assessment completely and contains particular methods of
measurement, ranking and estimation of quality characteristics. So the paper describes the technique that
allows obtaining software quality quantitative assessment, defining whether the considered software meets
the required quality level, and, in case it is needed to select between equivalent software tools, allows
comparing them one with each other.
1 INTRODUCTION
Enterprises implementing R&D need in complex
information-management system covering various
activity aspects and related to different classes. In
order to reasonably select certain computer-based
system from a series of similar ones or evaluate
adequacy of the automated system to the required
quality level it is needed to obtain quantitative
estimates of its performance indices.
2 WORLD PRACTICE
World practice knows a number of approaches that
allow assessing computer-based system efficiency
(Scripkin, 2002). Among them there can be marked
out approaches based on evaluation of the direct
financial return resulted from the system installation,
as well as approaches proposed by Norton D. and
Kaplan R. (1996) that are oriented also to
nonfinancial component of automation effect, i.e.
growth of client loyalty, rate of putting on the
market of new products and services, managerial
decision quality and so on. Entropy-based methods
(Prangishvilly, 2003) can be related to another
group. Zelenkov Yu.A. (2013), for instance,
suggests entropy-based approach for assessing
efficiency of computer-aided system that is oriented
to estimation of the degree of unpredictability of the
investigated business process results before, during
and after the system installation. However the
above-listed methods allow judging the system
efficiency either based on the results of its
implementation, which does not allow comparison
of similar systems without their installation, or do
not touch such issues as maintainability, reliability,
usability and etc., i.e. consider not all aspects of the
system functioning.
Set of international standards regard the problem
of software quality assessment. Series of standards
ISO/IEC 9126 describes software quality model and
quality measurements, ISO/IEC 9126-1 (ISO/IEC,
2001) defines the six quality characteristics of the
software product. Previous series of standards could
not support requirement specification at early stage
of development and did not have standard
corresponding to quality requirement analysis
(Esaki
, 2013). ISO/IEC 25030 (ISO/IEC, 2007)
defined quality requirements based on the system
and software quality model described in
ISO/IEC9126-1 (ISO/IEC, 2001). ISO/IEC 25040
(ISO/IEC, 2011) contains requirements and
recommendations for the evaluation of software
product quality based on the specific evaluation
process for developers, acquirers and independent
evaluators described in ISO/IEC 14598-1 (ISO/IEC,
348
M. Abakumov E. and M. Agulova D..
Quality Assessment Technique for Enterprise Information-management System Software.
DOI: 10.5220/0004908203480354
In Proceedings of the 16th International Conference on Enterprise Information Systems (ICEIS-2014), pages 348-354
ISBN: 978-989-758-028-4
Copyright
c
2014 SCITEPRESS (Science and Technology Publications, Lda.)
1998a), ISO/IEC 14598-3 (ISO/IEC, 2000),
ISO/IEC 14598-4 (ISO/IEC, 1999) and ISO/IEC
14598-5 (ISO/IEC, 1998b) and replaced them. It
provides a process description for evaluating
software product quality and states the requirements
for the application of this process.
So quality model, quality requirements and
recommendations for the evaluation of software
product quality are defined in standards, but there is
no unified definition for the algorithm which
describes the process of software quality estimation
completely. Quality characteristics as well as basic
stages of assessment process (measurement, ranking
and estimation) are defined in the standard, however
there are no particular methods of measurement,
ranking and estimation defined in it.
3 PROBLEM FORMULATION
So it is necessary to develop quality metering
technique within the framework of which solving of
the stated problem can be divided into the stages
shown in Figure. 1:
System
description
based on
quality indices
Measurement
using quality
indices
Ranking of
measurement
Obtaining
overall
assessment
Figure 1: Solving stages of the stated problem.
Fulfillment of the stage named System
Description Based on Quality Indices requires the
following:
1. Determine list of characteristics based on
which the software must be assessed (this list
may differ for different enterprises or
computer-based systems);
2. Determine list of basic aspects that must be
described in order to evaluate the software
based on the specified characteristics;
Fulfillment of the stage named Measurement
Using Quality Indices requires the following:
3. Define quality indices measuring procedures;
Fulfillment of the stage named Ranking of
Measurement Results requires the following:
4. Determine the appropriate ranking level for
each index;
Fulfillment of the stage named Obtaining
Overall Assessment requires the following:
5. Suggest a method that allows obtaining of the
software quality overall assessment.
So the problems are stated that must be solved
for obtaining quantitative assessment of the software
quality.
4 PROBLEM SOLVING
As one of the variants for forming the list of
characteristics there was considered a variant of the
list compilation based on the analysis of
environment in which the software of one of the
Russian industrial enterprises is operated. However
in this case there is risk of considering not all the
indices and it is needed to substantiate
comprehensiveness of the list obtained. Therefore
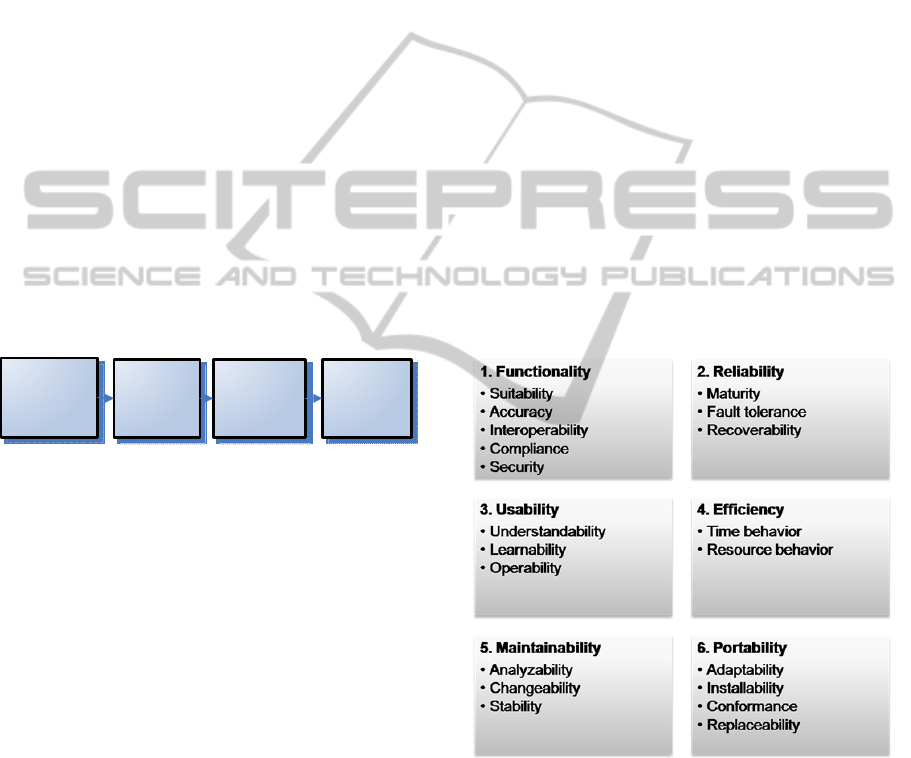
another alternative is selected to take as a basis
complete list provided in ISO 9126 International
Standard specifying major characteristics and
corresponding to them software quality indices. In
this case there appears a problem of irrelevance of a
number of indices, but it is solved by use of
relevance coefficients when obtaining overall
assessment. Figure 2 provides list of quality
characteristics and indices specified in the standard.
Figure 2: Characteristics and indices.
For each of the above mentioned indices the
authors developed a list of objects the requirements
(ISO/IEC, 2007) to which must be formulated, and
according to which the considered software must be
described for assessing its quality; measuring
procedures are also suggested (see Table 1).
QualityAssessmentTechniqueforEnterpriseInformation-managementSystemSoftware
349
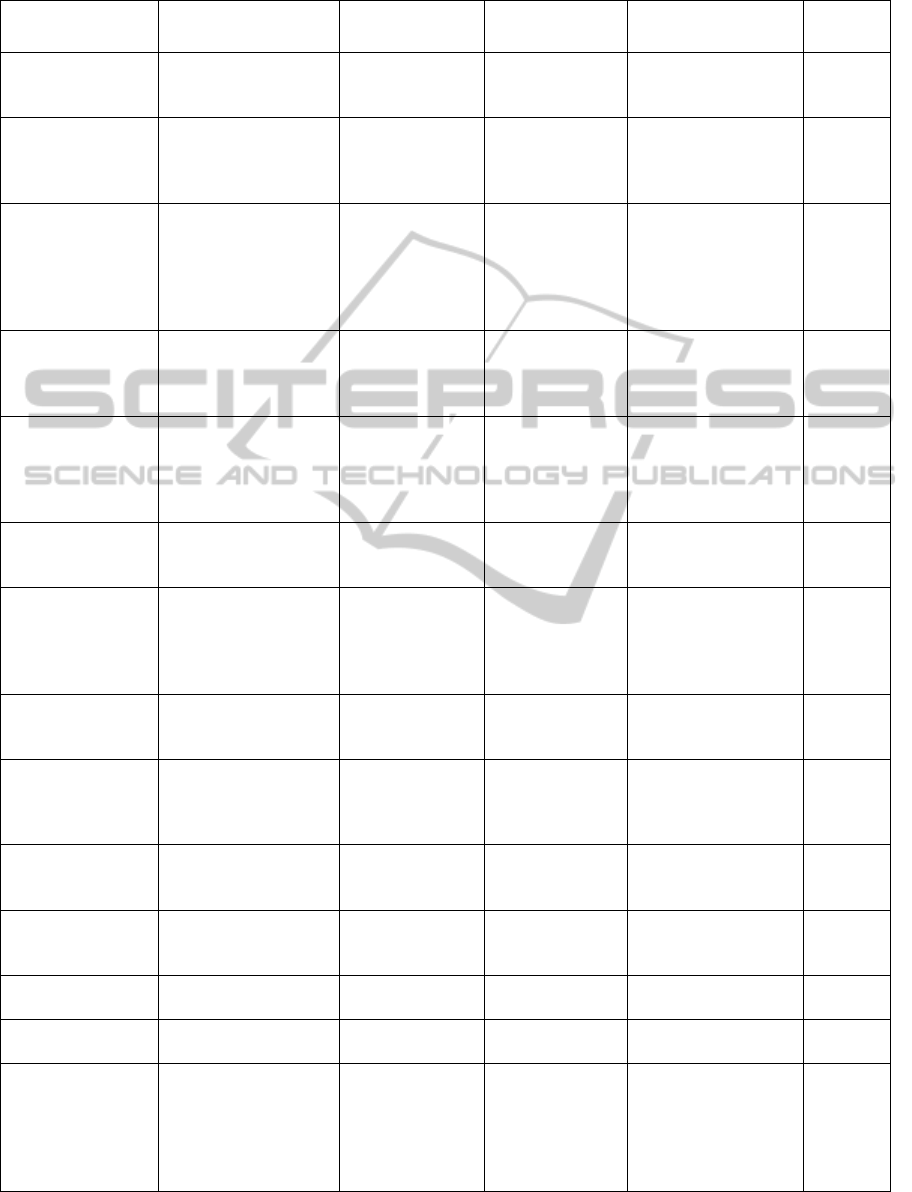
Table 1: Requirements and measuring procedures.
Quality Index
Quality Index
Description
Program
Description
Requirements to
Program
Measuring Procedure
Measuring
Unit
1 Suitability
Appropriateness of a
set of functions to
specified tasks
List of tasks that
are solved by the
system
List of tasks that
the system must
solve
Calculation (% of
fulfilled tasks relative
to the required ones)
%
2 Accuracy
Consistency of the
results obtained and the
expected ones
Results of
functions
execution
Requirements to
the results of
function
execution
Calculation (% of the
results obtained
relative to the
expected ones)
%
3 Interoperability
Ability to interact with
specified systems
List of
computerized
systems with
which the
considered system
is able to interact
List of
computerized
systems with
which the
considered system
must interact
Calculation (% of
available systems
relative to the
required ones)
%
4 Compliance
Compliance with
standards, conventions,
laws
List of standards
and conventions
the system is
compliant with
List of standards
and conventions
the system must
be compliant with
Calculation (% of
satisfied standards
relative to the
required ones)
%
5 Security
Software ability to
prevent unauthorized
access to functions and
data
Test set for
unauthorized
access to be
passed by the
system
Calculation (% of
successful tests)
%
6 Maturity
Frequency of failures
due to software errors
Frequency of
failures due to
software errors
Statistics (% of system
failures due to
software errors)
%
7 Fault Tolerance
Ability to provide
specified performance
quality level in case of
program errors
Number of
functions in
operable state in
case of system
hole
Statistics (% of
functions in
operable state)
%
8 Recoverability
Ability to recover data
and performance
quality level
Sequence of data
recovering
operations
Statistics (% of
recovered data)
%
9 Understandability
User efforts to
understand general
logical concept
User time spent
for understanding
general logical
concept
Statistics (average
spent time)
hour
10 Learnability
User learning efforts to
train in software
applying
Time spent by
user for learning
Statistics (average
spent time)
hour
11 Operability
User efforts to operate
and control
User time spent
for operation and
operating control
Statistics (average
spent time)
hour
12 Time Behavior
Rate of functions
execution
Rate of functions
execution
Statistics (average
execution time)
min
13 Resource
Behavior
Volume of used
resources
Volume of used
resources
Measurement Kb
14 Analyzability
Efforts needed for
diagnostics of
imperfections, potential
failures, determination
of components to be
upgraded
Code metrics
(metrics of
program stylistics
and
understandability)
Calculation
ICEIS2014-16thInternationalConferenceonEnterpriseInformationSystems
350
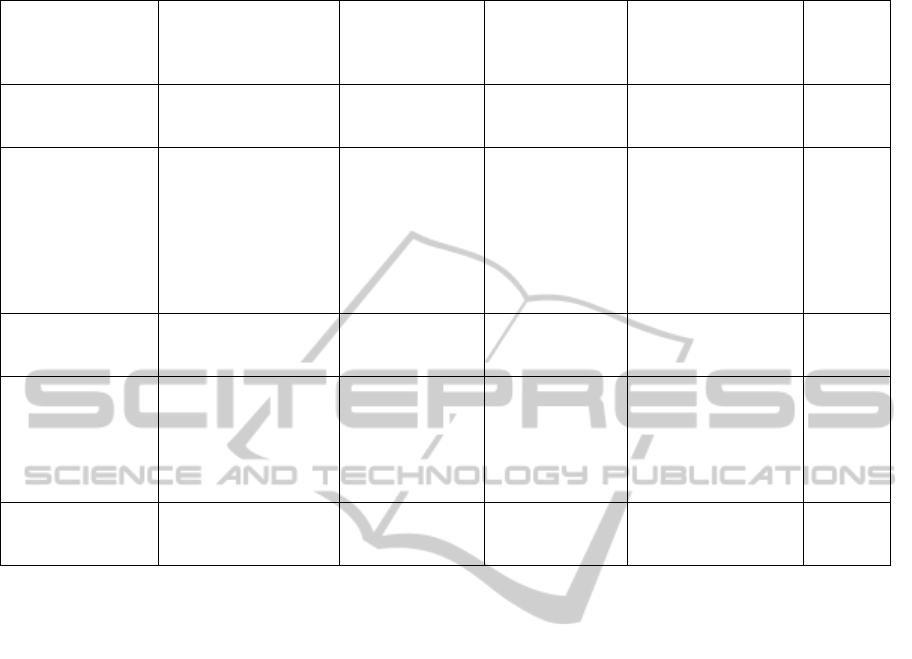
Table 1: Requirements and measuring procedures (cont.).
15 Changeability
Efforts needed for
modification, failure
recovery or change of
external environment
Code metrics
(code cyclomatic
complexity)
Calculation
16 Stability
Risk of unforeseen
effects caused by
system changes
Number of faults
revealed while
changes
Statistics (average
number of faults per
one modification)
17 Adaptability
Ease of adaptation to
various operating
environments
Specification of
conditions
(requirements to
PC, necessary
additional
software) at which
program operation
is possible
Peer review
18 Installability
Efforts needed for the
software installation
Software
installation
instructions
Calculation (time
period needed for the
system installation)
hour
19 Conformance
Software capability of
being compliant with
standards and
conventions accepted
in the sphere of
installation
List of standards
and conventions
the software
complies with
List of standards
and conventions
the software must
comply with
Calculation (% of
satisfied standards
relative to the required
ones)
%
20 Replaceability
Possibility to use
another similar
software tool instead
Description of
software tool to
be applied instead
Peer review
Values of indices 1 – 4, 19 (% of executed
functions, laws and etc. relative to the required ones)
(P
i
) are calculated according to an expression given
in the following form:
100))(/(
)(
1
1
TFlengthsP
TFlength
i
i
(1)
where
otherwise ,0
)(..1, if 1 TFlengthiF
i
tf
i
s
(2)
F={f
1
,f
2,
…f
n
} is a set of functions (laws, systems
and etc.) that the system can execute (satisfy,
interact with),
TF={tf
1
,tf
2,
…tf
m
} is a set of functions (laws, systems
and etc.) that the system must execute (satisfy,
interact with).
Values of indices 5 – 8 (% of tests passed, data
recovered and etc.) are calculated according to the
following expression:
100)/(
1
nBP
n
i
ii
(3)
where
n is a number of measured parameters,
В
i
is a value of the parameter measured (0
means that the test has not been passed, data is not
recovered and so on, 1 means otherwise), i=1..n.
Average value (indices 9 – 12, 16) is calculated
using formula:
nZP
n
ii
/
11
(4)
where
n is a number of measured parameters,
Z
i
is a value of the parameter measured,
i=1..n
The simplest metrics of the program stylistics
and understandability (index 14) is the estimate of
the program saturation with comments F:
F=N
com
/N
line
(5)
where
N
com
is a number of lines having comments in
the program,
N
line
is a total number of program lines.
Based on practical experience it is considered
that F>=0.1, i.e. minimum one comment must be per
every ten lines of the program. The study shows that
comments are distributed through the program text
nonuniformly: they are in excess in the beginning of
the program, while the program middle or end lacks
QualityAssessmentTechniqueforEnterpriseInformation-managementSystemSoftware
351

of them. This can be explained by the fact that as a
rule in the beginning of the program there are
identifier specification statements requiring denser
comment. In addition, in the program beginning
there are also located “headlines” including general
information on the developer, nature, functionality
of the program and so on. Such saturation
compensates lack of comments in the program body,
and therefore formula (5) does not quite accurately
reflect the level of the program saturation with
comments in the functional part of the text. Hence
more informative is a variant in which all the
program is divided into n equal segments for each of
which Fi is defined:
F
i
= sign (N
com
/N
line
- 0.1) (6)
and here
n
i
i
FF
1
(7)
The level of the program saturation with
comments is considered to be normal if F=n
condition is true.
Halstead M. (1981) suggested the method of
calculating a characteristic allowing estimation of
the quality level of programming L:
L=V'/V (8)
where
V=N*log
2
n is a program volume,
V'=N'*log
2
n' is theoretical volume of the program,
n
1
is a number of unique program statements
(dictionary of statements),
n
2
is a number of unique program operands
(dictionary of operands),
N
1
is a total number of statements in the
program,
N
2
is a total number of operands in the
program,
n
1
' is a theoretical number of unique
statements,
n
2
' is a theoretical number of unique
operands,
n=n
1
+n
2
is the program dictionary,
N=N
1
+N
2
is the program size,
n'=n
1
'+n
2
' is theoretical program dictionary,
N'= n
1
*log
2
(n
1
) + n
2
*log
2
(n
2
) is
theoretical program size (for stylistically correct
programs deviation of N from N' does not exceed
10%).
For estimation of cyclomatic complexity (index
15) it is proposed to use the method suggested by
McCabe T.J. (1976). In calculations program
management flow graph is used: graph junctions
correspond to indivisible blocks of program
instructions and directed edges every of that
connects two junctions and corresponds to two
instructions, the second of which can be executed
immediately after the first one. Then complexity M
is defined as follows:
M = E − N + 2P (9)
where:
E is a number of edges in graph,
N is a number of junctions in graph,
P is a number of connectivity components (set
of graph nodes such that for any two nodes of this
set there exists route from one node to another, and
there is no route from the set node to a node not of
this set).
According to McCabe it is recommended to
calculate the complexity of the developed modules,
and divide the latter into smaller ones every time
when their cyclomatic complexity exceeds ten.
Currently the market offers a number of finished
products allowing automatic calculation of code
metrics. For instance, Microsoft Visual Studio,
Embarcadero RAD Studio XE, NDepend, IBM
Rational ClearCase, and Source Monitor.
Measuring procedures for quality indices are
defined above. In order to determine ranking level
corresponding to the value measured let us introduce
the following symbols:
r is a number of ranking levels (1
st
ranking level
corresponds to the worst values of indices, r
th
level –
to the best ones);
i
R
is i
th
ranking level;
min
P
is the value of index that is critical for
selection of ranking level better than the 1
st
one;
max
P
is the value of index that is critical for
selection of ranking level worse than the r
th
one,
then correspondence between values and ranking
levels can be defined in the following way:
Table 2: Correspondence between values and ranking
levels.
Level Index value
1
... …
… …
min
P
)]1(
2
);1(
2
(
minmax
min1
minmax
min
ii
R
r
PP
PR
r
PP
P
i
R
r
R
max
P
ICEIS2014-16thInternationalConferenceonEnterpriseInformationSystems
352

Below an example is given of determining
correspondence between value and ranking level for
percentagewise measured indices.
Let us consider 5 possible ranking levels (r=5),
and specify
%,80 %;20
maxmin
PP
then applying formulas given in Table 2 we will
obtain:
Table 3: Example for percentagewise measured indices.
Level Index value
1 ≤20%
2
3 (40;60]%
4 (60;80]%
5 >80%
Let us introduce the following symbols in order
to solve the problem of obtaining overall quality
assessment:
P is a set of indices based on which the software
is assessed,
k is a number of assessed indices,
P
i
is measured value of index, i=1..k,
)(
ii
P
is corresponding ranking level, i=1..k,
i
is i
th
index relevance,
(is determined
individually for each software by method of paired
comparisons (Hvastynov, 2002)) , i=1..k,
r is a number of ranking levels,
then overall software quality assessment K can be
represented in the form of:
k
i
iii
PK
1
)(
(10)
and maximum value of quality assessment criterion
in the form of:
k
i
i
rK
1
max
(11)
So for software quality assessment it is necessary
to do the following:
1. Describe the requirements to the program (see
Table 1, column Requirements to Program);
2. Describe the program in accordance with
quality indices (see Table 1, column Program
Description);
3. Define relevance of quality indices (
i
);
4. Obtain quantitative assessment based on
quality indices P
i
(formulas 1 – 9)
;
5. Determine the number of ranking levels and
correspondence between quality index
)(
ii
P
values and ranking levels;
6. Obtain overall software quality assessment K
according to formula 10.
In order to solve the task of the software quality
conformance to the specified criterion it is needed to
determine the value of the criterion
g
K
by
expertise so that
max
0 KK
g
(12)
in this case if assessment value is
q
KK
, then the
software under consideration meets the required
quality level.
Developed technique was used by the authors
for the quality assessment of the enterprise
information-management system software which
was established in the institute and for the
comparison of this system with similar computer
programs and for demonstrating of its effectiveness.
5 CONCLUSIONS
So the paper describes the method that allows
obtaining software quality quantitative assessment,
defining whether the considered software meets the
required quality level, and, in case it is needed to
select between equivalent software tools, allows
comparing them one with each other.
REFERENCES
Esaki K., 2013. System Quality Requirement and
Evaluation.
Global Perspectives on Engineering
Management.
3 (5). p. 52-59.
Halstead, M., 1981.
Начала науки о программах,
Finance and Statistics. Moscow.
Hvastynov, P.M., 2002. Экспертные оценки в
квалиметрии машиностороения
, Technoneftegas.
Moscow.
ISO/IEC, 1998a. ISO/IEC14598-1: Information
Technology-Software Product Evaluation-Part1:
General overview,
ISO. Geneva.
ISO/IEC, 1998b. ISO/IEC14598-5: Information
Technology-Software Product Evaluation-Part5:
Process for evaluators,
ISO. Geneva.
ISO/IEC, 1999. ISO/IEC14598-4: Information
Technology-Software Product Evaluation-Part4:
Process for Acquirers,
ISO. Geneva.
)]%12(
25
2080
02 );11(
25
2080
20(
QualityAssessmentTechniqueforEnterpriseInformation-managementSystemSoftware
353

ISO/IEC, 2000. ISO/IEC14598-3: Information
Technology-Software Product Evaluation-Part3:
Process for developers,
ISO. Geneva.
ISO/IEC, 2001. ISO/IEC 9126-1: Software engineering-
Product quality model,
ISO. Geneva.
ISO/IEC, 2007.
ISO/IEC25030: Software engineering-
Software product Quality Requirements and
Evaluation (SQuaRE)-Quality requirement,
ISO.
Geneva.
ISO/IEC, 2011. ISO/IEC25040: Software engineering-
System and software Quality Requirements and
Evaluation (SQuaRE) - Evaluation process,
ISO.
Geneva.
McCabe T.J., 1976, A complexity measure.
IEEE
Transactions on Software Engineering.
4 (12). p. 308-
320.
Norton D. and Kaplan R., 1996. The Balanced Scorecard:
translating strategy into action
, Harvard Business
Press. Boston.
Prangishvilly, I.V., 2003. Энтропийные и другие
системные закономерности: Вопросы управления
сложными системами,
Science, Moscow.
Scripkin, G.K., 2002.
Экономическая эффективность
информационных систем
, DMK Press. Moscow.
Zelenkov, Yu.A., 2013.
Искусство бега по граблям.
Стратегическое управление ИТ в условиях
неопределенности
, Kroc. Moscow.
ICEIS2014-16thInternationalConferenceonEnterpriseInformationSystems
354
