
Principal Component Analysis based Colour Scheme Optimisation in
Eye Fundus Images
Contrast Enhancement for Detection and Evaluation of Drusen in Age Related
Macular Degeneration Patients' Follow up
Algimantas Kriščiukaitis
1
, Robertas Petrolis
1
, Daiva Stanislovaitienė
2
and Dalia Žaliunienė
2
1
Lithuanian University of Health Sciences, Eiveniu str. 4, Kaunas, Lithuania
2
Eye Clinics of Lithuanian University of Health Sciences, Eiveniu str. 2, Kaunas, Lithuania
Keywords: Principal Component Analysis, Eye Fundus Imaging, Drusen, Age Related Macular Degeneration.
Abstract: Efficiency of the patient status monitoring in Age Related Macular Degeneration cases, based on evaluation
of morphological properties eye fundus images, can be significantly increased by specific contrast
enhancement in the images. Objects of interest - drusen (focal deposits of extracellular debris located
between the basal lamina of the retinal pigment epithelium and the inner collagenous layer of Bruch
membrane) usually are represented by various intensity but the same unique color in the image.
Construction of the optimal color scheme to increase the contrast of drusen can be realized by means of
Principal Component Analysis, which transforms original RGB color representation into principal
components space. The study demonstrates that proposed method can increase contrast-to-noise ratio of the
drusen areas 10-fold or more.
1 INTRODUCTION
Age related macular degeneration (ARMD) is a
degenerative disease usually occurring in people
over the age of 50 years. Condition and severity of
ARMD is classified according to diagnostic features
obtained from eye-fundus images. Such features are
estimates characterizing morphology and area
covered by drusen, focal deposits of extracellular
debris located between the basal lamina of the
retinal pigment epithelium (RPE) and the inner
collagenous layer of Bruch membrane (Spaide,
2010). The main forms of ARMD are defined
according to specific lesions, the characteristics of
drusen plays an important role here (Bird, 1995).
Evaluation of drusen properties is used for
monitoring of patient status dynamics. Area covered
by drusen and sizes of them are usually estimated by
means of various heuristic morphometric algorithms.
Efficiency of such algorithms mostly depends on
contrast between drusen area and background.
Therefore preprocessing of images usually starts
from selection of optimal spectral domain
maximizing this contrast. Spaide with coauthors
(Spaide, 2010) introduces optico-physical model
based spectral characteristics for differentiation of
drusen types classified by Gass (Gass, 1997):
discrete yellow-white punctate elevations (“hard”
drusen); large pale-yellow “placoid or dome-shaped
structures” (“soft” drusen) are seen in the eye fundus
singly or in groups. The color of the drusen depends
on its main substance and optical characteristics of
the covering layers. It is reported that all types of
drusen contain one main substance called
“lipoprotein-derived debris”, a lipid-rich material
(Curcio, 2009); (Russel, 2000). So it is expected that
the certain type of drusen observed in particular eye
fundus image probably will have unique, but the
same color. Due to its structure and location in
regard to illuminating light source and camera the
intensity could vary, however the color will remain
the same.
Determination of optimized color combinations
for blood vessels detection in eye fundus images is
reported in (Patasius, 2009). The performance of the
method was estimated by sensitivity (proportion of
correctly identified blood vessel pixels) and
specificity (proportion of correctly identified non-
blood vessel pixels). Optimization algorithm
maximizing area under ROC curve obtained using
66
Kriš
ˇ
ciukaitis A., Petrolis R., Stanislovaitien
˙
e D. and Žaliunien
˙
e D..
Principal Component Analysis based Colour Scheme Optimisation in Eye Fundus Images - Contrast Enhancement for Detection and Evaluation of
Drusen in Age Related Macular Degeneration Patients’ Follow up.
DOI: 10.5220/0004910500660069
In Proceedings of the International Conference on Bioimaging (BIOIMAGING-2014), pages 66-69
ISBN: 978-989-758-014-7
Copyright
c
2014 SCITEPRESS (Science and Technology Publications, Lda.)

training set images gives optimized color scheme.
Determination of special color scheme for detection
of drusen described in (Patasius, 2009-2). However
efficiency of universal predetermined color scheme
is sensitive to particular image registering conditions
and color distortions (e.g. white balance).
Individualized color scheme for every particular eye
fundus image can reveal even more important
diagnostic details related with preliminary detected
drusen. In this study we aimed to elaborate such
method.
The ordinary pixel of the color image is
represented as point in orthogonal RGB space. All
pixels of the same color but different intensity will
appear along certain direction in the RGB. It is
possible to find an optimal transform of given RGB
space that one of the axes of new coordinate system
will go along this direction representing color of the
drusen. Such transform could be found using
Principal Component Analysis (PCA). The aim of
this study was to show how PCA could be used to
find an optimal transform of representation of eye
fundus image in RGB space into optimal space,
maximizing contrast of drusen.
2 METHODS
Eye fundus images were taken using fundus camera
(Carl Zeiss Meditec AG, Germany) in 134 ARMD
patients who underwent treatment in Eye Clinics of
Lithuanian University of Health Sciences. Image
processing was performed using elaborated
programs in MatLab computation environment.
The experts (experienced Ophthalmologists)
have marked drusen areas in original eye fundus
images for further analysis. Contrast-to-noise ratio
of representation of drusen was evaluated according
following criteria:
C
M
d
M
b
s
b
,
(1)
where M
d
- mean of pixel values in drusen area; M
b
-
mean of pixel values in non-drusen area; s
b
-
standard deviation of pixel values of non-drusen
area.
Original representation of eye fundus images -
three-dimensional arrays representing pixel values in
red, green and blue colors, were transformed into
two dimensional arrays, concatenating all rows of
one color of the image into one. The resulting array
consisted of three rows representing pixel values in
red, green and blue colors respectively:
X
x
r1
x
r 2
... x
rn
x
g1
x
g2
... x
gn
x
b1
x
b2
... x
bn
,
(2)
Principal Component Analysis transforms original
representation into new space of variables
maximizing variation and concentrating correlated
original variables (Jollife, 2002). If pixel values of
drusen area make enough big contribution to total
variance of image pixel values, we can expect that
first, or at least one of the first new variables
(principal components) will maximize contrast of
drusen areas versus the rest of the image. Spatial
correlation of original image representation X can be
estimated as:
R
X
1
3
N
X X
T
.
(3)
The eigenvector equation for R
X
is:
R
X
,
(4)
where Λ denotes the eigenvalue matrix with the
eigenvalues sorted in descending order, and Ψ is the
corresponding eigenvector matrix. The matrix Ψ
defines an orthonormal transformation, which is
applied to the original data X
Y
T
X
(5)
to obtain the transformed representation, rows of
which contain principal components of X.
Principal components were trasformed back to
two-dimensional arrays and shown to the experts.
Contrast-to-noise ratio was evaluated according to
formula (1) in principal component in which drusen
areas were most clearly visible.
3 RESULTS
Example of typical eye fundus image containing
drusen presented in Figure 1 and original
representation of its pixel values in orthogonal RGB
space on Figure 2. Pixel values of drusen areas form
prolonged cluster marked by the arrow. As one can
see, maximal variance of this part of the pixels is in
the direction close to the direction of G axis. It
complies with the results reported by (Patasius,
2009-2) that biggest part of information for drusen
detection should be taken from green color. On the
other hand, it confirms our expectations that drusen
areas due to their physicochemical properties
PrincipalComponentAnalysisbasedColourSchemeOptimisationinEyeFundusImages-ContrastEnhancementfor
DetectionandEvaluationofDruseninAgeRelatedMacularDegenerationPatients'Followup
67
probably will have different intensity but the same
color. So we can expect that PCA will find an
optimal representation space where one axis will go
along this linearly looking cluster of the pixel
values.
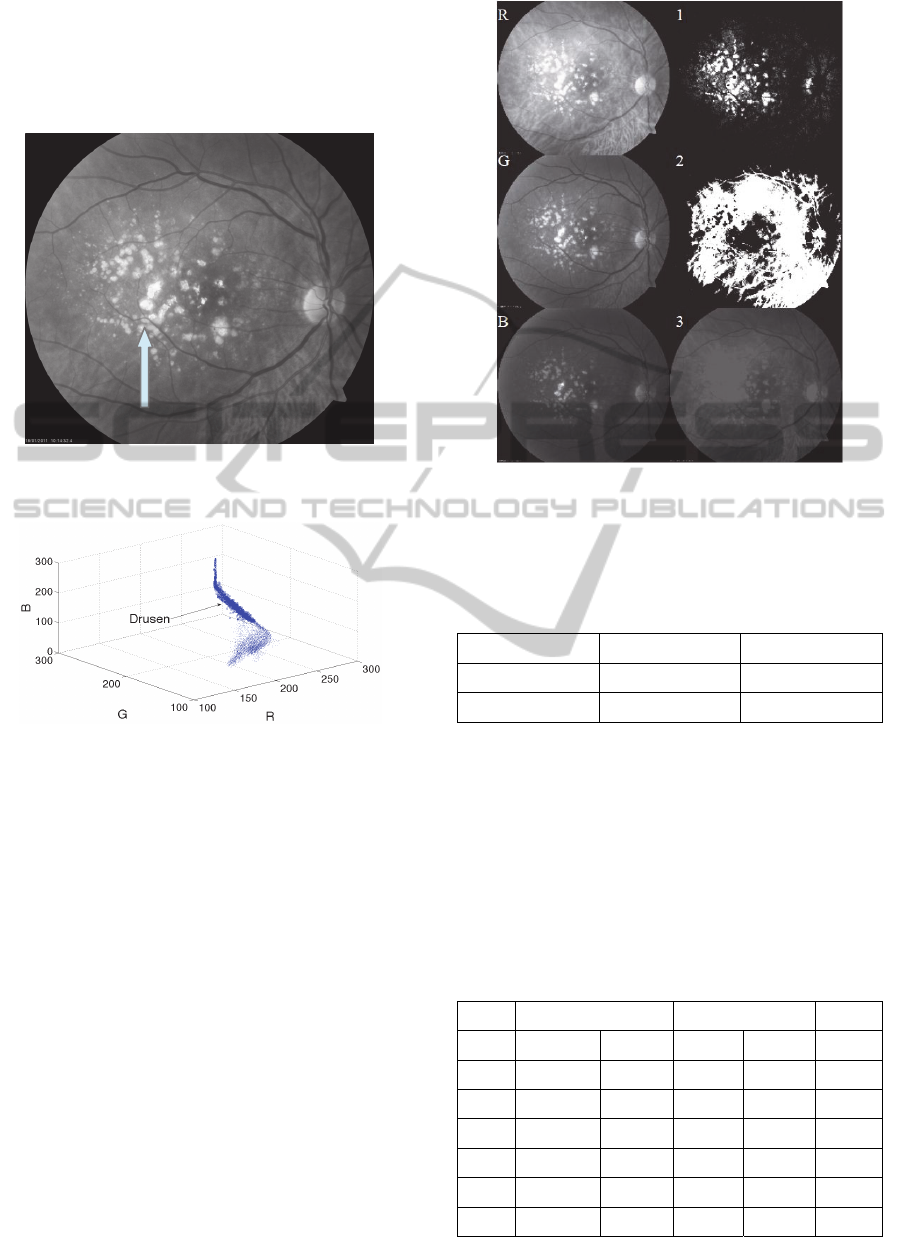
Figure 1: Original representation of the eye fundus image.
Drusen are white spots on the image marked by arrow.
Figure 2: Original representation of the pixel values of eye
fundus image in RGB space. Drusen area pixels form
linearly prolonged cluster.
Figure 3 illustrates typical result of PCA on eye
fundus image containing drusen. Three images in the
left column represent red, green and blue
components of original image. Right column of the
images represents three principal components of this
image. As one can see, maximal visual difference in
intensity between drusen area and the rest of the
image is in the first principal component. It looks
much bigger then in the green component of the
original image, recommended by other authors.
Eigenvector matrix calculated for the image
shown in figure 1 is presented in table 1. Values
used to construct first principal component of this
image (shown in italics) correspond to the
coefficients for construction of optimal color
combination proposed by (Patasius, 2009-2): 0.0287;
0.6975; -0.2738 for R, G and B components
respectively. Eigenvector values of the other
analysed pictures were in the same range.
Figure 3: Example of PCA on typical eye fundus image
containing drusen. Original R, G and B components of the
image presented on the left column. Three principal
components of the image are prsented on the right column.
Table 1: Eigenvector matrix calculated for image
presented in Figure 1.
-0,15
0,62 0,77
0,68
-0,5 0,53
-0,72
-0,61 0,35
Values of the contrast-to-noise estimates for this
image are presented in table 2. The maximal
contrast-to-noise estimate value 4.37 is for green
component of the original image, however the same
estimate reaches 98.56 for Y1 principal component,
showing significant increase in contrast after PCA
procedure. In majority of images increase in contrast
was at least 10 fold or more.
Table 2: Mean pixel values of drusen and non-drusen
areas and contrast-to-noise estimates C.
Drusen Non-drusen C
Mean StDev Mean StDev
R 237,84 84,89 173,52 581,13 2,67
G 184,81 796 116,07 247,82 4,37
B 109 505,44 74,68 92,96 3,56
Y1 248,1 137,29 39,84 4,46
98,56
Y2 179,84 84,39 351,63 184,09 12,66
Y3 102 0.51 88,12 462,43 0,65
Drusen
BIOIMAGING2014-InternationalConferenceonBioimaging
68

Visual inspection of the images showed good
compliance between areas of highest intensity pixels
in first principal component with drusen areas
marked by the experts in original images.
4 DISCUSSION
Similarity of values in the first eigenvector used to
construct first principal component to the color
coefficients proposed in (Patasius 2009-2) shows
that method constructs particular color scheme
similar to the universal one. However we expect that
our scheme will compensate influence of registering
conditions and other technical factors eventually
having critical impact on final result. This advantage
will be proven in future experiments.
The analyzed raw data are homologous in all
initial dimensions because of the same origin (the
same type of registering equipment only in different
colors). Therefore is no need to perform any
normalization and we can’t expect any better results
from higher-level multivariate methods (e.g. Kernel
PCA).
Usage of certain principal component instead of
original image can increase the performance of
automatic drusen area evaluation algorithms. Visual
evaluation of this principal component can reveal
more image details for the expert.
The usage of the method is not limited to the
drusen. It could be used to increase contrast of other
unicolor objects in the images as well.
Limitations of the method: We have only three
original variables determining limited space for
calculated principal components. So one should be
sure that part of the variance corresponding to
drusen should be at least amongst top three,
otherwise PCA will ignore it. It means that some
critical minimal area of the image should be covered
by the drusen, exact percentage of it will be
determined in further investigations.
5 CONCLUSIONS
Principal component analysis based eye fundus
image preprocessing is significantly increasing
contrast-to-noise ratio of drusen area for further
automatic detection or visual examination.
REFERENCES
Bird A. C., Bressler N. M., Bressler S. B., et al. An
international classification and grading system for age-
related maculopathy and age-related macular
degeneration. The International ARM Epidemiological
Study Group. Surv Ophthalmol 1995;39:367–74.
Curcio C. A., Johnson M., Huang J-D., Rudolf M. Aging,
age-related macular degeneration, and the Response-
to-Retention of apolipoprotein B-containing
lipoproteins. Prog Ret Eye Res 2009;28:393– 422.
Gass, J. D. M. Stereoscopic atlas of macular diseases:
diagnosis and treatment. 4. St. Louis: Mosby; 1997.
Jolliffe I. T. Principal Component Analysis. Springer-
Verlag; 2nd edition (2002) ISBN: 0387954422
Patašius M., Marozas V., Jegelevičius D., Lukoševičius A.
Optimal Combinations of Color Space Components
for Detection of Blood Vessels in Eye Fundus Images.
Electronics And Electrical Engineering 2009. No.
3(91) 53-56.
Patašius M., Marozas V., Jegelevičius D., Lukoševičius
A., Špečkauskas M. “Biomedical Engineering“, Proc.
Int Conf. Kaunas 2009;160:163.
Russell S. R., Mullins R. F., Schneider B. L., Hageman G.
S. Location, substructure, and composition of basal
laminar drusen compared with drusen associated with
aging and age-related macular degeneration. Am J
Ophthalmol 2000;129:205–14. [PubMed: 10682974]
Spaide R. F., Curcio C. A. Drusen characterization with
multimodal imaging. Retina. 2010 Oct;30(9):1441-54.
PrincipalComponentAnalysisbasedColourSchemeOptimisationinEyeFundusImages-ContrastEnhancementfor
DetectionandEvaluationofDruseninAgeRelatedMacularDegenerationPatients'Followup
69
